Article Text

Abstract
Background To characterise early stages of geographic atrophy (GA) development in age-related macular degeneration (AMD) and to determine the prognostic value of structural precursor lesions in eyes with intermediate (i) AMD on the subsequent GA progression.
Methods Structural precursor lesions for atrophic areas (lesion size at least 0.5 mm² in fundus autofluorescence images) were retrospectively identified based on multimodal imaging and evaluated for association with the subsequent GA enlargement rates (square-root transformed, sqrt). A linear mixed-effects model was used to account for the hierarchical nature of the data with a Tukey post hoc test to assess the impact of the local precursor on the subsequent GA progression rate.
Results A total of 39 eyes with GA of 34 patients with a mean age of 74.4±6.7 (±SD) years were included in this study. Five precursor lesions (phenotypes 1–5) preceding GA development were identified: large, sub-retinal pigment epithelial drusen (n=19), reticular pseudodrusen (RPD, n=10), refractile deposits (n=4), pigment epithelial detachment (n=4) and vitelliform lesions (n=2). Precursor lesions exhibited a significant association with the subsequent (sqrt) GA progression rates (p=0.0018) with RPD (phenotype 2) being associated with the fastest GA enlargement (2.29±0.52 (±SE) mm/year.
Conclusions The results indicate the prognostic relevance of iAMD phenotyping for subsequent GA progression highlighting the role of structural AMD features across different AMD stages.
- imaging
- macula
- retina
- degeneration
This is an open access article distributed in accordance with the Creative Commons Attribution Non Commercial (CC BY-NC 4.0) license, which permits others to distribute, remix, adapt, build upon this work non-commercially, and license their derivative works on different terms, provided the original work is properly cited, appropriate credit is given, any changes made indicated, and the use is non-commercial. See: http://creativecommons.org/licenses/by-nc/4.0/.
Statistics from Altmetric.com
Introduction
In the Western population, age-related macular degeneration (AMD) is the major cause for visual impairment and legal blindness in patients over 60 years of age.1 2 AMD comprises a wide range of phenotypic manifestations across disease stages. According to internationally established classification systems, AMD is characterised as a chronic-progressive disease with early, intermediate (i) and advanced stages including ‘geographic atrophy’ (GA) and macular neovascularisations.3 Initially, GA lesions typically occur outside the fovea and tend to enlarge over time leading to loss of macular tissue and corresponding retinal sensitivity.4 5 Once the fovea becomes involved, patients experience a significant decline of central visual acuity, along with impairment of quality of life impacting daily activities like reading, car driving or recognising of faces.6 7
GA progression was shown to be associated with perilesional phenotypes in fundus autofluorescence (FAF) imaging which exhibit to some degree a distinct genetic risk profile, especially with regard to the ARMS2 risk allele and the diffuse-trickling FAF pattern.8 In the context of iAMD, other studies have also demonstrated an association of this genetic risk variant with reticular pseudodrusen (RPD), an ocular iAMD biomarker substantially impacting the risk for conversion into advanced disease stages.9–11 However, only little is known about the prognostic relevance of structural iAMD phenotypes across different, that means from early to advanced, disease stages since most studies in early or iAMD exclude data once the study outcome, development of late-stage AMD, is reached.
Besides RPD, typical characteristics for iAMD include large (diameter ≥125 µm) sub-retinal pigment epithelial (RPE) drusen and focal hyperpigmentation.12 Noteworthy, other morphological features may also be present in iAMD, such as refractile deposits.13 14 Previously, we were able to elaborate different structural patterns leading to atrophy by multimodal imaging.15 While they were shown to be of prognostic relevance for GA development, it is still unclear if these local precursors may also impact the further disease course following conversion into late-stage AMD.
The purpose of this study was to characterise GA development and further early atrophic lesion progression. Including both natural history data before development of manifest atrophy as well as change in atrophic lesion size once GA had developed, we analysed the prognostic impact of local precursor lesions on subsequent GA progression.
Methods
Study cohort
A retrospective analysis was performed to identify patients with AMD with GA who had already been assessed at an earlier time when evidence of developing atrophy could be detected in multimodal imaging. All patients had been followed at the Department of Ophthalmology, University of Bonn as part of clinical research, including as part of the prospective, non-interventional monocentre longitudinal natural history studies DSGA (Directional Spread in Geographic Atrophy, NCT02051998, http://clinicaltrials.gov), the MODIAMD (Molecular Diagnostic of Age-related Macular Degeneration, initially funded by the German Ministry of Education and Research (BMBF) FKZ 13N10349) as well as an observational and longitudinal study of subjects with RPD conducted at the Department of Ophthalmology, University of Bonn, Germany. The study protocols complied with the Declaration of Helsinki and were approved by the local ethics committee. The inclusion and exclusion criteria for these studies have been described in detail elsewhere.15–17
Briefly, for inclusion into the DSGA study, patients could exhibit unifocal or multifocal atrophy, but must have had clear ocular media that allowed for good-quality FAF imaging. Exclusion criteria included any signs of macular neovascularisations, history of retinal surgery, laser photocoagulation or other retinal diseases in the study eye. For inclusion in the MODIAMD study, an observational study of patients at high risk for developing late-stage AMD in the study eye, patients >50 years of age and with retinal changes classified as AREDS 3 or 4 (based on AREDS report no. 6), that is, having at least one eye without advanced AMD, were enrolled.18 According to the study protocol, subjects exited the study in case of conversion into late-stage AMD, that is, development of either central atrophy or choroidal neovascularisation. For inclusion in the observational case series of AMD subjects with RPD, patients had to be diagnosed with early or intermediate AMD according to Ferris et al and had to be shown a clearly distinguishable area with RPD of at least two disc areas at the macular centre.3 17
Definition of GA
GA secondary to AMD was defined according to the recently proposed consensus classification system of complete RPE and outer retinal atrophy (cRORA) by the CAM consortium.19 Briefly, atrophy was defined as the presence of cRORA when the following SD-OCT criteria were met: (1) region of hypertransmission of at least 250 µm in diameter, (2) a zone of attenuation or disruption of the RPE of at least 250 µm in diameter, (3) evidence of overlying photoreceptor degeneration including loss of the interdigitation zone, ellipsoid zone and external limiting membrane as well as thinning of the outer nuclear layer (ONL), and (4) absence of scrolled RPE or other signs of RPE tear. Further, a retinal area with a markedly reduced FAF signal and a minimum lesion size of 0.05 mm2 as quantified by RegionFinder software (Heidelberg Engineering, Heidelberg, Germany) had to be present. For description of SD-OCT layers, the nomenclature according to the proposed lexicon for anatomic landmarks by Staurenghi et al was used.20
Imaging protocol
Assessment of multimodal imaging included always the analysis of SD-OCT images and, if available, colour fundus photography (CFP) and simultaneous confocal scanning laser ophthalmoscopy (cSLO) imaging modalities which was performed according to standardised operating procedures as previously described.15 21 After dilatation of pupils with 1.0% tropicamide, CFP with a field of 30°×30° or 45°×45° centred to the fovea were recorded using the Visucam 500 (Carl Zeiss Meditec AG, Jena, Germany). Combined and simultaneous cSLO+SD-OCT imaging (768×768 pixel) was performed (Spectralis HRA+OCT or HRA2; Heidelberg Engineering, Heidelberg, Germany) with acquisition of central 30°×30° near-infrared reflectance (NIR, λ=820 nm, ART (automatic real time) at least 15 frames) and fundus autofluorescence with both blue-light excitation (BAF, exc. λ=488 nm, em. λ=500–800 nm, at least 15 frames) and, if applicable, green-light excitation (GAF, exc. λ=514 nm, em. λ=500–800 nm, at least 15 frames). If indicated, FA (FA, exc. λ=488 nm, em. λ=500–800 nm) was performed with a field of view of 30° using the Spectralis HRA+OCT device (Heidelberg Engineering). SD-OCT imaging in both prospective studies and in the observational case series on AMD subjects with RDR included both horizontal and vertical line scans (each ART mode at least 15 frames and scan angle 30°) and raster scanning (field size at least 20°×15°, centred on the fovea). The raster scans consisted of at least 19 B-scans (distance between neighbouring B-scan approximately 240 µm) and included at least four frames (ART mode).15 17 21
Precursor phenotyping and image grading
All study eyes underwent morphological phenotyping addressing the natural history of disease progression. The local precursor of atrophy was defined as the morphological lesion at spatial correspondence of subsequent GA development. For each included study eye one specific precursor lesion was identified. To ensure robust assessment of precursor phenotypes, four graders (ST, MF, MP, SS-V) defined the individual local precursor separately for each study eye. In the event of disagreement, cases were carefully reviewed again and evaluated by all of the four graders until a consensus was reached. Atrophic lesion size was determined in blue-light FAF images using the RegionFinder software (V.2.6.2.0; Heidelberg Engineering).22 Following manual definition of a seeding point with low FAF intensity within the atrophic lesion, the region-growing algorithm of the software automatically defined the atrophic lesion boundaries based on neighbouring pixel intensities. Once atrophy had developed, image analysis also included classification of the perilesional FAF pattern that had been shown to be of prognostic value for further GA progression.23
Statistical analysis
Statistical analysis was carried out using the SAS software V.9.4. Normally distributed variables were summarised using means and standard deviations (SD). Non-normal continuous variables were summarised using medians and ranges. Categorical variables were analysed using frequency tables. The measured atrophy’s area was square-root transformed (sqrt) to diminish the dependence of progression rates on baseline lesion area (√area (mm)) as described previously.24 The (sqrt) GA progression rate was determined as the difference in GA lesion sizes between two dates divided by the follow-up time between this time. In this study, mean progression rates are presented for a follow-up interval of 1 year (annual progression rates). Linear mixed-effects models with progression rate as outcome were used to analyse longitudinal data considering for the fact that unilateral and bilateral patients were included (‘nested structure’ of the data). A Tukey post hoc test was used to assess the impact of the local precursor on the subsequent GA progression rate. In addition, a linear mixed-effects model with two factors was performed to determine any coexisting effect of patient’s age (phenotype vs age) as well as the status of the fellow eye according to the disease stage (phenotype vs status fellow eye) on GA progression rates. Concerning the latter, fellow eyes were categorised as following: iAMD, GA, CNV or presenting CNV development throughout the observational period. P values smaller than 0.05 were considered significant.
Results
A total of 39 eyes of 34 patients (27 women (79.4%)) with conversion to GA were included in this study with a mean age of 74.4±6.7 (±SD) years at first date of FAF-based GA determination. At this date, mean GA lesion size of the study cohort was 0.84±1.19 (±SD) mm². Overall, this study comprised a median observational period of 7.6 years (range (min–max): 4.2–12.7 years) including a median period of GA assessment of 3.3 years (range (min–max): 0.9–7.7 years). Over this time, the mean annual (sqrt) progression rate of all 39 included study eyes was 0.18±0.06 mm² (mean±SE). With regard to the fellow eyes of the 29 included unilateral study patients, two eyes (6.9%) showed signs of iAMD throughout the observational period and 16 eyes (55.2%) presented GA already at first available image data. Of the remaining 11 eyes, there were nine eyes (31.0%) that initially demonstrated with signs of neovascularisation, while two (6.9%) fellow eyes developed neovascularisation during the review period.
Phenotyping of local precursors
The determination of topographic precursor lesions was based on a multimodal imaging set, comprising at least IR and SD-OCT data. FAF imaging was additionally available at 37 of 39 subjects, and further CFP imaging in 29 of 39 eyes. Based on retrospective analysis, five topographic precursors for subsequent GA development were identified in the 39 included eyes by multimodal imaging. For descriptive characteristics of the local precursors, see table 1. Large, confluent drusen were found to be the most frequent local precursor (n=19; phenotype 1), followed by RPD (n=10; phenotype 2), refractile deposits (n=4; phenotype 3), pigment epithelial detachments (PEDs; n=4; phenotype 4) and vitelliform material (n=2; phenotype 5). A detailed morphological description of confluent drusen, RPD, refractile deposits and a PED collapse in multimodal imaging has been provided in previous reports.15 25
Descriptive analysis of local precursors
Phenotype 1 was primarily assessed in CFP showing large, confluent drusen as well-defined yellow elevated mounds corresponding to RPE detachments in SD-OCT imaging (see figure 1).26 RPD (phenotype 2) were characterised by a group of hyporeflective dots, targets or a ribbon pattern in NIR and FAF topographically corresponding to hyperreflective mounds above the RPE in SD-OCT (figure 2).11 27 For identification of phenotype 2, RPD had to be present in the area of subsequent atrophy development in absence of confluent drusen (see figure 2). Refractile deposits were identified as phenotype 3 (see figure 3) in CFP imaging as glistening, yellow-shiny lesions corresponding to a laminar intense hyperreflectivity at the BM level or to a pyramidal structure in the outer retina.13 28 PED (phenotype 4) was identified as precursor lesion when (in contrast to confluent drusen) its localisation was centred to the fovea and its diameter was at least 1000 µm and its height at least 200 µm as measured in SD-OCT imaging (see figure 4).29 Precursor phenotype 5 was determined as vitelliform material indicated by accumulation of hyperreflective, amorphous material in the subretinal space in SD-OCT associated with cuticular drusen and which was spatially confined to an area of hyperautofluorescence in FAF (see figure 5).30–33 Of the five included study patients with both eyes being included in this analysis, the same local precursor was symmetrically identified for both eyes.

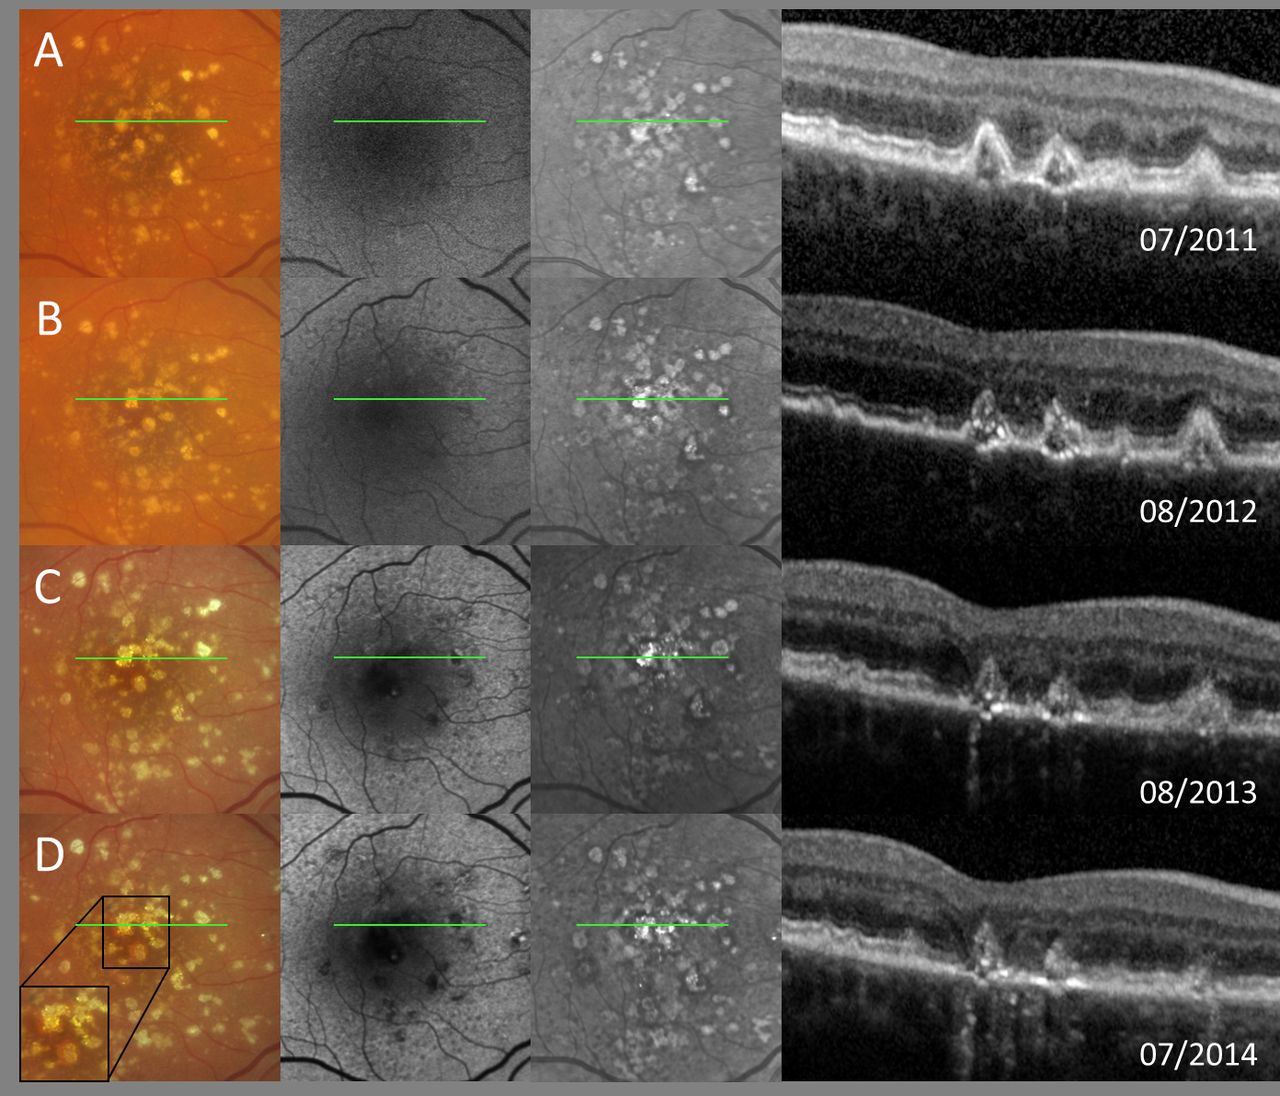
Typical example for the confluent drusen-associated structural precursor lesion (phenotype 1) with annual follow-up visits (A–G) as shown by multimodal imaging (for each row from left to right: colour fundus photography, fundus autofluorescence as well as near-infrared reflectance and spectral-domain optical coherence tomography (SD-OCT). Note the precursor’s extrafoveal localisation. The position of the SD-OCT line scan in the en face images is represented as a green line.

Precursor phenotype 2 is represented in a typical example with follow-up visits over 4 years as shown by multimodal imaging (first picture in first and fourth row: colour fundus photography and in second and third row: near-infrared image; all rows: second and third picture: fundus autofluorescence and spectral-domain optical coherence tomography (SD-OCT)). Note the absence of confluent drusen in area of following atrophy development. The position of the SD-OCT line scan in the en face images is represented as a green line.

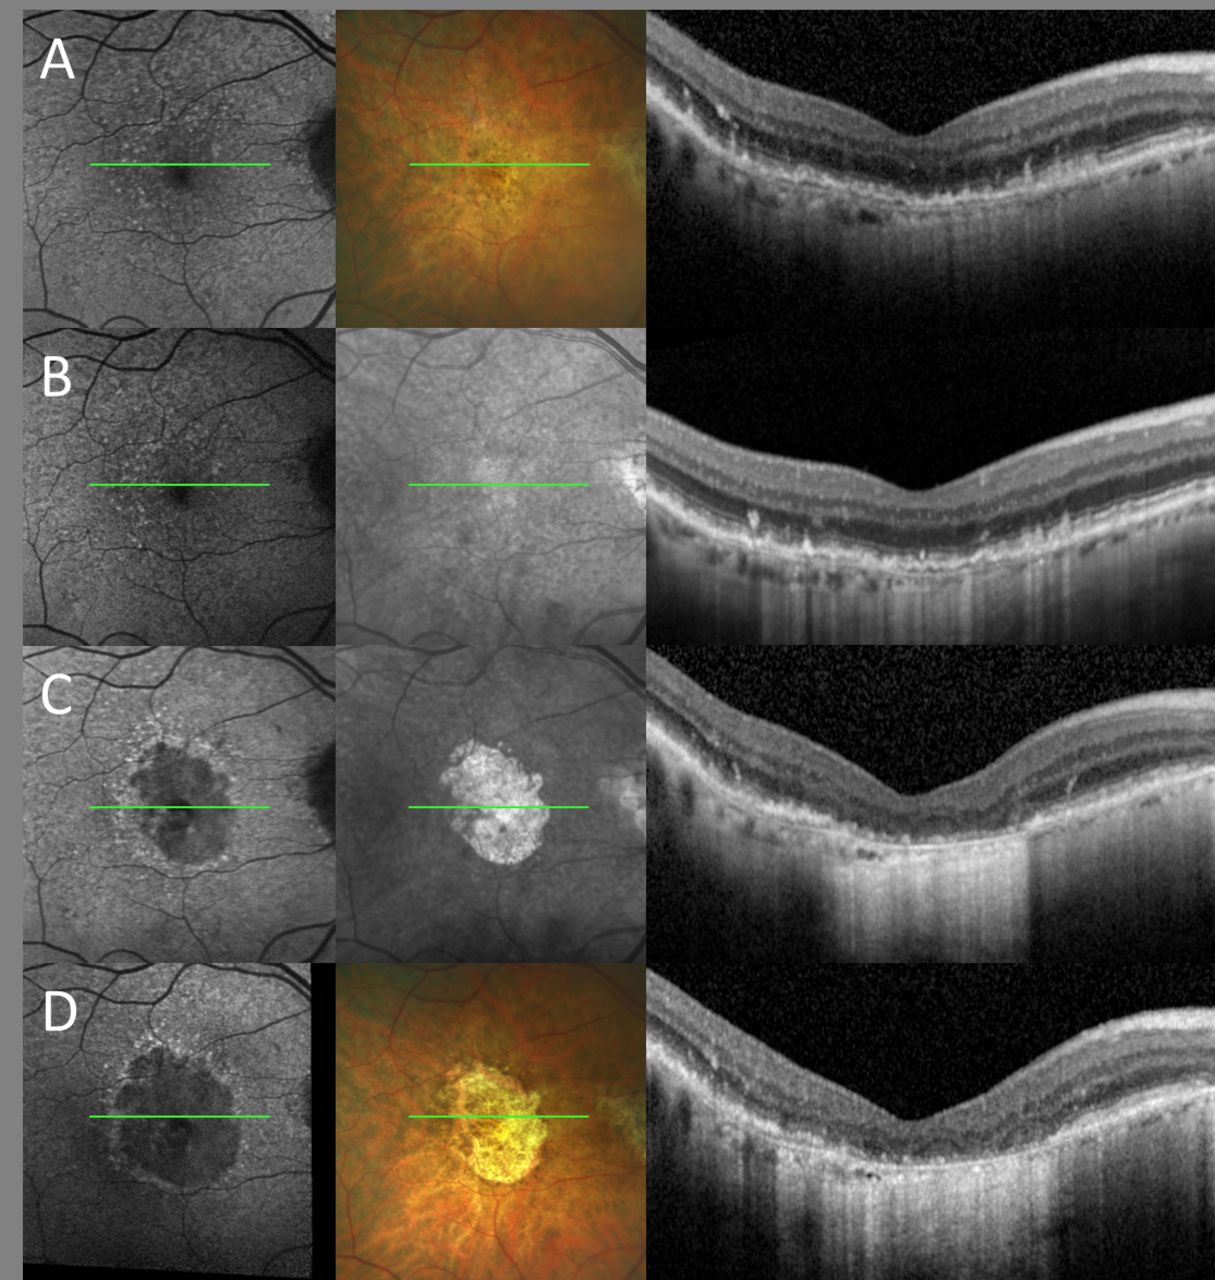
Exemplary case of local precursor phenotype 3 in multimodal imaging (same arrangement of images as in figure 1). Annual follow-up visits (rows A–D) show refractile deposits preceding the development of geographic atrophy. Spectral-domain optical coherence tomography (SD-OCT) imaging (column 4, each row) demonstrates pyramidal structures (‘ghost drusen’) at the level of the retinal pigment epithelium with progressive disruption of the outer retinal bands over time as well as fading of the laminar intense hyperreflectivity associated with the occurrence of traces of choroidal hypertransmission. The position of the SD-OCT line scan in the en face images is represented as a green line.

A follow-up period of 5 years with annual follow-up visits (A–F) highlights precursor phenotype 4 of a central pigment-epithelial detachment (PED) with fulminant collapse. Same arrangement of images as in figure 1. Central hyperpigmentary clumping is seen in colour fundus photography on top of the PED, while fundus autofluorescence shows a corresponding cartwheel-like configuration of increased and decreased signal intensities. Spectral-domain optical coherence tomography (SD-OCT) clearly demonstrates the dome-shaped elevation of the retinal pigment epithelium with hyperreflective foci in inner and outer retinal layers on top of the PED. The position of the SD-OCT line scan in the en face images is represented as a green line. Please note, figure modified to a previous work.15

Typical example of local precursor phenotype 5 over an observational period of 3.5 years showing yellow-shiny vitelliform material in colour fundus photography imaging which topographically corresponds to hyperreflectivity in fundus autofluorescence and near-infrared imaging. Same arrangement of images as in figure 1, except for the third picture in first row: fluorescein angiography (FAG). SD-OCT demonstrates hyperreflective material in the subretinal space. Cuticular drusen are well distinguishable in FAG due to their ‘stars-in-the-sky’ appearance. The position of the SD-OCT line scan in the en face images is represented as a green line.
GA progression rates based on the local precursor
The predominant precursor lesion showed a significant association with the subsequent (sqrt) GA progression rate (p=0.0018) with a mean of 1.14±0.19 (±SE) mm per year in eyes categorised as phenotype 1, see table 2. Compared with phenotype 1, atrophies related to RPD (phenotype 2) or fulminant PED collapse (phenotype 4) were associated with faster (sqrt) progression rates of 1.14±0.33 mm per year and 0.79±0.47 mm per year, respectively. In the case of atrophy development following refractile deposits (phenotype 3) or vitelliform material (phenotype 5), atrophies were associated with a less rapid annual progression by a mean of 0.39±0.47 mm per year for phenotype 3 and 0.21±0.77 mm per year for phenotype 5 compared with phenotype 1. Post hoc analysis (see table 3) revealed that mean (sqrt) progression rate of atrophies deriving from RPD (phenotype 2) differed significantly from those deriving from confluent drusen (phenotype 1, p=0.0035) as well as from refractile deposits (phenotype 3, p=0.0163).
Linear mixed model analysis of mean square-root transformed (sqrt) annual progression rates over the observational period of subsequent atrophies stratified regarding the local precursor
Post hoc analysis of differences in geographic atrophy progression rates between the identified local precursors (phenotypes 1–5) as presented with coefficient estimates, standard error (SE) and corresponding p values
The significant association of the local precursor with progression rates was primarily driven by RPD (phenotype 2) exhibiting the most rapid progression of GA with a mean (sqrt) progression of 2.29±0.52 mm per year, see table 2 (total of coefficient estimates of intercept and phenotype 2). According to the FAF-based classification system for GA by the FAM-study group,23 most rapid progression of atrophies is exhibited in the diffuse-trickling phenotype which itself is in most cases associated with the presence of RPD. The diffuse-trickling pattern was determined in five eyes of four patients (50%) with a phenotype 2 precursor (n=10 eyes of eight patients) after a median observational period of 2.5±2.3 (±SD) years. In contrast, none of the eyes with other precursor lesions developed a diffuse-trickling GA pattern. Mean age at conversion to GA of the four diffuse-trickling patients was 71.5±8.2 (±SD) years and 79.0±12.3 (mean±SD) years for phenotype 2 patients without the diffuse-trickling pattern. The annual (sqrt) progression of the diffuse-trickling GA eyes tended to be a mean of 0.3±0.52 mm per year faster compared with phenotype 2 eyes without the diffuse-trickling FAF pattern (p=0.5567).
Further analysis of additional effects on GA progression
In addition to the spatial association of local precursors, age (p=0.6136) and the status of the fellow eye (p=0.9184) showed no statistical effect on GA progression rates.
Discussion
GA represents a huge unmet medical need. To date, despite a few promising phase II clinical trials, efficacy has not been shown in phase III studies. The underlying pathophysiological mechanisms of AMD progression and GA development with its phenotypic variations are neither yet fully understood nor completely reflected in evidence-based clinical AMD classification systems. Better understanding of the underlying risk profiles, especially of constant factors across follow-up and disease stages, may facilitate genotype–phenotype correlation studies, stratification of patients and may provide the opportunity for earlier intervention.
In this study, we demonstrate that structural features in eyes with iAMD are of prognostic value for the subsequent GA progression (p=0.0018). In particular, post hoc analysis revealed that this association was driven by RPD, demonstrating that iAMD eyes with RPD exhibit a significantly higher enlargement rate of subsequent GA compared with eyes with other iAMD precursors. Although many studies have highlighted the need for a refined phenotypic iAMD characterisation regarding risk assessment for disease conversion, up to now, there had been no studies which determined the intraeye relevance of iAMD phenotyping for subsequent characterisation of GA progression.11 13 34
Previous reports showed that GA progression is complex and depends on several factors including patient’s genotype as well as lesion features.8 23 35–37 Out of those, the perilesional FAF pattern was revealed to be a strong indicator for lesion progression with the most rapid progression in eyes presenting the diffuse-trickling pattern.23 Of note, this pattern is strongly characterised by the presence of RPD; however, in our study, only 50% of the eyes with development of GA spatially confined to RPD (phenotype 2) were considered to develop eventually the diffuse-trickling pattern; at least for the median observational period of 2.5±2.3 (±SD; range 0.9–7.7 (min–max)) years after first GA detection.
In recent years, several studies have focused on RPD differentiating them structurally and functionally from ‘typical’ sub-RPE drusen.19 38 39 In determining the natural history of different iAMD structural high-risk features beyond disease conversion into late-stage AMD, the results of our study might support the assumption of RPD being a distinct entity currently still subsumed in the complex spectrum of AMD.
When interpreting the results of our study, several limitations need to be considered. First, the study is based on a retrospective database analysis. While the retrospective nature of our study has allowed us to assess image data over large observational periods up to 12.7 years, follow-up intervals were not standardised across all included study patients hampering an analysis of more detailed structural alterations, like the recently proposed criteria for incomplete (i) RORA, which are assumedly closer related to GA development in time.40 In addition, it needs to be kept in mind that only a limited number of study eyes were identified as being eligible leading to small (eg, phenotype 5: n=2) and inhomogenous sample sizes across phenotypes 1–5. A profound statistical analysis of coexisting features (‘mixed’ phenotypes) and their interactions within the study eye could therefore not be implemented in this study.
In conclusion, we have provided a phenotypic characterisation of early GA progression in relation to the preceding iAMD high-risk features (‘local precursors’). Here, we were able to demonstrate that local precursors identified in iAMD stages exhibit significant association with the subsequent progression rates of GA. In particular, RPD were highlighted to differ significantly from other iAMD local precursor lesions. A profound characterisation of imaging features being prognostic relevant for AMD progression across disease stages may facilitate mapping of an underlying long-lasting and ‘constant’ risk profile in patients with AMD and warrant being substantiated in larger and prospectively acquired study cohorts.
References
Footnotes
Contributors ST, JN, MP, MSa, MF, FGH, MSc and SS-V have substantially contributed to the conception or design of the work; or the acquisition, analysis or interpretation of data for the work; AND drafted or revised the work critically for important intellectual content; AND approved finally the work to be published; AND agreed to be accountable for all aspects of the work in ensuring that questions related to the accuracy or integrity of any part of the work are appropriately investigated and resolved.
Funding This work was supported by the BONFOR GEROK Program, Faculty of Medicine, University of Bonn, grant numbers O-137.0026 to ST, O-137.0022 and O-137.0025 to MP, by the Deutsche Forschungsgemeinschaft, grant numbers FL658/4-1 and FL658/4-2 to MF, PF 950/1-1 to MP; by the Federal Ministry of Education and Research of Germany (BMBF), scholarship FKZ 13N10349.
Competing interests Non-financial support from Heidelberg Engineering to ST, MP; from CenterVue to ST, MP and MF; from Optos to ST, SS-V and MF. Grant from German Research Foundation (PF 950/1-1 to MP and FL 658/4-1 and Fl658/4-2 to MF); grant from Katairo to SS-V; from Acucela, CenterVue to SS-V and FGH; from Zeiss, Optos, NightStar X and Bioeq/Formycon to FGH. Personal fees from Heidelberg Engineering, Bayer and Novartis to ST; from Bioeq/Formycon, Galimedix to SS-V; from Pixium Vision, Lin Bioscience, Oxurion, Stealth Therapeutics, Kodiak to FGH. Patent pending: US20140303013A1 from MF.
Patient consent for publication Not required.
Provenance and peer review Not commissioned; externally peer reviewed.
Data availability statement All data relevant to the study are included in the article.
Linked Articles
- At a glance