Article Text

Abstract
Background/aims To evaluate the PandAcuity test for visual function testing in a paediatric cohort and to examine its agreement with conventional visual acuity (VA) testing.
Methods PandAcuity scores were determined in 152 children (77 males) aged between 3 and 15 years after VA testing (LEATM-test, E-chart, Landolt-C-rings or numbers). The PandAcuity test consisted of illusions made up from silhouettes of animals ‘hidden’ within zig-zag-patterns of decreasing spatial frequencies. Correlation analyses between PandAcuity score and VA were performed.
Results 150 children completed the test in at least one eye, 148 in both eyes. The PandAcuity test demonstrated good test–retest reliability (intraclass correlation coefficient=0.89) between two runs. VA and PandAcuity score showed a medium to large correlation (Spearman’s ρ=0.52, p<0.0001). 93% of the children’s visual impairment was classified in the same range by both test types. Receiver operating characteristic analysis of predicted visual impairment showed an excellent agreement with the classification based on VA testing (AUC=0.84).
Conclusion The PandAcuity test is rapid, simple and well accepted, rendering it a suitable supplement for the clinical assessment of VA in children. Because of its counterintuitive application (a higher number of correctly identified images means worse VA), it can be used to cross-validate conventional acuity tests to assure children’s compliance.
- child health (paediatrics)
- diagnostic tests/Investigation
- psychophysics
- vision
- visual perception
This is an open access article distributed in accordance with the Creative Commons Attribution Non Commercial (CC BY-NC 4.0) license, which permits others to distribute, remix, adapt, build upon this work non-commercially, and license their derivative works on different terms, provided the original work is properly cited, appropriate credit is given, any changes made indicated, and the use is non-commercial. See: http://creativecommons.org/licenses/by-nc/4.0/.
Statistics from Altmetric.com
Introduction
An important conventional visual function measure is visual acuity (VA) that tests the ability to discriminate details. While in adults reliability is usually good, measuring VA in children is a challenge for physicians and orthoptists, particularly in young or developmentally delayed children, or those with intellectual disabilities, as VA tests are not only dependent on the retinal perception but also compliance, concentration and communication.1–3
A variety of commonly used paediatric VA tests exist, targeting different age groups and comprising preferential looking techniques for toddlers, LEA™ symbols and E-charts in preschool children, and Landolt-C rings or number/letter optotypes for older school children.4 This lack of standardisation and the inequality of different optotype designs complicates further the evaluation of VA in children. On the other hand, knowledge about the visual function of children is particularly desirable to screen for amblyopia, as early detection and treatment are crucial to avoid irreparable visual impairment.5 6 Additionally, currently available VA tests are not able to differentiate between an impaired visual function or simply a lack of cooperation of the child.
The idea behind this study was to develop a novel, quick and easy complementary measure of visual function using the visual illusion of a ‘hidden animal’ embedded in a zig-zag pattern of varying spatial frequency—the PandAcuity test. In a previously published study in healthy adults with best-corrected VA and artificially degraded VA via plus lenses and Bangerter occlusion foils, PandAcuity showed a reverse correlation between the limiting spatial frequency of PandAcuity and VA.7 Contrary to conventional VA testing, the ‘hidden animal’ of the PandAcuity test was better perceived with lower VA. The better recognition of the illusion in uncorrected refractive error results in blurred vision and therefore is believed to act as a low-pass filter for the spatial frequencies, enabling the pulse-width-modulated image of the animal to be decoded.
Its reverse character of better identification of PandAcuity-illusions being correlated with lower VA and the easy and quick nature of the method were the decisive factors for his study. The study aimed to examine PandAcuity’s applicability in a paediatric cohort to provide valuable online supplemental information of visual function in children, such as the cross-validation of compliance in conventional VA procedures.
Supplemental material
Methods
Participants
A total of 152 children (77 males, 75 females) aged from 3 to 15 years (mean±SD: 6.8±2.4 years) were recruited in the Department of Pediatric Ophthalmology and Strabismus of the University Eye Hospital Tuebingen during clinical routine examination by the examining orthoptist. Voluntary participation in the study was offered to the child and the parents and written informed consent was obtained before testing.
PandAcuity eye chart booklets
To easily determine the limiting spatial frequency at which a figure of the panda illusion can still be perceived, two flip-chart-like booklets showing images of the panda illusion with decreasing spatial frequencies per page were used. To create the pages of the booklets, a custom-developed Python script was used to generate black-and-white panda illusion-like images based on different silhouettes of animals (figure 1): panda, rabbit, smiley, and owl) of 6600×6600 px, resulting in a size of 27.9×27.9 cm when printed on DIN A3 using a laser printer at a resolution of 600 dpi. The printed paper sheets were then laminated and bound to a booklet. The series of spatial frequencies of the zig-zag patterns for the single pages were calculated based on a linear regression obtained in a previous study (equation 1)8 for presentation at a 3 m distance for the following visual acuities as also used for Early Treatment Diabetic Retinopathy Study (ETDRS) eye charts9: 0.4, 0.5, 0.6, 0.8, 1.0, 1.25, 1.6 (decimal). The size of the silhouettes of animals was kept constant.
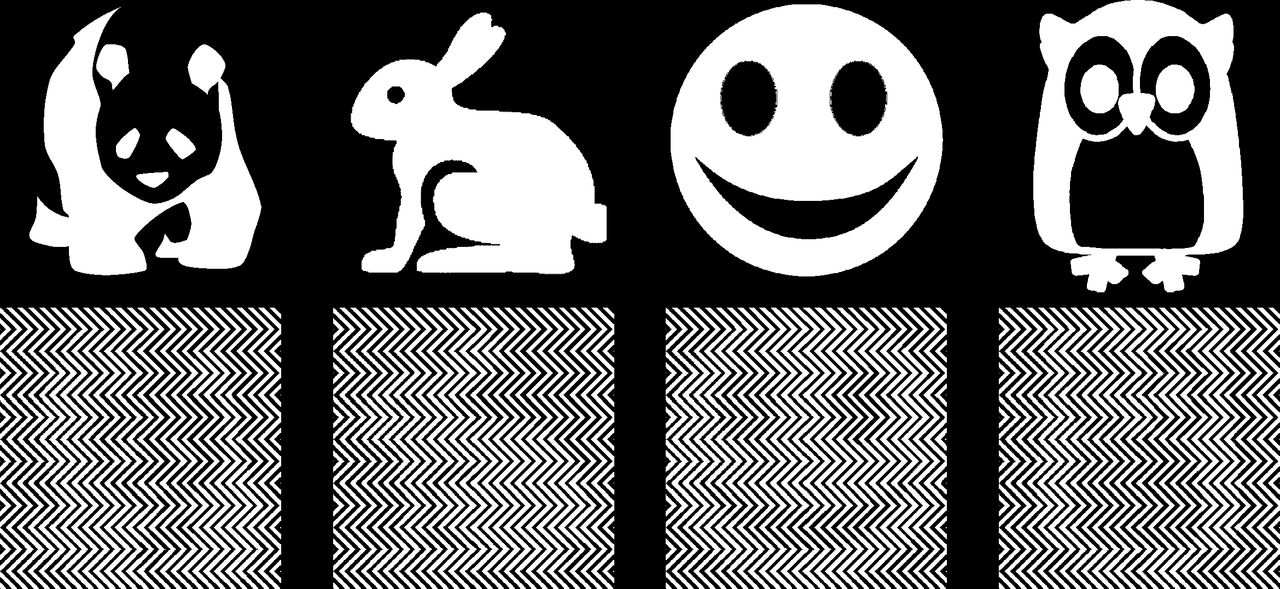
Silhouettes of animals (upper half, from left to right: panda, rabbit, smiley, owl) used to create panda illusion-like test charts (lower half) (panda: public domain, pixabay; rabbit and owl: CC-BY 3.0, Icons8; smiley: own work).
 (1)
(1)
The PandAcuity-illusion uses pulse-width-modulation (PWM) to encode the source images into the zigzag patterns, whereby the carrier frequency can use varying spatial frequencies (figure 1). Decoding of PWM signals is performed using low-pass filtering, which corresponds to blurring in the case of two-dimensional images. Any blurring, like induced by a degradation of the VA, provides a cue for the figure-ground segregation and the perception of the encoded image.7 An in-deep explanation of the correlation between the spatial frequency of the PandAcuity-illusion and the VA is given by Straßer et al.7
To limit the number of pages and simplify the handling of the booklets, the VA range was split into two booklets covering a decimal VA range from 0.4 to 1.25 (low set) and from 0.6 to 1.6 (high set), respectively. Each booklet consisted of 18 pages, with two determinations of the threshold. The order of the depicted animals was randomised and additionally extended by three ‘blanks’ per run as a control, showing an empty zig-zag pattern without the silhouette of an animal.
PandAcuity testing procedure and interpretation
The PandAcuity test was performed subsequently to the other regularly planned ophthalmic examinations, including conventional VA testing using eye charts. For conventional VA testing, three correct optotypes out of five were required per decimal VA step (0.1–0.125 – 0.16–0.2 – 0.25–0.32 – 0.4–0.5 – 0.63–0.8 – 1.0 −1.25–1.6). Optotypes were mainly presented without crowding. After conventional VA determination, PandAcuity tests were performed under constant illumination—always in the same room by the same experienced orthoptist different from those performing conventional VA testing (but not blinded to VA). Both eyes were tested separately. The PandAcuity test required about 2–3 min to complete.
According to the anticipated VA of the child, either the high or the low test set was chosen. The child sat 3 m from the examiner holding the flip-book. The test was performed either with their glasses or without correction. During the test, the flip-book was leafed through, starting from the high spatial frequencies, by letting the single pages fall down (figure 2). This avoids possible motion blur which would help to perceive the illusion.7 The spatial frequencies (printed on the backside) of the illusions that could not be perceived by the child, were noted.

Setting of the PandAcuity test in the examination room with standardised illumination conditions. The child sits relaxed 3 metres from the examiner with one eye covered and reports the name of the animal it perceives. The pages of the flip-book are leafed through and the spatial frequencies (printed on the backside) of the illusions that could not be perceived by the child, were noted.
The PandAcuity score was determined as the lowest spatial frequency at which the illusion was perceived: If the illusion was perceived at a certain spatial frequency, the VA was considered to be at most the VA corresponding to the PandAcuity score. In case no animal could be perceived by the child at a certain spatial frequency, the VA was considered better than the corresponding PandAcuity score. If no animal could be perceived even at the highest spatial frequencies, the VA was considered better than the upper limit of the used test set. To differentiate between children with higher VA than tested and those with too low VA to resolve the stripe pattern at all—in both cases no animal would be reported—examination distance was increased and room illumination darkened at the end of the examination. Children with higher VA than tested before should then be able to perceive the illusion.
Statistical analysis
Children with nystagmus (n=9) were excluded from the main analysis and analysed separately, due to a likely different perception of the PandAcuity illusion caused by motion blur from the rapid eye movements. Moreover, 3–5 years old children and developmentally delayed children or those with intellectual disabilities were additionally analysed separately.
The test–retest reliability of the PandAcuity test was evaluated using a two-way mixed intraclass correlation coefficient (ICC) with single measure and absolute values between the first and second runs of the PandAcuity test set.10
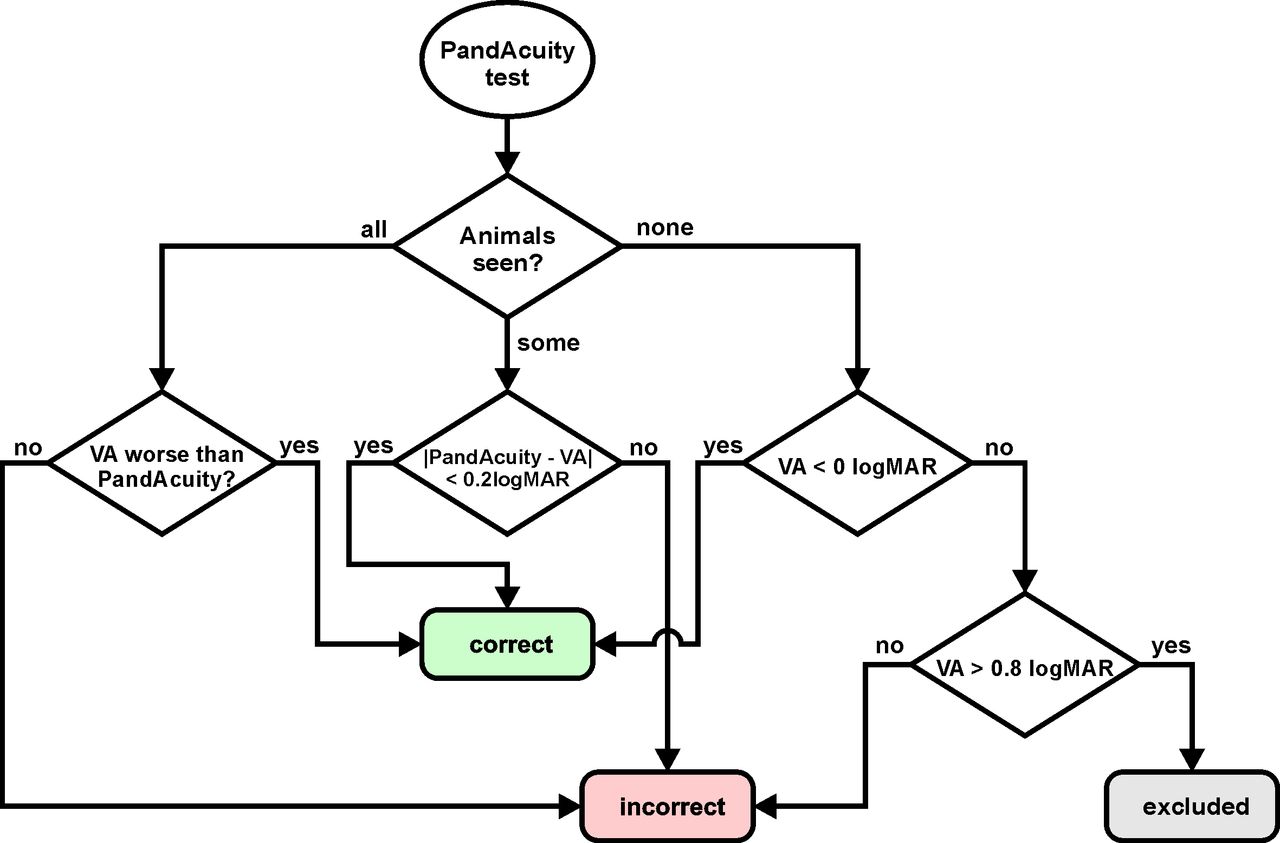
The limited VA range covered by PandAcuity test (low set: 0.4–1.25; high set: 0.6–1.6; both decimal VA), caused by physical limitations (printing resolution, dimensions of the flip-book), prevent a direct comparison between VA obtained using conventional eye charts and the PandAcuity score: being unable to perceive any of the animals may either be caused by a VA higher than the limit of the used test set or by a VA too low to resolve the test pattern at all. Similarly, perceiving all of the animals is likely caused by a VA lower than the lower range of the test set; therefore, the exact PandAcuity score cannot be determined. To deal with this limitation, the results were classified into correct or incorrect as depicted in the flow chart in figure 3.

Flow chart describing the classification of the PandAcuity score into correct or incorrect based on the number of animals perceived. Seeing all of the animals is likely caused by a very low visual acuity, seeing none of the animals is caused by either a very high visual acuity (VA) or an acuity too low to resolve the test patterns at all.
If a VA lay within the tested range of the flip-charts, the difference between the VA obtained from conventional eye testing and estimated from the PandAcuity score was compared using a Wilcoxon signed-ranks test and the limits of agreement were determined and evaluated for clinical relevance using Bland-Altman’s method.11 Furthermore, the correlation coefficient for all results was calculated.
Next, the children were categorised into the five classes of visual impairment described by the visual standards report of the 29th congress of the International Council of Ophthalmology12 (online supplemental file 1) according to their conventionally determined VA and their PandAcuity score and compared.
Binary logistic regression analysis for predicting the visual impairment (minimal visual impairment or worse, decimal VA <0.8), with the averaged PandAcuity score of the first and the second runs as the predictor variables, was conducted and the validity and accuracy of the classification were evaluated using a receiver operating characteristic (ROC) analysis.13
All statistical analyses were performed using SAS JMP V.15.1 (SAS Institute). The ICC was calculated using IBM SPSS Statistics V.26.0 (IBM).
Results
Of the 152 children participating in the study, the VA was assessed in 14 (3–7 years) using the LEATM-test, in 91 (4–10 years) using the E-chart, in 23 (4–11 years) using Landolt C-rings, and in 24 (6–15 years) using number (23) or letter (1) optotypes depending on the child’s age and the choice of the orthoptist. A total of 148 children completed the PandAcuity test with both eyes, 150 at least in one eye. In four young children, PandAcuity was not finished because of a lack of motivation; in two of them (both 4 years), PandAcuity in neither eye was obtained, in the other two (both 3 years) at least one eye could be successfully tested. The results of one subject (Pan133) were excluded from further analysis because of an accidentally too dark room illumination. Another nine eyes of six subjects were excluded due to a too low VA, not allowing the children to resolve the stripes of the PandAcuity-charts at all (see the Methods section). Nine children had nystagmus and were excluded and analysed separately (see the Subanalyses section; Nystagmus).
Consequently, the main analyses comprised 269 eyes of 137 subjects. The distribution of the age of the children included in the study and of the VA of their respective eyes are shown in online supplemental file 2.
Test–retest reliability of the PandAcuity test
The test–retest reliability between the first and the second run of the test set using all data (n=269) was 0.90 (95% CI 0.87 to 0.92), which is considered as good reliability according to Koo and Li.10 Excluding eyes with a PandAcuity score equal or larger than 1.6 to avoid possible ceiling effects artificially increasing the test–retest reliability (n=146), results still in a good reliability with an ICC of 0.80 (95% CI 0.74 to 0.85).
Correlation of VA and PandAcuity score
Figure 4 shows the agreement between the VA determined using conventional eye charts and the PandAcuity for the 137 children (n=269). A total of 200 results of the first threshold determination and 211 of the second were classified as correct (see the Methods section). The VA and the averaged PandAcuity score of first and second runs showed a medium to large correlation14 (n=269, Spearman’s ρ=0.5282, p<0.0001) for all data. With eyes with visual acuities equal or better 1.0 decimal (≤0.0 logarithm of the minimum angle of resolution, logMAR) excluded, the correlation is medium to large (n=101, Spearman’s ρ=0.5268, p<0.0001).

Visual acuity (VA) (decimal) determined using conventional eye charts plotted versus PandAcuity for the first (left) and the second run (right) of both eyes of all participants. Colours indicate if the difference between VA and PandAcuity is less or equal (green) or larger (red) than 0.2 logMAR, whereby these limits are indicated by the two fan-shaped lines. Points at the bisecting line indicate perfect agreement. The size of the symbols represents the number of eyes at a certain data point. The two test sets are indicated by grey shaded areas, ranging from 0.4 to 1.25 (decimal; fine dotted lines) and 0.6 to 1.6 (decimal; dashed lines) VA, respectively. Values are either exact (circles) or, due to the VA range limits of the test sets, considered as a VA of at least (squares) or at most (diamonds) the plotted data points. Data points outside the 0.2 logMAR range but classified as less or equal were considered as correct (green diamonds).
A Wilcoxon signed-ranks test of results of the PandAcuity test not at the upper or lower limit of the test range (78 children, 116 eyes), revealed no statistically significant difference (Z=150, p=0.6811) between the average of the first and second threshold determination of the PandAcuity score (median=0.13 logMAR) and the VA (median=0.00 logMAR). The mean difference between the averaged PandAcuity score and the VA was 0.04 logMAR with a 95% CI of (−0.01 to 0.09) logMAR. The limits of agreement were (−0.46 to 0.54) logMAR.
Prediction of visual impairment using the PandAcuity test
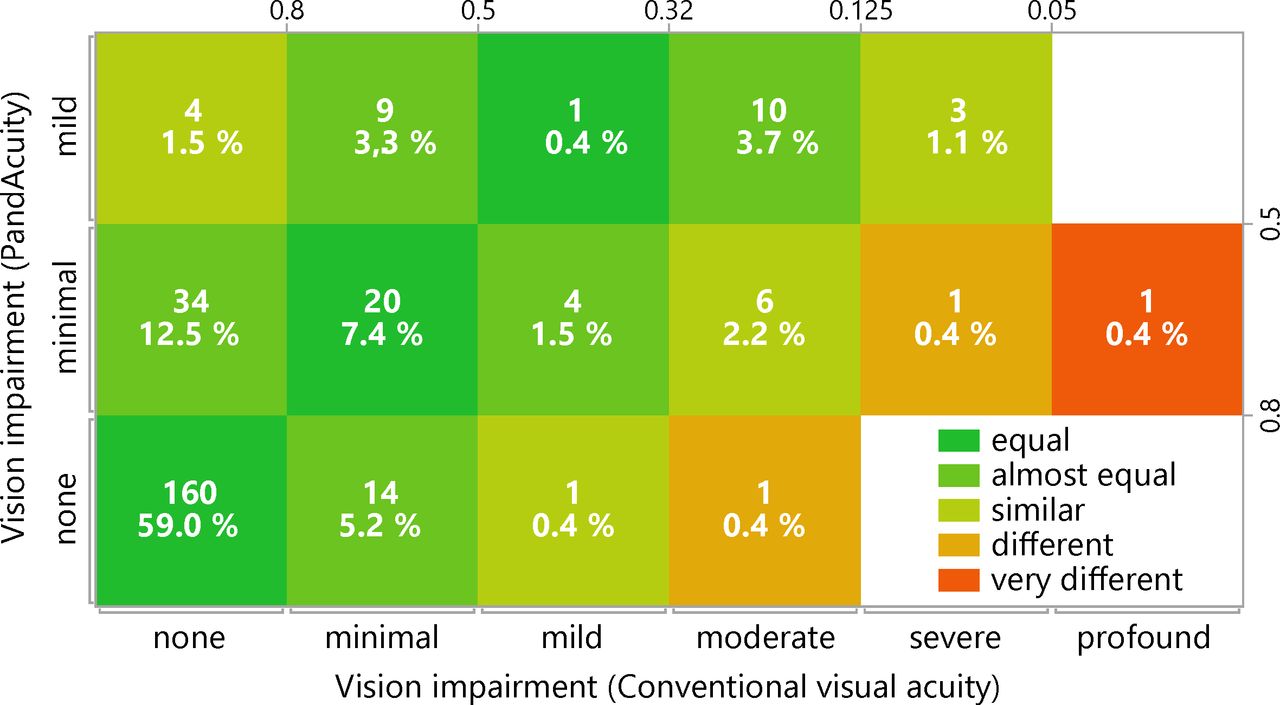
The visual impairment of 93% of the eyes was classified to be in the same range of vision (equal, almost equal) as that found by conventional VA testing and the averaged values of the first and the second measurement of the PandAcuity. The VA of the other eyes was either slightly overestimated (similar, 4%) or underestimated (similar, 2%) by the PandAcuity test. Stronger discrepancies between VA and PandAcuity (different, very different) were found only in about 1% of the eyes (figure 5).
Agreement between the classifications of the vision impairment based on visual acuity estimation using conventional eye charts (abscissa) and the PandAcuity test (first and second runs averaged, ordinate). The values represent the absolute numbers and percentages of the eyes. No visual impairments worse than ‘mild’ were detectable by PandAcuity with the current flip charts.
The results of the binary logistic regression indicated that there was a significant association between the PandAcuity score and a minimal or worse visual impairment with VA less than 0.8 (decimal) (χ²(1)=94.19, p<0.0001).
Based on the binary logistic regression, the sensitivity of the PandAcuity test is 0.68 (95% CI 0.55 to 0.78), the specificity 0.89 (95% CI 0.83 to 0.92). Online supplemental file 3 lists the confusion matrix of the prediction of the binary logistic regression.
The ROC analysis of the prediction of the visual impairment showed an excellent agreement (area under the ROC curve, AUC=0.84)15 with the classification based on conventional VA testing.
Subanalyses
Nystagmus
Nine children (16 eyes, in 2 children only binocular VA was applicable) were diagnosed with nystagmus and included in the analysis. In eight children, the PandAcuity score determined according to the workflow in figure 2 corresponded with the VA and was considered correct. The prediction failed only in one child (Pan13), however, the visual impairment based on the PandAcuity score agreed with the one based on the VA. In two eyes of two children (Pan30, Pan126) a strong discrepancy in the classification of the visual impairment was found, which is caused by the limited range of the VA tested. Online supplemental file 4 lists the results of all children with nystagmus.
Early childhood (3–5 years)
Forty-one children (81 eyes) were aged between 3 and 5 years. In two children (Pan46 and Pan95) the PandAcuity test could not be performed successfully due to lack of compliance. In 36 children (64 eyes), the prediction of the VA based on the PandAcuity score was correct according to the workflow shown in figure 2. The agreement between the visual impairment predicted from the PandAcuity score and the VA was equal in 33 (61 eyes), almost equal in 11 (18 eyes) and similar in 2 (2 eyes) children.
In three (five eyes) of five 3 years old, the predicted VA was incorrect; the agreement of the visual impairment was equal in two (two eyes) and almost equal in four (seven eyes) children.
Developmentally delayed children and those with intellectual disabilities
A total of seven developmentally delayed children and those with intellectual disabilities were analysed as a separate subgroup and revealed invariably correct predictions and mainly equal or almost equal categorisations of visual impairment (online supplemental file 5).
Discussion
In this study, we present the applicability of the PandAcuity test, based on the Panda illusion image, as a novel supplement in the assessment of visual function in a paediatric cohort.
Assessing visual function in children is challenging, particularly in younger ages1 2 and developmentally delayed children or those with intellectual disabilities,3 in which a possible visual impairment might even be missed.16 But even healthy children are sometimes hard to motivate to perform VA testing, and physicians and orthoptists face the dilemma of interpreting doubtful results of conventional VA tests without evidence of organic morphologic damage. Particularly in such cases of doubtful results in conventional VA tests, PandAcuity is a valuable method to cross-validate the results and to assure the child’s compliance or to further indicate malingering as an additional puzzle piece of simulation tests. Our study comprises a large cohort of 152 children aged 3–15 years and our results proved a good test–retest reliability of the PandAcuity test. A medium to large correlation between conventional VA and the averaged PandAcuity was found. In the prediction of visual impairment using the PandAcuity test, equal or almost equal classifications between PandAcuity and conventional VA were observed in 93% of the eyes. Stronger discrepancies were only present in around 1% of cases. These results are consistent with an excellent agreement in the ROC analysis (AUC=0.84). Furthermore, even in case of large discrepancies in the agreement of visual impairment from VA and PandAcuity scores (figure 5 and online supplemental files 4 and 5), the prediction can still be correct, since PandAcuity score estimation was limited by the covered test range (<0.4 or <0.6 depending on the test set). The sensitivity of 68% and the specificity of 89% of the PandAcuity test indicate that despite that about one of three children with suspected vision impairment according to conventional VA testing is not detected using the PandAcuity test, almost all children with no vision impairment are correctly identified and could be excluded from further vision testing. Compared with results of a study comparing the sensitivity of 11 preschool vision screening tests in 2588 children aged from 3 to 5 years, assuming an overall specificity of 94%, which is similar to 89% of the PandAcuity test, the sensitivity of the PandAcuity for the detection of a reduced VA is on par or even better than those reported by Ying et al.17
Due to its easy application, almost all children performed the PandAcuity test successfully. Even the majority of the youngest 3-year-old children showed good compliance for the PandAcuity with reliable responses—also in cases where conventional VA measurement was difficult. Two children (Pan96 and Pan97) exemplarily revealed VA of 0.5–0.6 in conventional VA testing with LEATM charts, which might be considered as age-related normal, particularly as clinical examination revealed morphologically completely unremarkable findings and no hint of any visual disturbance. Both reported no perception of the PandAcuity illusions corresponding to a PandAcuity of ≥1.6 for the predefined distance and room illumination. However, after increasing the distance and darkening the room—corresponding to an intentional worsening of VA—both children reported correct illusion perception. Consequently, good compliance for PandAcuity performance was assured and normal visual function could be assumed from both conventional VA and PandAcuity.
For some other 3 and 4 years old, the examiner’s impression was that the test was probably too difficult, with the child starting to ‘see’ random shapes while performing the PandAcuity test, a fact likely attributed to the child’ immaturity.
In the challenging subgroup of developmentally delayed children or those with intellectual disabilities, the visual impairment was categorised as mostly equal or almost equal to the PandAcuity.
Thus, PandAcuity is a suitable method for a rough estimation of VA and the range of visual impairment. The authors explicitly do not propose that PandAcuity should replace conventional VA tests, but rather that it should serve as an important and suitable supplement leveraging the counterintuitive reversal character for cross-validation in the assessment of visual function. In this respect, it is a completely new, quick and easy, diagnostic tool, with no comparable alternatives reported in the literature to the best of our knowledge. Cases of non-accordance between PandAcuity and conventional VA might depend on several factors, either of the two tests being potentially the one with the wrong results.
For PandAcuity performance, we consider the following limitations or confounders: If nystagmus is present, a slightly different perception of the PandAcuity illusion caused by motion blur from the rapid eye movements is to be assumed. Therefore, all children with nystagmus were analysed separately. Although the subgroup analysis revealed relatively good agreement between the two measurements, there was a clear trend that children with nystagmus perceived the illusions better than that projected from their VA. Consequently, PandAcuity’s applicability in nystagmus remains currently unsure.
Furthermore, one child reported during PandAcuity performance that if he was watching abnormally, he could better perceive the illusions; thus a false low PandAcuity might result out of the intentional defocusing blur. However, this was only reported in one child without seeming to be a commonly relevant limiting factor.
Although only being observed in one child, we cannot completely rule out that the illusion image of the smiley might be slightly better perceived than the other animal illusions due to the nature of unconsciously higher familiarity with faces.
With the current test sets, the application was limited to a VA of around 0.2. For lower VAs, the zig-zag pattern was not perceivable at all, and the PandAcuity test not applicable for all children with visual impairment to VA<0.2 due to organic defects. Therefore, for future broader applicability, new test sets require either a bigger zig-zag pattern or a reduction of test distance with adjusted illusion parameters for serving as test charts for lower visual acuities. Another limitation is that the examiner was not blinded to the results of conventional VA.
In conclusion, PandAcuity proved to be clinically applicable in children from 4 years of age and even in some 3 years old, as well as in developmentally delayed children or those with intellectual disabilities, and presents a novel supplementary measure of visual function. The PandAcuity test is rapid, simple and well accepted, making it a suitable addition to conventional acuity testing for clinical assessment of VA in children. Because better identification of PandAcuity pictures is correlated with lower VA, the method can more easily maintain the child’s attention and is thus particularly suited to cross-validate doubtful conventional VA test results in children.
Ethics statements
Patient consent for publication
Ethics approval
The study followed the tenets of the Declaration of Helsinki and was approved by the Institutional Review Board of the Medical Faculty of the University of Tuebingen (081/2018BO2).
Acknowledgments
We thank PD Dr Anne Kurtenbach for valuable discussions and for proofreading the manuscript.
References
Supplementary materials
Supplementary Data
This web only file has been produced by the BMJ Publishing Group from an electronic file supplied by the author(s) and has not been edited for content.
Supplementary Data
This web only file has been produced by the BMJ Publishing Group from an electronic file supplied by the author(s) and has not been edited for content.
Supplementary Data
This web only file has been produced by the BMJ Publishing Group from an electronic file supplied by the author(s) and has not been edited for content.
Footnotes
Contributors TS, CK and BS: conception and design of the work; BS: acquisition of the data; TS and CK: analysis of the data; TS, CK, DB and EZ: interpretation of the work; TS, CK, DB and EZ: revising the work. TS is guarantor.
Funding The authors have not declared a specific grant for this research from any funding agency in the public, commercial or not-for-profit sectors.
Competing interests EZ and TS filled a patent for using the panda illusion for the refraction of the eye.
Provenance and peer review Not commissioned; externally peer reviewed.
Supplemental material This content has been supplied by the author(s). It has not been vetted by BMJ Publishing Group Limited (BMJ) and may not have been peer-reviewed. Any opinions or recommendations discussed are solely those of the author(s) and are not endorsed by BMJ. BMJ disclaims all liability and responsibility arising from any reliance placed on the content. Where the content includes any translated material, BMJ does not warrant the accuracy and reliability of the translations (including but not limited to local regulations, clinical guidelines, terminology, drug names and drug dosages), and is not responsible for any error and/or omissions arising from translation and adaptation or otherwise.
Linked Articles
- Highlights from this issue