Article Text

Abstract
Aims To apply cumulative sum (CUSUM) in monitoring performance of surgeons in cataract surgery and to evaluate the response of performance to intervention.
Method A CUSUM analysis was applied to 80 phacoemulsification performed by three ophthalmic trainees and one consultant, for the occurrence of posterior capsular rupture and postoperative refracted vision of worse than 6/12 among patients without pre-existing ocular comorbidity. The CUSUM score of each consecutive procedure performed by an individual surgeon was calculated and charted on CUSUM chart. When trainees' CUSUM charts showed an unacceptable level of performance, their supervisors would give feedback and impose closer monitoring of subsequent surgeries.
Results CUSUM charts of the trainees demonstrated an initial upward followed by flattening trend. This reflects learning curves in their process of acquiring competency in phacoemulsification. In contrast, the consultant showed a flat curve indicating an ongoing maintenance of competence.
Conclusion The CUSUM analysis is able to monitor and promptly detect adverse events and trends of unacceptable outcomes in cataract surgery. This objective and dynamic monitoring makes CUSUM a useful audit tool for individual surgeons, but more so for busy consultants who need to supervise trainees.
- Cataract surgery
- CUSUM
- monitoring
- statistical process control
- lens and zonules
- treatment surgery
Statistics from Altmetric.com
Introduction
Cataract surgery is the most common procedure performed in ophthalmology and is one of the first procedures, ophthalmic trainees learn and master. Since the outcome of cataract surgery depends on a surgeon's skill, monitoring surgical competency, especially that of trainees, is essential to ensure patient safety and standard of care.
Conventional methods used in appraising trainees' surgical performances are log book and progress interview. These methods are subjective, based mainly on the number of procedures performed rather than surgical outcomes, and are arbitrary without explicit reference to predetermined standards. Thus, a more robust and objective method is desirable.
The cumulative sum (CUSUM) analysis is an objective assessment on the outcome of consecutive performances with reference to an agreed standard. It has long been used in manufacturing industries for quality control.1 CUSUM has increasingly been applied in clinical performances in surgical procedures,2–7 anaesthetic procedures,8 9 interventional nephrology10 and diagnostic procedures.11–14 Besides competency monitoring, it has also been applied to assess the effectiveness of wound dressing.15
To date, the CUSUM analysis has not been applied in ophthalmology. This study presents the usefulness of CUSUM as a novel performance appraisal tool in phacoemulsification with reference to occurrence of posterior capsular rupture (PCR) and poor postoperative refracted vision.
Material and method
The CUSUM analysis is a statistical process control tool. The tool scores performance outcome as a quantitative measurement. CUSUM scores of consecutive performance of an individual operator are displayed as a control or line chart, with the x-axis representing the consecutive series of procedures and the y-axis representing the CUSUM score.
Mathematically, the CUSUM score is determined using the formula:
At the start, CUSUM C0=0. At the nth procedure, Xn is the outcome measure for the nth procedure. Performance with an acceptable standard has a negative score, and the chart is either flat or slopes downwards. Performance with an unacceptable standard has a positive score, and the CUSUM chart slopes upwards. When consecutive procedures performed by the same operator are at an unacceptable standard, the chart will continue to slope upward until it crosses a line drawn across the chart called the decision interval (h). When this occurs, the CUSUM chart is said to signal an unsatisfactory performance, thus providing early warning for corrective actions to prevent subsequent patients being harmed by adverse outcome resulting from deteriorating or substandard performance.
After crossing the decision interval, the CUSUM chart is restarted. Restart should theoretically be at 0 or the x-axis. However, in order to obtain a chart which looks like a learning curve, it restarts at a decision interval, which now acts as a new x-axis.
The decision interval or h is determined by specifying the in-control (IC) and out-of control (OC) average run length (ARL). IC-ARL is the average number of consecutive surgeries required for a CUSUM chart to cross a decision interval or signal during the period when the operator is performing at an acceptable level. This is analogous to Type I (α error) or false-positive error in hypothesis testing. On the other hand, OC-ARL is the average number of procedures performed before the CUSUM chart signals, during the period when an individual is performing at an unacceptable level. It is a measure of sensitivity and is analogous to power (1-Type II (β)) or false-negative error in hypothesis testing.
A design with short IC-ARL (large type I or α error) is prone to false alarm, while a design with short OC-ARL (high power) will quickly detect poor performance. Ideally, CUSUM monitoring requires long IC- ARL (small type I error) and short OC-ARL (high power) before the chart signals an actual deterioration in performance. Unfortunately, this ideal could not be reached, as a desirably long IC-ARL (small type I error) will lead to unacceptably long OC-ARL (low power). On the other hand, the desired short OC-ARL (high power) will lead to more frequent false alarms (large type I error). Hence, a trade-off is made between them. The amount of acceptable trade-off depends on the nature of the procedure and its adverse event to be monitored, that is, life-threatening complications would require a highly sensitive chart to detect poor performance at the expense of more frequent false alarms.
Figure 1 shows the standard CUSUM charts for a consultant and a trainee. A consultant is expected to have a flat CUSUM chart indicating ongoing maintenance of competence. On the other hand, a trainee, in the process of acquiring a new skill, is expected to have an initial upward followed by a flattening chart, the so-called learning curve. The degree of the slope is a measure of progress, that is, a greater slope means slower progress. When the chart flattens, it indicates that the trainee has mastered the new skill.
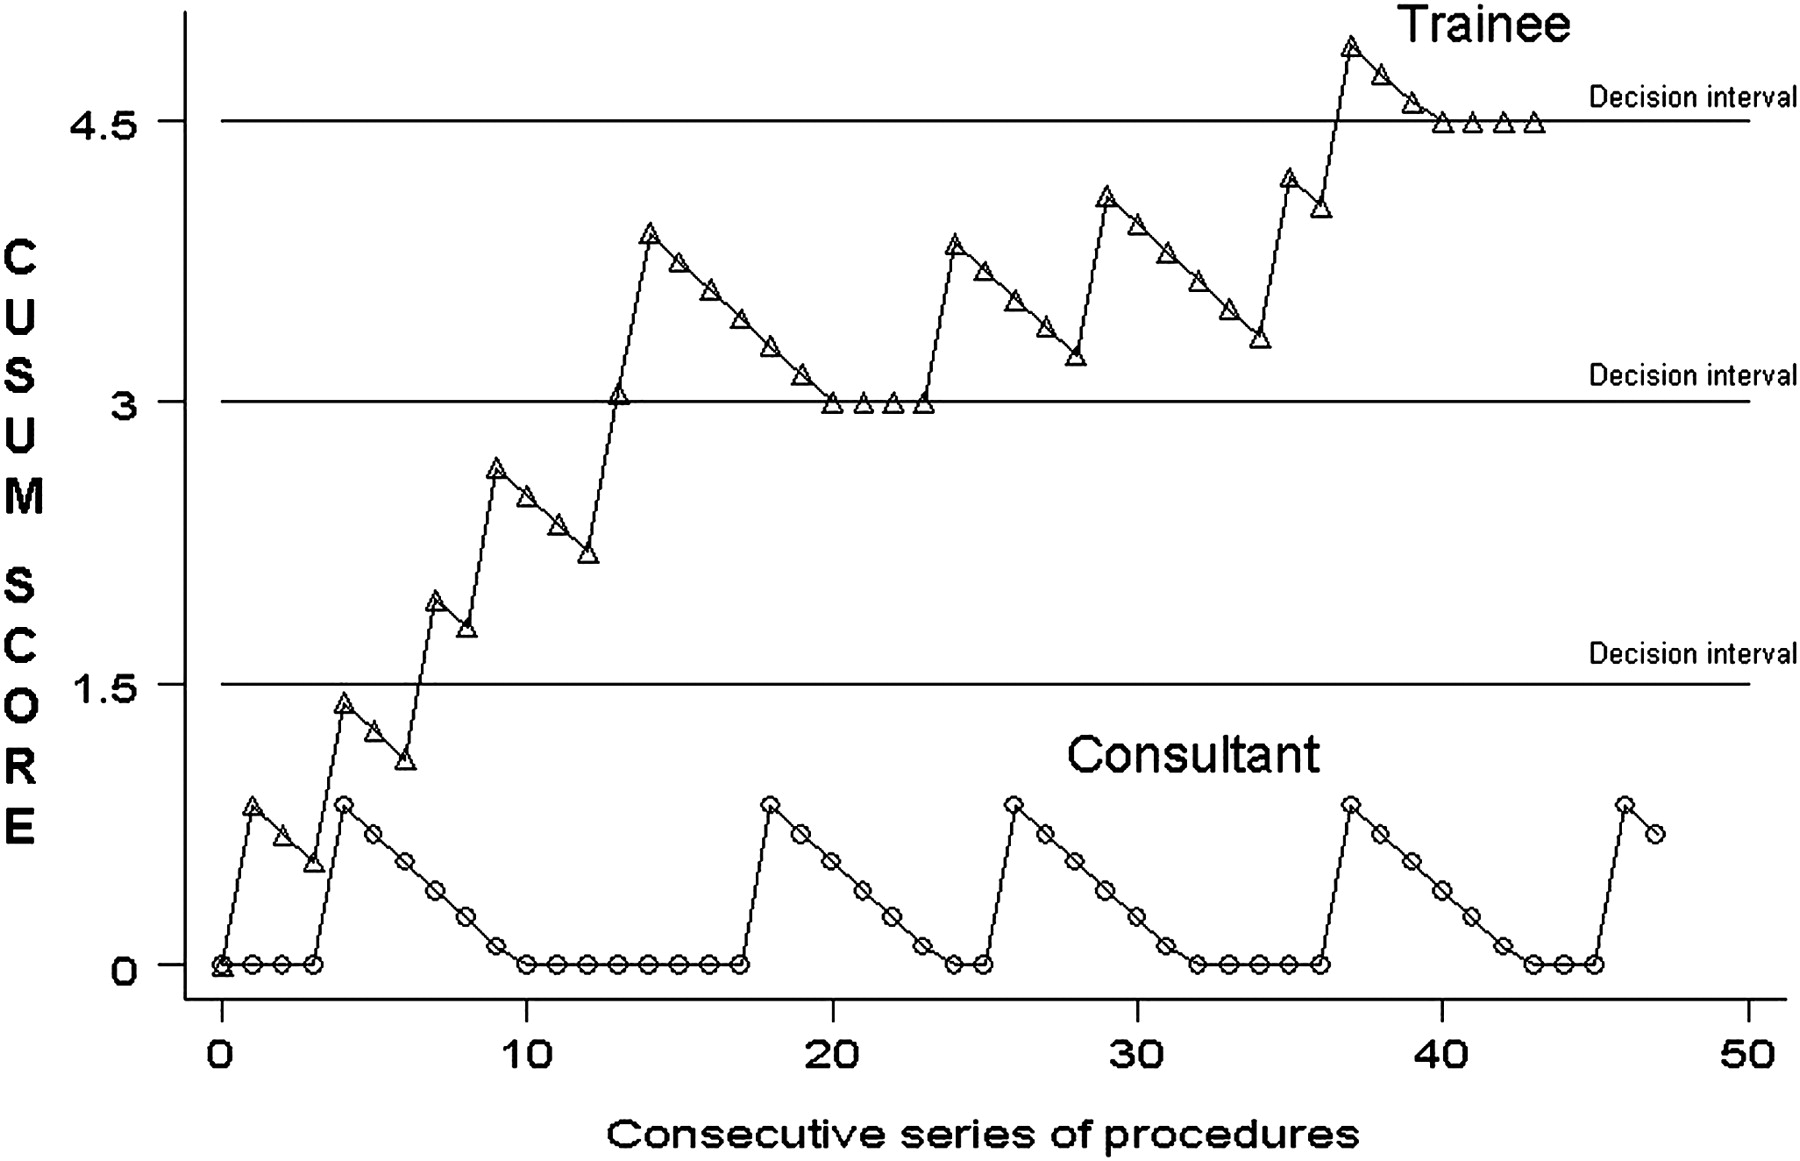
Standard reference cumulative sum (CUSUM) chart showing performances by a trainee and a consultant.
In this study, the CUSUM analysis was applied to four cataract surgeons, that is, a senior consultant and three trainees in their performance of 20 cases of phacoemulsification with intraocular lens implantation. Trainee 1 was in his final year of postgraduate training, trainee 2 was in the second year of postgraduate training, and trainee 3 had completed his postgraduate training. The adverse outcomes being monitored were the occurrence of PCR during surgery and postoperative refracted vision. Successful cataract surgery was defined as absent of PCR or refracted visual acuity of 6/12 or better by 12 weeks postoperatively. The prespecified standard of performance was derived from aggregated data of 12 798 cataract surgeries reported to the National Cataract Surgery Registry (NCSR).16 The acceptable rate for PCR was less than 5%, and the unacceptable rate was more than 10% of surgery performed. For visual outcome worse than 6/12, the acceptable rate was less than 10%, and the unacceptable rate was more than 20% of patients operated. Patients who had pre-existing ocular comorbidity were excluded from CUSUM analysis. Table 1 summarises the specifications and parameter values used in CUSUM charting for monitoring cataract surgery performance. The trainees' CUSUM charts were monitored closely. When their CUSUM charts crossed the decision interval, they were given feedback, and closer monitoring of subsequent cases was initiated.
Cumulative sum charting design for monitoring cataract surgery performance
Results
The CUSUM charts for PCR for the four surgeons are shown in figure 2. Trainee 1 had PCR in his first case, and his chart crossed the first decision interval. The subsequent two cases were uneventful, and the chart sloped downwards. However, a second PCR occurred in case no 4. As this was the second occurrence of PCR, and it occurred soon after the first, the chart crossed two decision intervals. For the next 16 cases, trainee 1 did not have any PCR, indicating that his performance had achieved an acceptable standard.

Cumulative sum (CUSUM) chart for four surgeons based on the occurrence of posterior capsular rupture.
Trainee 2, the junior trainee, had three cases of PCR. The first two cases were associated with extended continuous curvilinear capsulorrhexis, and the last case occurred during irrigation and aspiration. The PCR occurred at a gap of a few successful surgeries. His chart showed an upward followed by downward slope and crossed three decision intervals. A review of his cases with PCR did not indicate that they are difficult cases. Trainee 2 had not overcome his learning curve and needed continuous close monitoring.
The chart for trainee 3 crossed the decision interval at case no 2 and crossed two decision intervals at case no 5. After the fifth case, there was no more PCR, and his chart stayed flat.
The consultant had no PCR until the last case. His chart was flat initially and crossed one decision interval at case no 20. The PCR occurred during irrigation and aspiration.
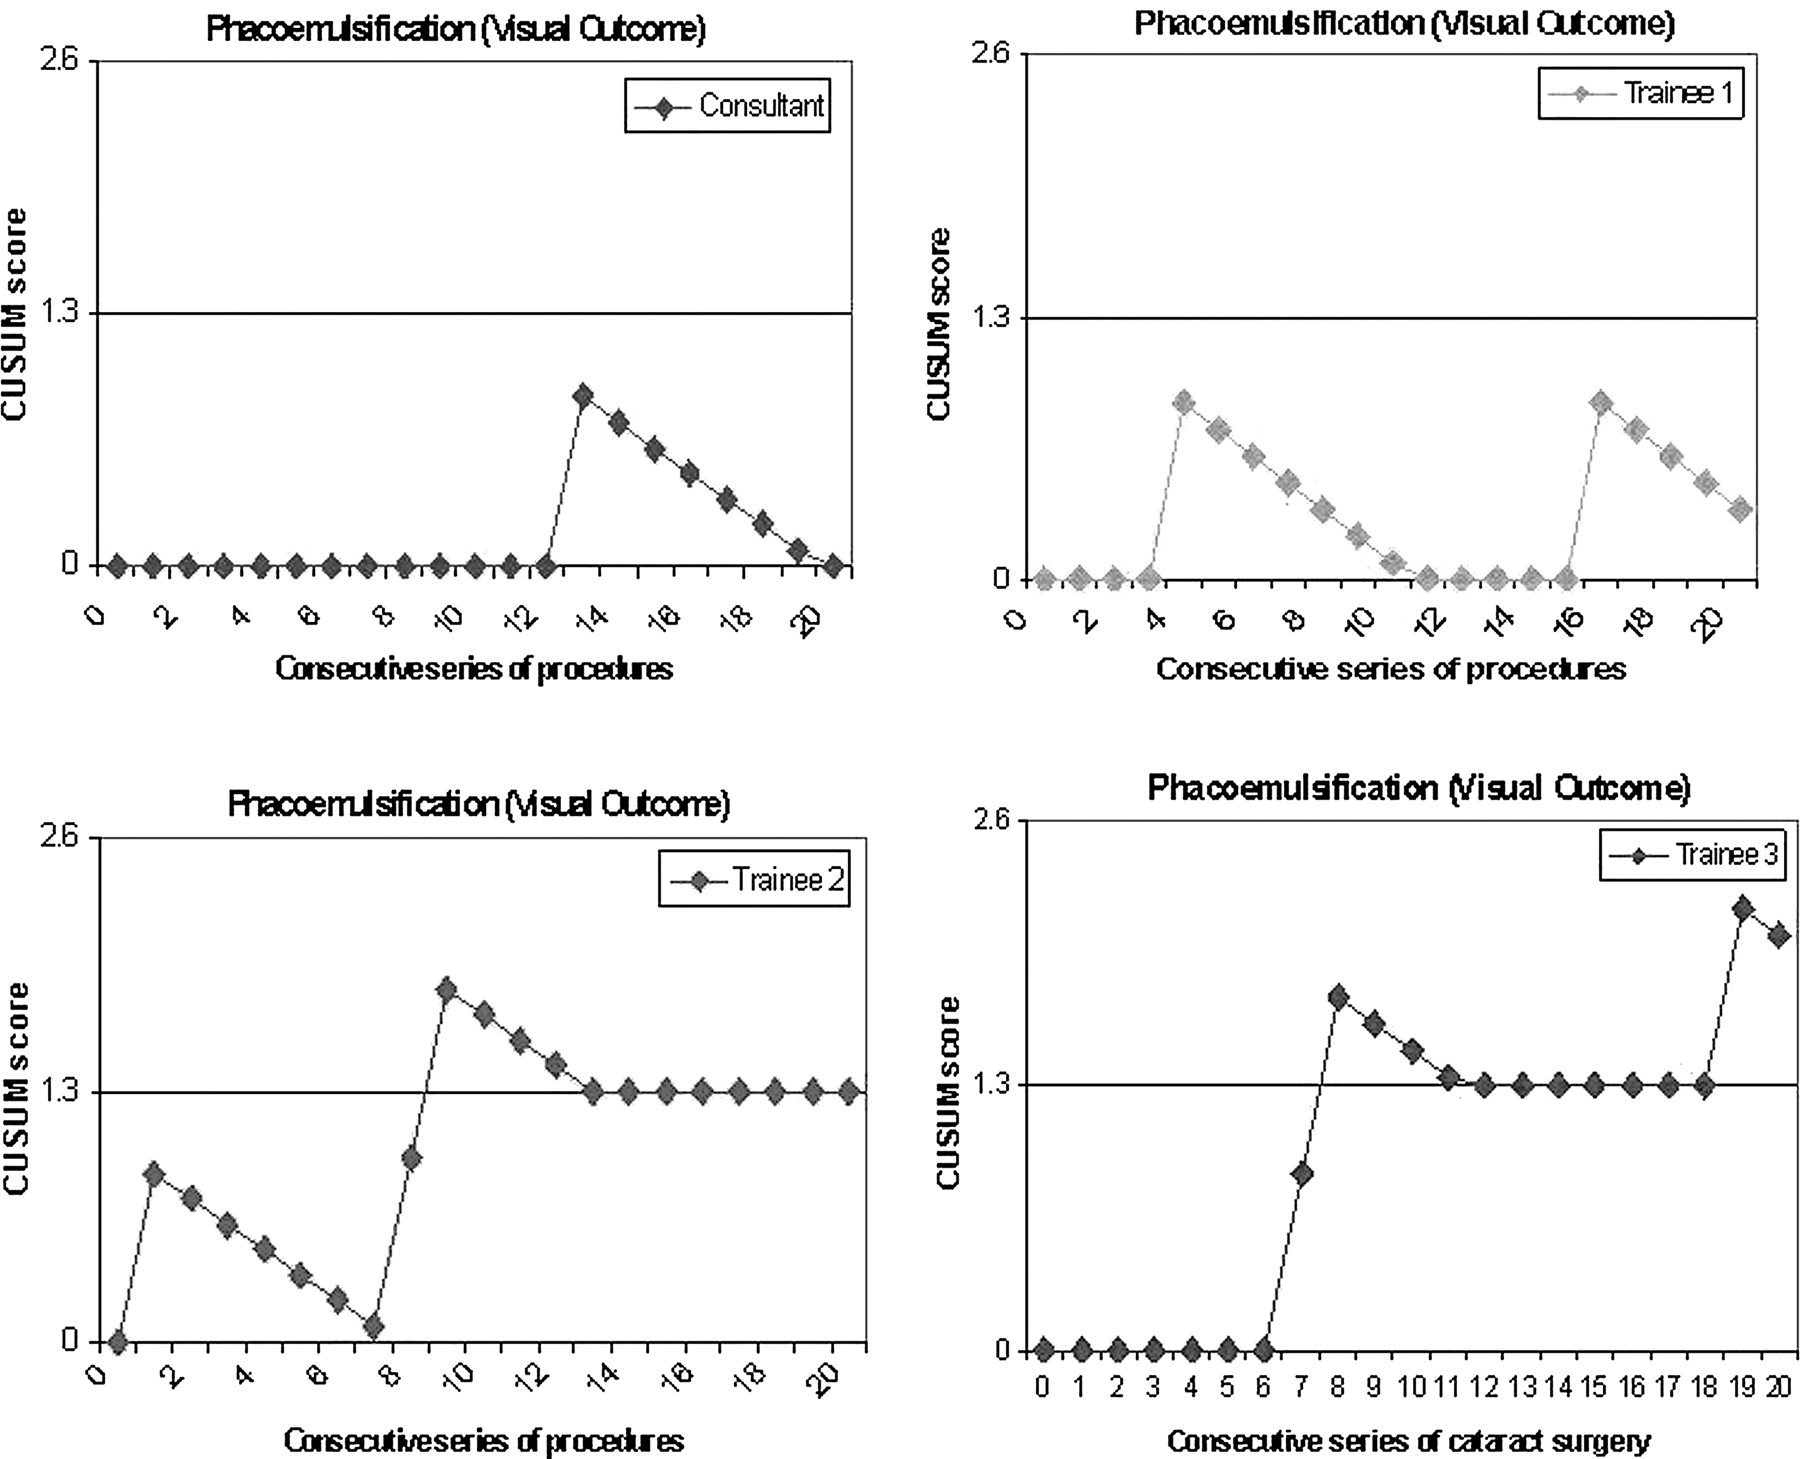
Figure 3 shows the CUSUM charts for postoperative refracted vision. Trainee 1 had two patients who had postoperative vision worse than 6/12, that is, case no 4 who happened to have PCR and high surgically induced astigmatism, and case no 16 who had cystoid macular oedema (CMO). The chart did not cross the decision interval, as the occurrences were far apart. Trainee 2 had three patients with a poor visual outcome. Case no 1 had PCR and CMO, case no 8 had PCR and severe postoperative inflammation, and case no 9 had infective endophthalmitis. Trainee 3 had three patients with poor visual outcomes, that is, case no 7 who had CMO, and case nos 8 and 19, who had surgically induced high astigmatism. The CUSUM charts of trainees 2 and 3 crossed the decision interval, as two of their three failures occurred sequentially. They were both required to review their cases with poor outcome and to find corrective measures to reduce surgically induced astigmatism. The consultant demonstrated a flat chart with one isolated case of poor vision which was due to CMO.
Cumulative sum (CUSUM) chart for four surgeons based on a postoperative refracted visual acuity worse than 6/12.
Discussion
Applications of CUSUM in clinical practice, especially in monitoring trainees' performance, have been encouraging. Its usefulness has been documented in endotracheal intubation,8 extradural and spinal anaesthesia,9 endoscopic retrograde cholangiopancreatography,14 18 renal biopsy4 and catheter insertion in peritoneal dialysis.10 This study on phacoemulsification, displaying CUSUM charts of three trainees with a typical learning curve proved that CUSUM has the ability to promptly detect poor performances and is an effective competency monitoring tool in cataract surgery as well.
Monitoring trainees' surgical performance is a demanding task. The conventional methods are logbooks, progress interviews, peer reviews or direct supervision. Trainees are often assessed based on quantity, that is, the number of surgery procedures performed, and not quality, that is, rates of surgical complication or successful outcome. These methods are subjective, often unreliable, time-consuming and without reference to validated standards. Even if surgical outcomes were monitored by reviewing log book, it is slow in detecting trends of unacceptable performances, and much harm could have been done to patients before the deteriorating performance of a trainee is identified.
CUSUM is superior to conventional methods, as it is objective and dynamic, tracks performance over time and refers to predetermined outcome standards. The standard of performance can be modified based on updated values derived from benchmarking. Different standards can also be set for surgeons at different levels of training. The unique and important feature of CUSUM is its ability to indicate the trend of deteriorating performance early, prompting preventive and corrective measures.
The graphic display of CUSUM chart is simple and easy to understand. An upward chart signifies unacceptable performance. When it happens, both the trainees and their supervisors should take action, for example by reviewing video recordings of the surgery and closer monitoring on subsequent surgeries. When the upward trend is continuous despite intervention, this may indicate the need to assess the surgeons' stereo-acuity and bi-dexterity, essential prerequisites in performing microsurgery.
CUSUM can also be used to set an average number of procedures needed to be done before trainees are allowed to perform independently. Whenever possible, trainees should carry out that set number of procedures on animal or simulated eyes in a wet lab before performing on patients. This application has been studied for surgical trainees for endotracheal intubations, in which 19 attempts were required to overcome the learning curve,8 and for Tenckhoff catheter insertion for peritoneal dialysis, in which 23 procedures needed to be carried out to achieve less than 25% primary failure.10 Failing to achieve the learning curve at the specified number of cases may indicate that the particular trainee needs further supervision before being allowed to proceed to the next level of training.
CUSUM may not be applicable to all surgical procedures. The efficiency of CUSUM as a monitoring system depends on several criteria. First, the procedures must be frequently performed. Second, the success or failure of the procedure must be clearly defined and is closely related to surgeon's skill. Third, the complications of the procedure must be well defined. Cataract surgery fulfills such criteria, especially for PCR, as its occurrence closely reflects the surgeon's competency, and it is one of the main predictors for poor visual outcomes.19–25 Postoperative visual outcome is an indirect measure of surgeons' competency as patients' factors such as CMO can contribute to poor visual outcome. Thus, when reviewing trainees' CUSUM charts, their feedback on the occurrence of intraoperative complication and factors contributing to poor visual outcome are relevant and should be considered.
Like other monitoring systems, CUSUM faces the challenge of incomplete data entry on surgeries performed by individual surgeons. This problem can be overcome by automated data mining, either from electronic medical records or from the patient register. Since early 2009, CUSUM competency monitoring has been applied to doctors serving the Ministry of Health of Malaysia whose surgeries are captured in the cataract surgery registry. Individual surgeons can view their own CUSUM charts on the eCUSUM website (https://app.acrm.org.my/eCUSUM). When trainees view their charts online, they can activate an automated email message that will send their charts to their supervisors. By doing so, monitoring becomes more systematic, effortless and in real-time. Monitoring and evaluating the competency of surgeons, especially trainees, are essential and mandatory in ensuring patient safety and standard of care. We are convinced that a CUSUM analysis is useful, especially for busy consultants who need to supervise trainees. Beside the supervisor, individual surgeons can also use it for self appraisal and continuous quality improvement. CUSUM analysis on cataract surgery has now been implemented in the ophthalmology programme in the Ministry of Health Ophthalmology of Malaysia.
Acknowledgments
The authors wish to thank the Ministry of Health for the permission to conduct the study and for providing the research grant, N Hisham bin Abdullah, Deputy Director General, Ministry of Health, for his idea and support in the application of CUSUM in the Ministry of Health, P Lum and S Chen for the system development and statistical help.
References
Footnotes
Funding This study was supported by Malaysian Ministry of Health Minor Research Grant and is a research project for the first author as partial fulfillment for the degree of Master of Surgery (Ophthalmology), National University of Malaysia.
Competing interests None.
Provenance and peer review Not commissioned; externally peer reviewed.