Article Text

Abstract
Aims To evaluate objectively the meibomian gland area using newly developed software for non-invasive meibography.
Methods Eighty eyelids of 42 patients without meibomian gland loss (meiboscore=0), 105 eyelids of 57 patients with loss of less than one-third total meibomian gland area (meiboscore=1), 13 eyelids of 11 patients with between one-third and two-thirds loss of meibomian gland area (meiboscore=2) and 20 eyelids of 14 patients with two-thirds loss of meibomian gland area (meiboscore=3) were studied. Lid borders were automatically determined. The software evaluated the distribution of the luminance and, by enhancing the contrast and reducing image noise, the meibomian gland area was automatically discriminated. The software calculated the ratio of the total meibomian gland area relative to the total analysis area in all subjects. Repeatability of the software was also evaluated.
Results The mean ratio of the meibomian gland area to the total analysis area in the upper/lower eyelids was 51.9±5.7%/54.7±5.4% in subjects with a meiboscore of 0, 47.7±6.0%/51.5±5.4% in those with a meiboscore of 1, 32.0±4.4%/37.2±3.5% in those with a meiboscore of 2 and 16.7±6.4%/19.5±5.8% in subjects with a meiboscore of 3.
Conclusions The meibomian gland area was objectively evaluated using the developed software. This system could be useful for objectively evaluating the effect of treatment on meibomian gland dysfunction.
- Tears
- Imaging
- Eye Lids
- Cornea
This is an Open Access article distributed in accordance with the Creative Commons Attribution Non Commercial (CC BY-NC 3.0) license, which permits others to distribute, remix, adapt, build upon this work non-commercially, and license their derivative works on different terms, provided the original work is properly cited and the use is non-commercial. See: http://creativecommons.org/licenses/by-nc/3.0/
Statistics from Altmetric.com
Introduction
Meibomian oil, secreted from the meibomian glands, forms the lipid layer at the surface of the tear film which prevents excessive evaporation.1 Meibomian gland dysfunction (MGD) is a chronic diffuse abnormality of the meibomian glands commonly characterised by terminal duct obstruction and/or qualitative/quantitative changes in glandular secretion. It may result in alteration of the tear film, symptoms of eye irritation, clinically apparent inflammation and ocular surface disease.2 Obstructive MGD is a major cause of lipid layer deficiency and evaporative dry eye,3–6 and often results in an unstable tear film, damage to the ocular surface epithelium, chronic blepharitis and contact lens intolerance.7–11
Meibography is a technique that yields information on the morphological characteristics of meibomian glands by observing their silhouette through retroillumination of the everted eyelids from the skin side.12–15 We recently developed a non-contact infrared (IR) meibography technique that allows for non-contact observation of the structure of the meibomian gland with no discomfort to the patient.16 While conventional meibography is difficult to apply to the upper eyelid, non-contact meibography allows for observation of a wide area encompassing both the lower and upper eyelids.16 Very recently, Pult and Riede-Pult described a portable non-contact meibography device with an IR charged-coupled device (CCD) video camera,17 and we have developed a mobile pen-shaped meibography device with an IR LED light.18 Instruments offering non-contact meibography are now on the market in some regions of the world. One is the TOPCON BG-4M for slit lamp, which is an IR illumination system with an external IR CCD. The Meibom Pen is a mobile pen-shaped meibography device (Japan Focus Corporation, Tokyo, Japan), and others include the Eye Top Topographer, Sirius Scheimpflug Camera and Cobra Fundus Camera (CSO and bon Optic VerttiebsgmbH) and the OCULUS Keratograph 5M (Oculus, Wetzlar, Germany). These multifunctional ophthalmic instruments use their built-in IR camera for meibography. In the OCULUS software the practitioner has to mark the area of interest manually. The OCULUS software is able to enhance the contrast of the images and produces a three-dimensional simulation of the marked area based on the two-dimensional image, but there is no three-dimensional display. CSO and bon Optic developed the meibography device together, which resulted in the use of the abovementioned instruments combined with the Phoenix software (CSO and bon Optic VerttiebsgmbH). The software offers contrast enhancement when images are taken and a computerised grading system. Previous studies used subjective grading scales,16 ,19–21 and the Pult and Nichols scales were used to determine their repeatability.12 ,20 Pult et al20 reported that the intra-observer and inter-observer agreement rates revealed limitations of subjective grading. In recent studies on computerised measurements of meibomian gland loss,17 ,20–24 the images were analysed using the image editing software Image J (National Institute of Health; http://imagej.nih.gov/ij). Users of this software, however, have to identify the gland region on the image. Different examiners may draw the gland region differently, leading to inter-observer variability. Koh et al25 were the first to apply original algorithms to automatically analyse meibography images to identify meibomian glands, and showed a clear distinction between healthy and unhealthy images based on both the mean arc length and mean entropy. Their method of measuring meibomian gland loss, however, is an indirect method.
The purpose of the present study was to develop an objective and automatic system to measure the meibomian gland area and to compare the results of the automatic calculation of the meibomian gland area with our subjective grading.16 ,26–33
Methods
Subjects
The 124 study subjects comprised 36 patients diagnosed with obstructive MGD at the University of Tokyo and Itoh Clinic and 88 normal volunteers (72 men and 52 women; mean±SD aged 38.1±14.4 years, range 20–80). The characteristics of the subjects are shown in table 1. The diagnosis of MGD was based on the presence of ocular symptoms, lid margin abnormalities (irregular lid margin, vascular engorgement, plugged meibomian gland orifices and antero- or postero- replacement of the mucocutaneous junction) and poor meibum expression even with hard digital pressure. The subjects included 80 eyelids of 42 subjects without meibomian gland loss on visual inspection of images (meiboscore=0), 104 eyelids of 57 patients with meibomian gland area loss of less than one-third of the total area (meiboscore=1), 26 eyelids of 11 patients with meibomian gland area loss between one-third and two-thirds of the total area (meiboscore=2) and 23 eyelids of 14 patients with meibomian gland area loss of more than two-thirds of the total area (meiboscore=3). Exclusion criteria included ocular allergies, contact lens wear, continuous eyedrop use, history of eye surgery and systemic or ocular diseases that might interfere with tear film production or function. Patients whose eyes exhibited excessive meibomian lipid secretion were also excluded. Images that were not sufficiently clear for automatic analysis were excluded. The exclusion criteria for the images included out of focus images and images that included something other than the eyelids and their surrounding tissues.
Characteristics of normal subjects and patients with meibomian gland dysfunction (MGD)
Study design
Meibography was performed using the non-invasive meibography system described below and the images were analysed using the software described below. Using the software for detecting the shape of the meibomian gland and automated quantitative analysis of the meibomian gland area, a single analyser (JS) calculated the number of pixels of meibomian gland areas for upper and lower eyelids versus meiboscores and the meibomian gland area relative to the total analysis area. The analyser was masked as to whether the participant was positive or negative for MGD while performing the image analysis for both subjective and digital grading.
Equipment
The non-invasive meibography system comprised a slit lamp (SL-D7, Topcon, Tokyo, Japan) equipped with a BG-4M and a 0.5 inch CCD camera (XC-EI-50, Sony, Tokyo, Japan), an external monitor and a recording device. Images were obtained with this system using an IR light source. This meibography system allows for easy observation of the meibomian gland structures in both the upper and lower eyelids without causing patient discomfort. The resolution of the CCD camera was 0.3 million pixels, digitised in gray scale images of 640×480 pixels.
Development of software for automated quantitative analysis of meibomian gland area
Analysis preprocessing
We first applied a Wallis filter to the raw meibography image (figures 1A, 2A and 3A) to emphasise areas of low contrast (figures 1B, 2B and 3B). Next, a Gaussian filter (9×9) process was applied to reduce noise (figures 1C, 2C and 3C). We then subtracted figures 1C, 2C and 3C from a normalised raw image and processed the resulting image with a Gaussian filter (39×39). To further reduce the contrast inconsistency we applied the same image processing steps (ie, Wallis filter followed by image subtraction) to the subtracted image (figures 1D, 2D and 3D).
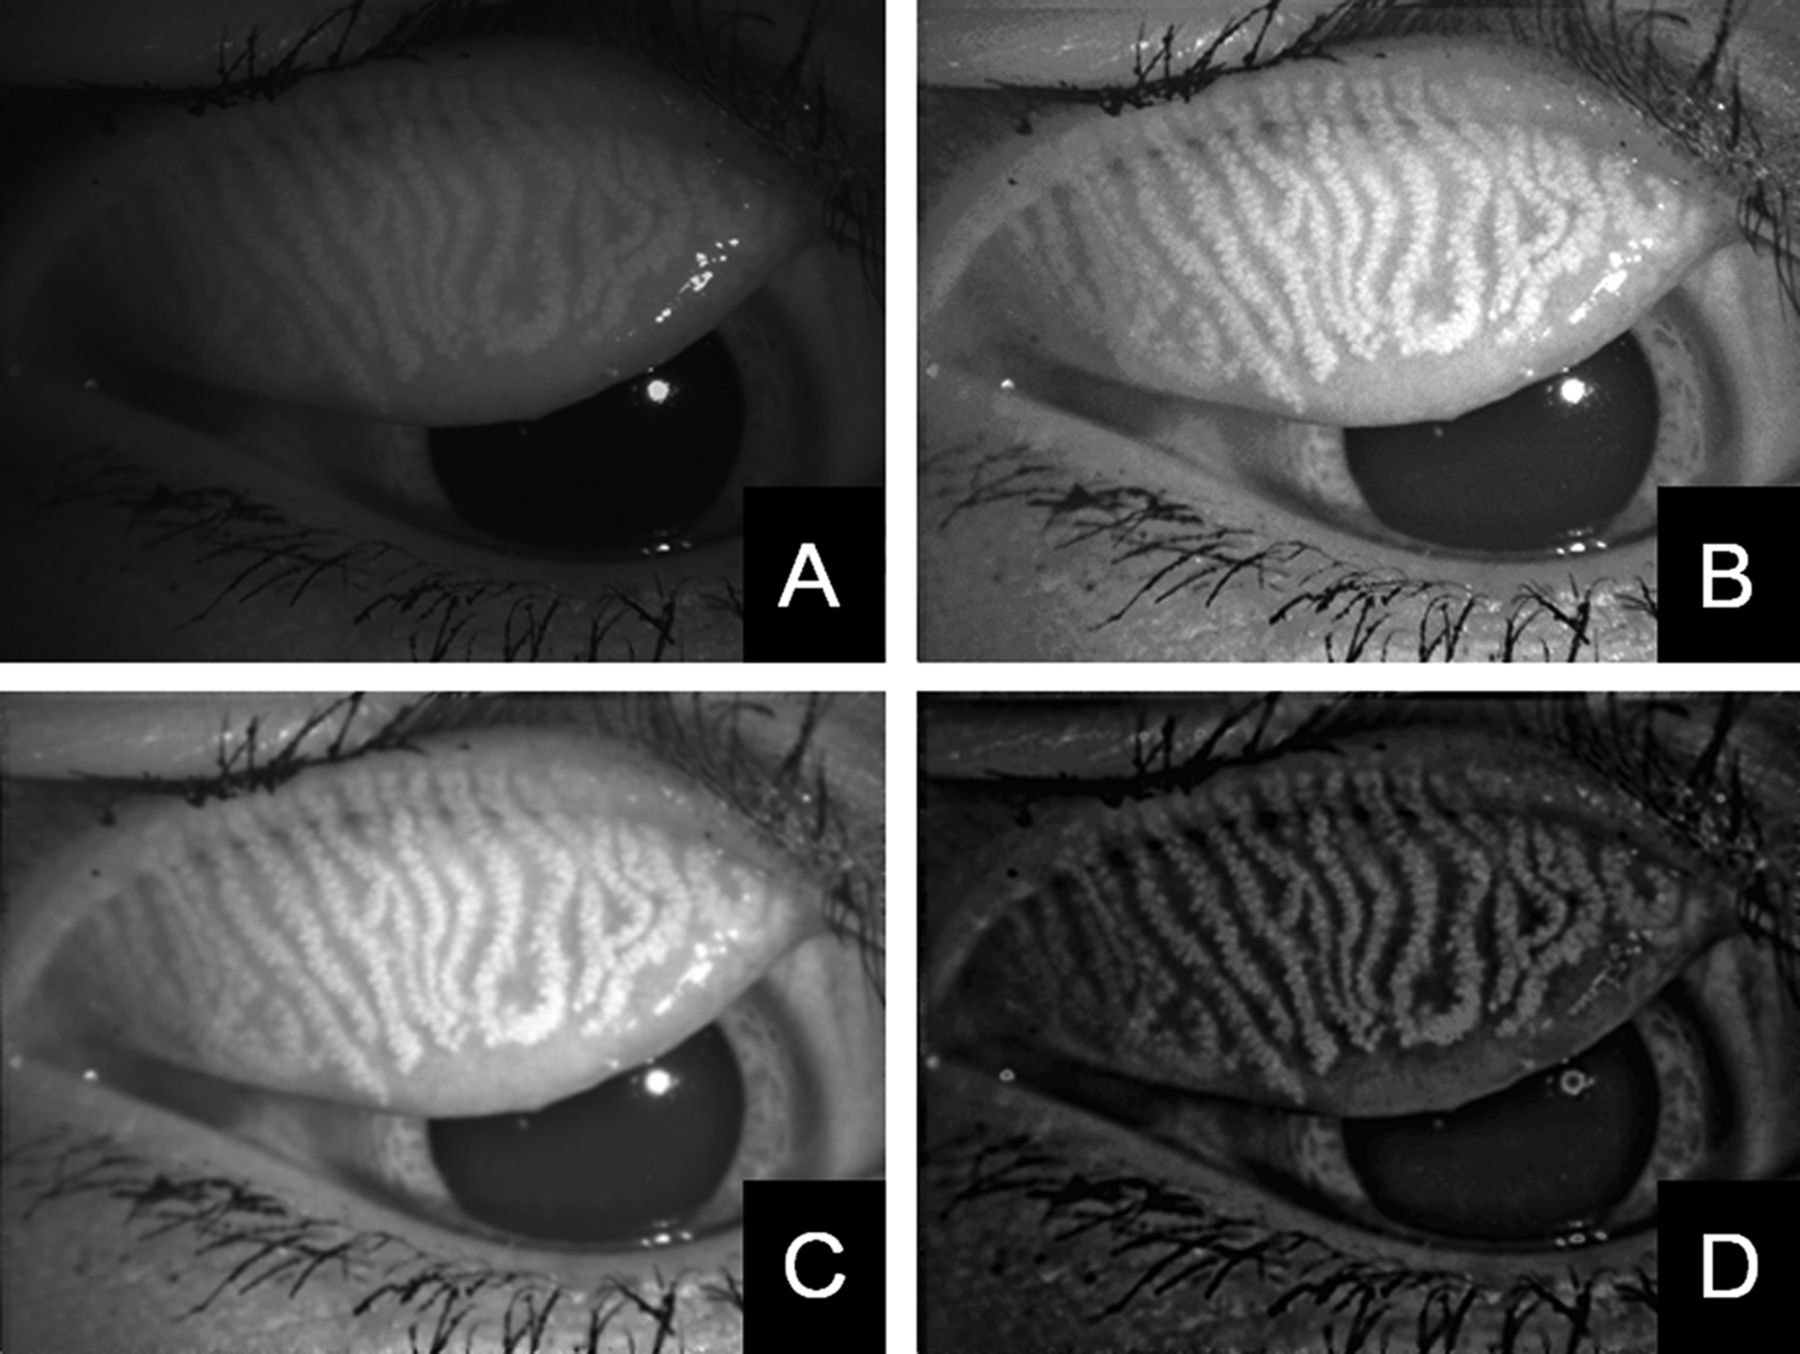
Analysis preprocessing of meiboscore 0 in upper eyelid of 21-year-old woman. The further processing is shown in Figures 4 and 7. (A) Raw image. (B) Applying a Wallis filter to the raw image. (C) Applying a Gaussian filter to (B). (D) Preprocessed image.

Automatic detection of the measurement area
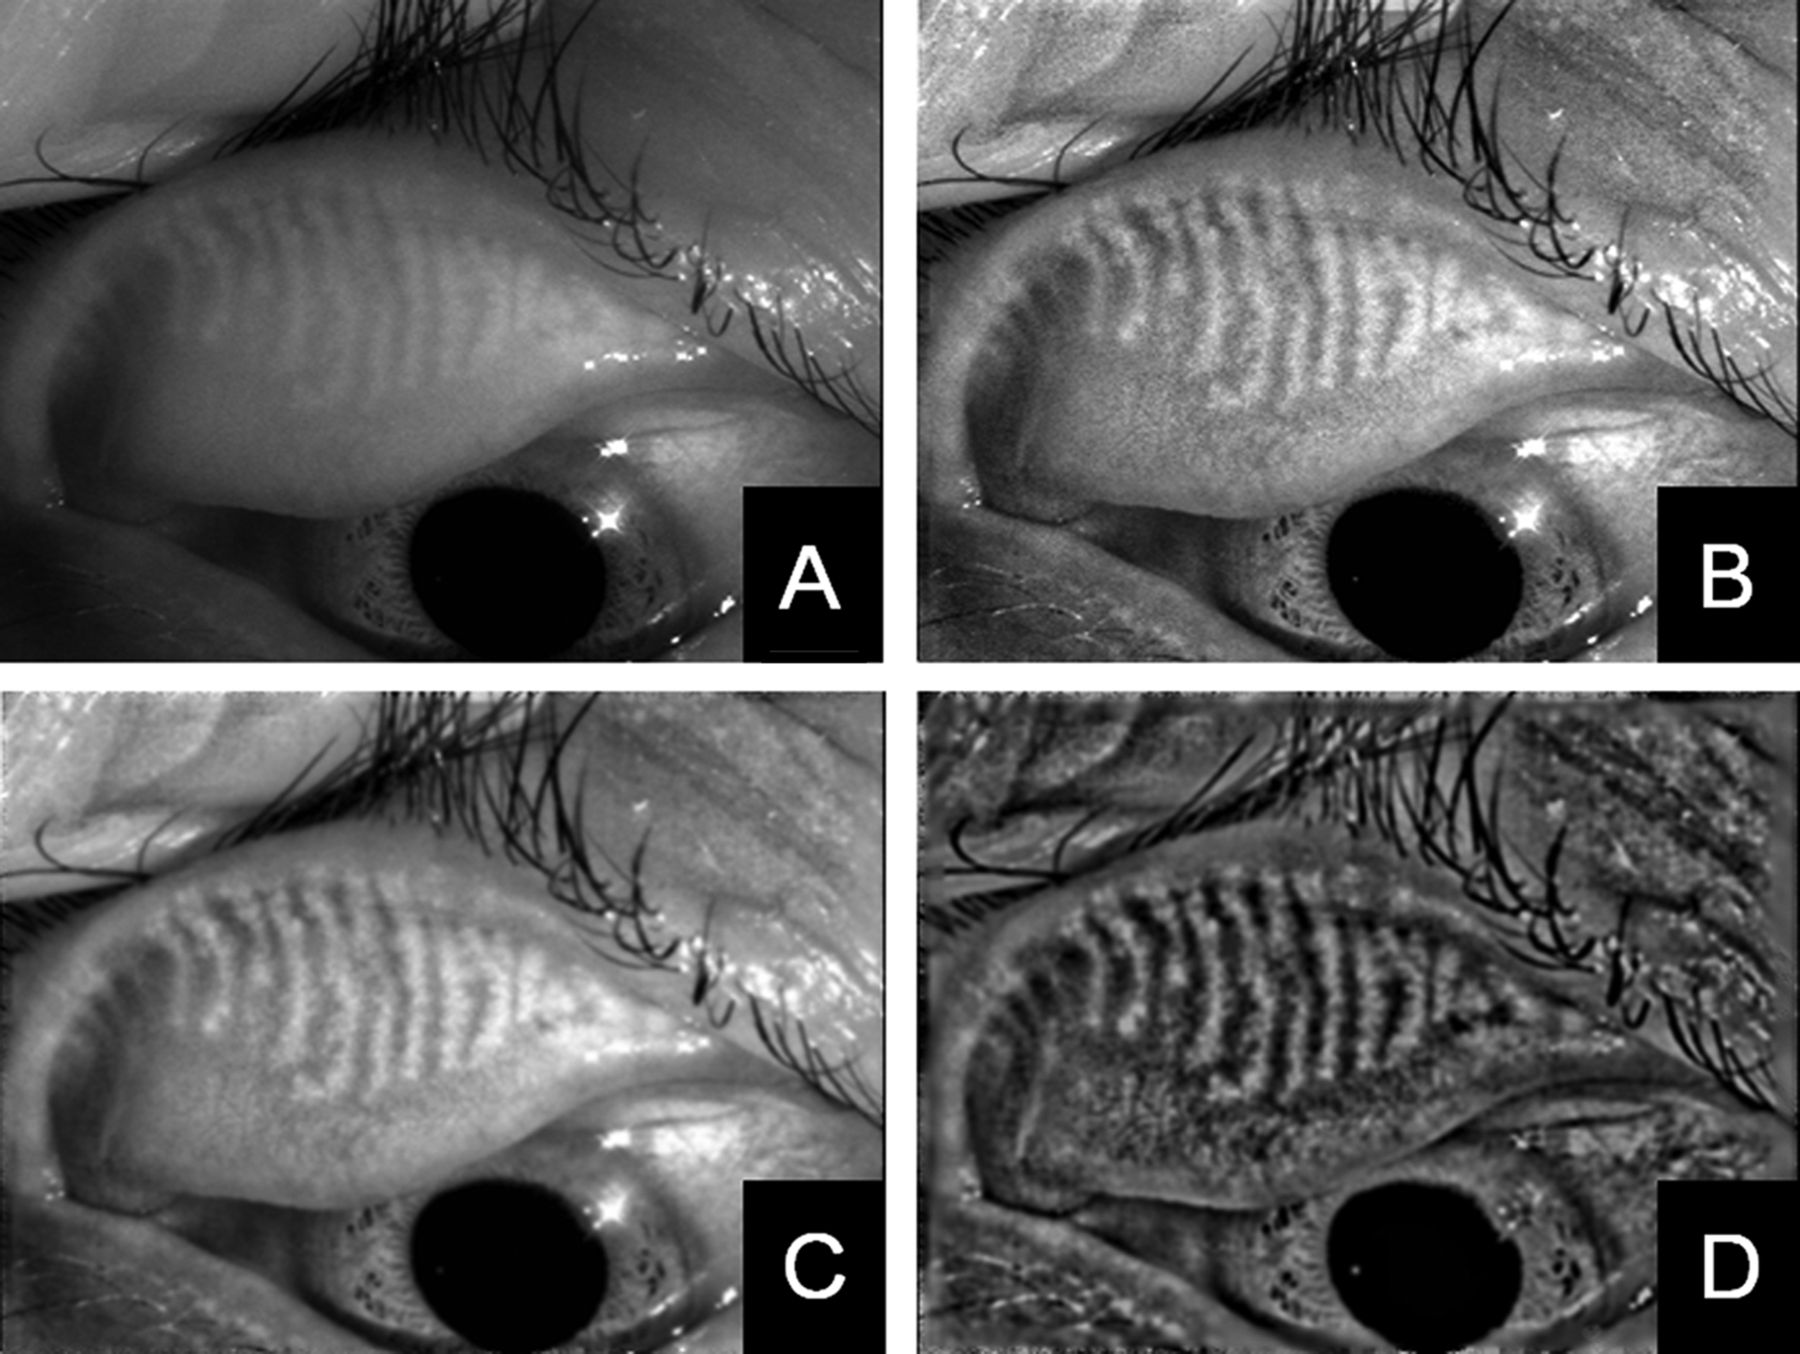
We first applied a discriminant analysis method34 to a preprocessed image (figures 4A, 5A and 6A) and then applied erosion image processing to separate the measurement area from the other areas (figures 4B, 5B and 6B). A labelling process was then applied to define the measurement area. The measurement area is detected as a closed area by a fold line of everted eyelid and a line of lid margin. The area typically is the largest of the separated areas. In our method we assume that the measurement area is the largest area of the separated areas (figures 4C, 5C and 6C). Dilation image processing was applied to restore the measurement area condition to that prior to application of the erosion image processing. Figures 4D, 5D and 6D show the result of edge detection of the image after dilation. A convex hull was applied to produce reference points. The measurement area was then detected by applying spline interpolation. Examples of this step are shown in Figures 4E, 5E and 6E.

Automatic detection of the measurement area of meiboscore 0. (A) Applying the discrimination analysis method. (B) Applying erosion image processing. (C) Applying the labelling process. (D) Edge detection. (E) Applying spline interpolation to reference points processed by the convex hull.

Automatic detection of the measurement area of meiboscore 2. (A) Applying the discrimination analysis method. (B) Applying erosion image processing. (C) Applying the labelling process. (D) Edge detection. (E) Applying spline interpolation to reference points processed by the convex hull.

Automatic detection of the measurement area of meiboscore 3. (A) Applying the discrimination analysis method. (B)Applying erosion image processing. (C) Applying the labelling process. (D) Edge detection. (E) Applying spline interpolation to reference points processed by the convex hull.
Detection of meibomian glands
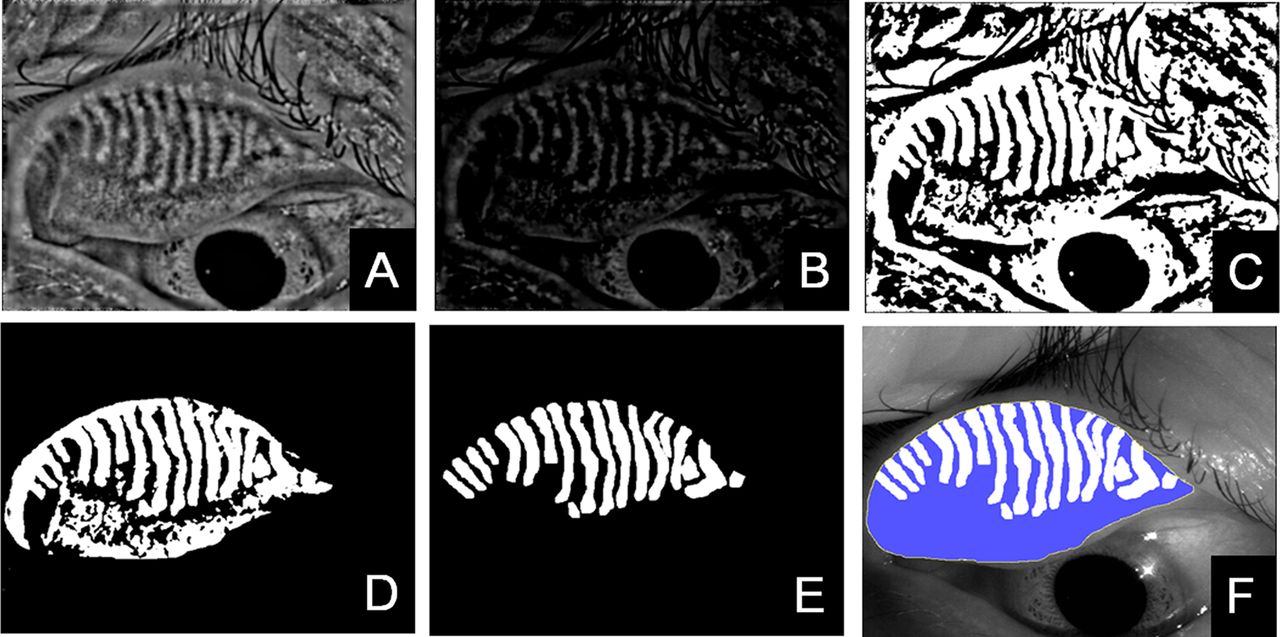
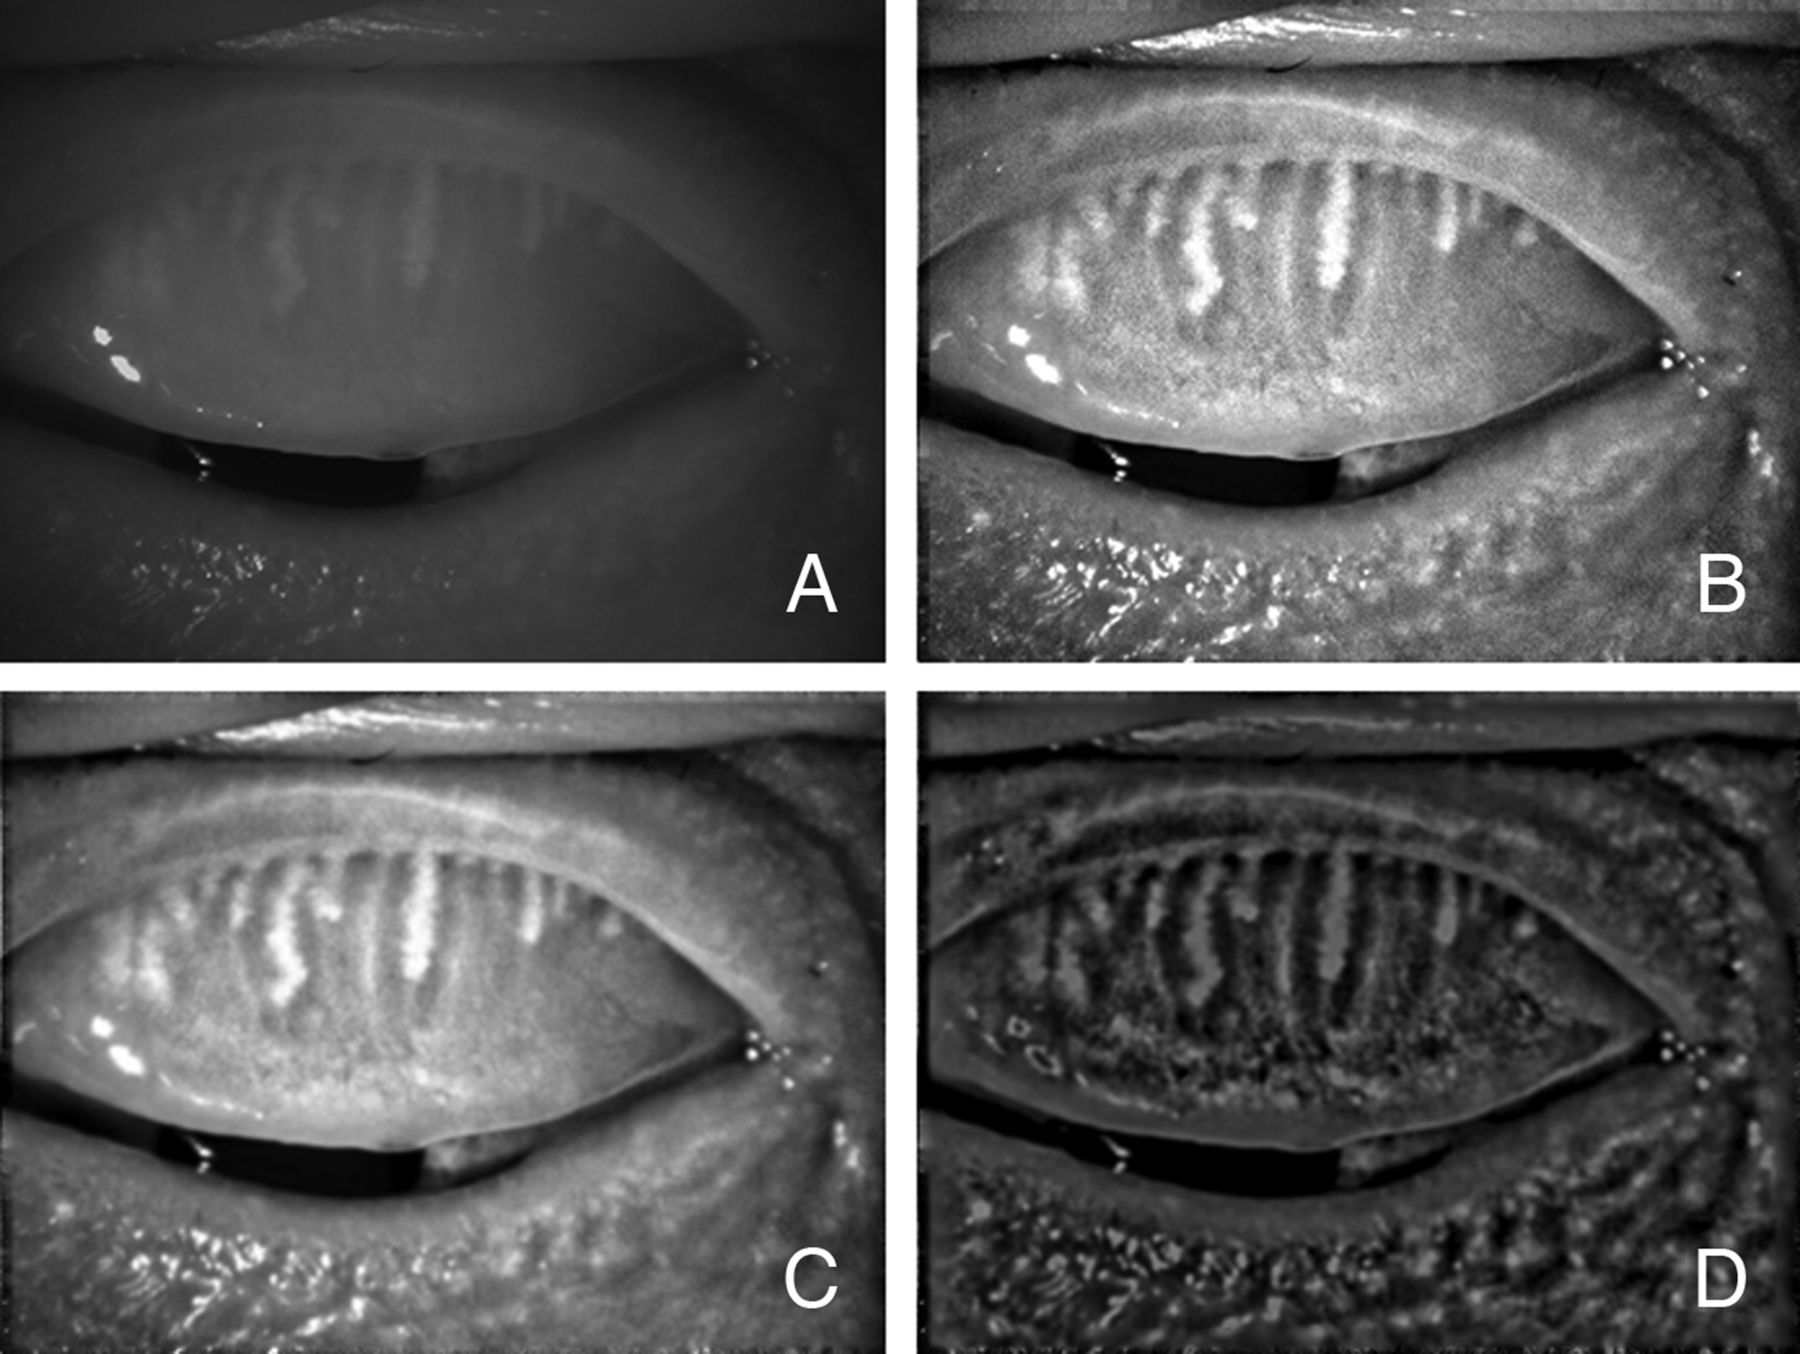
High-pass filtering was applied using a fast Fourier transform to a preprocessed image (figures 7A, 8A and 9A) to obtain the images shown in figures 3B, 6B and 9B. We then applied a γ correction process to adjust the brightness (figures 7C, 8C and 9C). The measurement area was then selected (figures 7D, 8D and 9D). Figures 7E, 8E and 9E show the results after excluding misdetection; this removal is automated. Figures 7F, 8F and 9F show the measurement area filled with white and blue colours. The white area indicates areas with meibomian glands and the blue area indicates areas without meibomian glands.

Meibomian gland detection of meiboscore 0. (A) Prepocessed image. (B) High-pass filtering using fast Fourier transform. (C) Applying the γ correction method. (D) Mapping. (E) Excluding misdetection. (F) Area for measurement and meibomian glands.
Meibomian gland detection of meiboscore 2. (A) Prepocessed image. (B) High-pass filtering using fast Fourier transform. (C) Applying the γ correction method. (D) Mapping. (E) Excluding misdetection. (F) Area for measurement and meibomian glands.

Meibomian gland detection of meiboscore 3. (A) Prepocessed image. (B) High-pass filtering using fast Fourier transform. (C) Applying the γ correction method. (D) Mapping. (E) Excluding misdetection. (F) Area for measurement and meibomian glands.
Repeatability of the software for automated quantitative analysis of the meibomian gland area
To examine the repeatability of image analysis with the software, images of meibomian glands were obtained using the non-contact meibography system three times by a single examiner (RA) in 14 upper and 14 lower eyelids of 10 normal subjects and in 22 upper and 22 lower eyelids of 22 patients with MGD. Intra-examiner repeatability was assessed as the coefficient of variation, SD of three measurements/mean of three measurements and Bland–Altman plots. The means and SDs of the coefficient of variation in the 28 eyelids of 10 normal subjects and the 44 eyelids of 22 patients with MGD were calculated. Bland–Altman plots were created using the first and second measurements for these subjects. When the 95% CI of the difference in meibomian gland area relative to the total analysis area did not include 0, the fix bias was judged to exist.
Statistical analysis
The mean ratios of the meibomian gland area to the total analysis area in the four groups with meiboscores 0–3 were compared using a non-parametric Steel–Dwass test and the mean ratios of the meibomian gland area to the total analysis area in the upper and lower lids in the four groups were compared using a Mann–Whitney U test. The mean ratios of the meibomian gland area to the total analysis area in the upper/lower lids were compared between men and women in the four groups using a Mann–Whitney U test. A p value of <0.05 was considered significant. Data are shown as mean±SD unless otherwise specified.
Results
Two insufficient images were excluded: one was out of focus and the other was an image that included a fingertip. Because a binarised image was used to visualise the eyelid area, the large fingertip image could have affected the calculation. After the automatic visualisation of meibomian glands, manual correction was necessary for two images. In one image there was a large bright area due to a strong reflection of illumination and automated detection judged it as a meibomian gland area although no meibomian glands existed in the area. In the other image with extensive meibomian gland loss there was a dark area that lacked information. In this case, a border was manually drawn to exclude the dark area. These cases required expert judgement of the raw images before visualisation of the area for measurement.
Ratio of meibomian gland area to total analysis area
The meibomian gland area (ie, number of pixels) with a meiboscore of 0, 1, 2 or 3 for the upper and lower eyelids is shown in figures 10A and B. The magnification error may influence the result. Taking into consideration a reduction in the magnification error, the ratio of meibomian gland area to total analysis area would be acceptable. The ratios of the meibomian gland area to the total analysis area in eyes with a meiboscore of 0, 1, 2, and 3 were 53.2±5.70%, 49.4±5.99%, 34.8±4.65% and 18.5±5.97%, respectively (figure 10C). As the meiboscore increased, the ratio of the meibomian gland area to the total analysis area decreased. A Steel–Dwass test indicated significant differences between any combination of two groups from the four groups (p=0.011 for meiboscores 0 vs 1, p<0.001 for meiboscores 0 vs 2, 0 vs 3, 1 vs 2, 1 vs 3 and 2 vs 3).

Meiboscore (meibomian gland area/ratios of meibomian gland area to total analysis area). Meibomian gland area, (ie, number of pixels) with a meiboscore of 0, 1, 2, or 3 for (A) the upper eyelids and (B) the lower eyelids. (C) Ratios of meibomian gland area to total analysis area calculated with the software for automated quantitative analysis of meibomian gland area in eyes with a meiboscore of 0, 1, 2, or 3. As the meiboscore increased, the ratio of the meibomian gland area to the total analysed area decreased.
Difference between upper and lower eyelids
The ratios of meibomian gland area to total analysis area were significantly different between the upper and lower eyelids in subjects with meiboscores of 0 (p=0.034) and 1 (p=0.0004; table 2).
Ratio of meibomian gland area to total analysis area in each meiboscore group
Sex difference
The results of the comparison of ratios of meibomian gland area to total analysis area between men and women in each meiboscore group are shown in table 3. There was no significant sex difference in the ratio of the meibomian gland area in the upper/lower eyelids.
Comparison of ratios of meibomian gland area to total analysis area between men and women for each meiboscore group
Repeatability of the automated objective analysis of area of meibomian glands
The intra-examiner coefficients of variation for the objective analysis of upper/lower meibomian gland area in normal controls and in patients with MGD were 0.59±0.26%/0.40±0.20% and 0.47±0.45%/0.44±0.31%, respectively. The intra-examiner coefficient of variation was small, indicating that the repeatability of the automated quantitative analysis of the meibomian gland is high. Bland–Altman plots showed that the 95% CI of the difference in meibomian gland area relative to the total analysis area in the normal upper eyelids, normal lower eyelids, upper eyelids of patients with MGD and lower eyelids of patients with MGD were −0.054 to 0.382, −0.397 to −0.027, −0.045 to 0.242 and −0.241 to 0.062, respectively. Negative fix bias was therefore judged to exist only in normal lower eyelids (figure 11).

Bland–Altman plots for (A) upper eyelids of normal subjects, (B) lower eyelids of normal subjects, (C) upper eyelids of patients with Meibomian gland dysfunction (MGD) and (D) lower eyelids of patients with MGD. The 95% CI of the difference in meibomian gland area relative to the total analysis area in the normal upper eyelids, normal lower eyelids, upper eyelids of MGD patients and lower eyelids of MGD patients were −0.054 to 0.382, −0.397 to −0.027, −0.045 to 0.242 and −0.241 to 0.062, respectively. Negative fix bias was judged to exist only in the lower eyelids of normal subjects.
Discussion
This study describes an objective grading system for identifying the meibomian gland area in non-contact meibography images of the upper and lower eyelids using newly developed specialised software. Several studies have performed subjective grading of the area of meibomian gland loss.12 ,19 Arita et al16 reported subjective grading in the upper and lower eyelids using non-contact meibography.16 ,26–33 A method to objectively grade the area of meibomian gland loss would be more useful for evaluating the subtle morphological changes of meibomian glands. In several recent studies, images of meibomian glands were analysed using Image J software.17 ,20–24 However, with this software the user must manually define the gland region for each patient. Different examiners may draw the gland region differently, leading to inter-observer variability. Koh et al25 automatically analysed images of meibomian glands using original algorithms to identify them, and demonstrated a clear distinction between healthy and unhealthy glands based on both mean arc length and mean entropy only in the upper eyelids. Their method provides such parameters as central length of the detected meibomian glands and spaces between neighbouring meibomian glands, which are not necessarily associated with MGD. In our newly developed method the measurement area is automatically defined and the contours of each meibomian gland in the upper and lower eyelids are analysed. This method is likely to be advantageous for detecting local and subtle changes of meibomian glands because it specifies the outline of the meibomian gland itself and not the meibomian gland area. The results of the present study indicate that the ratios of the meibomian gland area to the total area significantly decrease as the meiboscores increase, and there were significant differences between combinations of any two of the four groups. These results indicate a good correlation between subjective grading and objective measurements of the meibomian gland area. While there was a significant difference in the ratios of the meibomian gland area to the total analysis area between eyes with meiboscores of 0 and 1, the difference was small. Cases with very slight shortening or dropout were judged to have a meiboscore of 1, and several cases with these slight alterations were included in the present study. This is a likely reason for the similar values in groups with meiboscores of 0 and 1.
Robin et al35 described the progression of MGD severity. Progressive dysfunction results in dilation, distortion, shortening and loss of visualisation of the ducts. Arita et al27 reported the coexistence of various morphological changes including enlargement or dilation and also atrophy, narrowing, cut-off, distortion, shortening and dropout in patients with MGD. Because meibomian glands can enlarge in MGD patients, measurement of meibomian gland area alone may not detect MGD in some patients. It is likely, however, that enlargement is an early finding of MGD and that shortening and dropout occur in more advanced stages of the disease. Thus, measuring the meibomian gland area could be useful for diagnosing MGD.
We compared the ratios of meibomian gland area to the total analysed area between the upper and lower eyelids and evaluated sex differences in subjects with meiboscores of 0, 1, 2 or 3. The ratio of meibomian glands in the lower eyelids of subjects with a meiboscore of 0 was significantly greater than that in the upper eyelids, suggesting that meibomian glands occupy a greater proportion of the lower tarsal plate than of the upper tarsal plate. This may be because the meibomian glands in the lower eyelids are thicker and the space between them is narrower than in the upper eyelids.
There was no significant sex difference in the ratio of the meibomian gland area to the total analysis area in subjects with meiboscores of 0 and 1. Some previous studies reported the effects of sex hormones on meibomian glands.36–40 In the present study, subjects with a meiboscore of 0 were healthy and young and no sex difference was detected. Because of the small sample size in cases with meiboscores of 2 and 3, statistical analysis was not performed except for the lower eyelid of subjects with a meiboscore of 3. To elucidate the effects of hormones on meibomian glands, further studies are needed to examine sex differences in the ratio of the meibomian gland area to the total analysis area.
Previous studies23 ,24 investigated the relation between the area of meibomian gland loss and parameters of subjective symptoms and tear film. Pult et al reported that meibomian gland loss is significantly correlated with the thickness of the lipid layer, tear break-up time and subjective symptoms.23 Ban et al24 reported that parameters of meibomian gland morphology, such as the mean length of meibomian gland ducts and the percentage area of meibomian glands, are significantly correlated with the parameters of tear film such as tear break-up time and fluorescein staining score. These findings suggest that morphometric analysis using meibography is useful for assessing ocular surface conditions. As the purpose of this study was to introduce new software for objective analysis of meibomian gland loss, subjective symptoms and tear film parameters related to meibomian gland loss were not investigated.
The coefficients of variation of the measurements in the study were very small, indicating that measurement with this objective image grading is highly reliable. In addition, this method is clinically useful because objective grading of whole meibomian glands allows evaluation of the effect of treatment in patients with meibomian gland-related diseases.
There are some limitations to the present study. First, manual correction was necessary after the automatic detection of meibomian glands was applied in images with too much reflected light and excessive meibomian gland loss. Thus, this system is not totally automatic. More revisions are necessary to make this system totally automatic. Second, the quality of imaging in the terminal part of the gland region might decrease with age and/or the context of the lipid profile. Further investigation is necessary to clarify the variation of findings in the terminal part of the glands. Third, comparison of the distal, mid and proximal zones of the gland regions was not performed. Fourth, since the measurement area is detected as a closed area by a fold line of everted eyelid and a line of lid margin, the way to evert an eyelid affects the total measurement area. When a lid is turned over too much, the detected measurement area may include the tarsal plate tissue beyond the area that is occupied by the normal meibomian glands. It is not possible to distinguish the area beyond the meibomian glands area from the area of gland dropout or shortening.
In conclusion, the relation between the meibomian gland area and the total analysis area could be objectively analysed using the newly developed software. This system will be useful for characterising the extent of MGD and objectively evaluating the effect of MGD treatments.
References
Footnotes
-
Contributors RA made substantial contributions to the study conception and design, data acquisition, drafting the manuscript and final approval of the version to be published. TH, JS, HT, RS and SA all contributed to the data analysis and interpretation, critical revision of the manuscript for important intellectual content and final approval of the version to be published.
-
Competing interests None.
-
Patient consent Obtained.
-
Ethics approval This study was approved by the institutional review board of the University of Tokyo and adhered to the tenets of the Declaration of Helsinki.
-
Provenance and peer review Not commissioned; externally peer reviewed.