Article Text

Abstract
Purpose To compare three methods of Schlemm's canal (SC) cross-sectional area (CSA) measurement.
Methods Ten eyes (10 healthy volunteers) were imaged three times using spectral-domain optical coherence tomography (Cirrus HD-OCT, Zeiss, Dublin, California, USA). Aqueous outflow vascular structures and SC collector channel ostia were used as landmarks to identify a reference location within the limbus. SC CSA was assessed within a 1 mm segment (±15 frames of the reference, 31 frames in all) by three techniques. (1) Using a random number table, SC CSA in five random frames from the set of 31 surrounding the reference were measured and averaged. (2) The most easily visualised SC location (subjective) was measured, and (3) SC CSA was measured in all 31 consecutive B-scans, and averaged. (comprehensive average, gold standard). Subjective and random CSAs were compared with the comprehensive by general estimating equation modelling, and structural equation modelling quantified agreement.
Results The average from five random locations (4175±1045 µm2) was not significantly different than that obtained from the gold standard comprehensive assessment (4064±1308 µm2, p=0.6537). Subjectively located SC CSA (7614±2162 µm2) was significantly larger than the comprehensive gold standard SC CSA (p<0.0001). The average of five random frames produced significantly less bias than did subjective location, yielding a calibration line crossing the ‘no-bias’ line.
Discussion Subjectively located SC CSA measurements produce high estimates of SC CSA. SC assessed by measuring five random locations estimate CSA was similar to the gold standard estimate.
- Aqueous humour
- Imaging
This is an Open Access article distributed in accordance with the Creative Commons Attribution Non Commercial (CC BY-NC 3.0) license, which permits others to distribute, remix, adapt, build upon this work non-commercially, and license their derivative works on different terms, provided the original work is properly cited and the use is non-commercial. See: http://creativecommons.org/licenses/by-nc/3.0/
Statistics from Altmetric.com
Introduction
Glaucoma is the second leading cause of irreversible blindness in the world.1 Elevated intraocular pressure (IOP) is the greatest risk factor for the presence and progression of glaucoma.2–5 Reduction of IOP is the only Food and Drug Administration approved outcome of glaucoma medications and procedures.6 IOP is regulated by a balance between aqueous humour production and outflow. Reducing outflow resistance is the most common technique for IOP reduction; however, there is no clinically viable technique to assess outflow structure.7
Previously we reported that Schlemm's canal (SC) cross-sectional area (CSA) as measured from spectral-domain optical coherence tomography (SD-OCT) is much smaller adjacent to collector channel ostia (SC—collector channel branch points). Specifically, within 160 μm of an ostium along its circumferential arc, SC CSA drops by 50%.8 This implied that SC CSA varies rapidly within short distances along its arc. Since that report, a number of publications have measured SC morphology with no strategy to address rapid variations in SC CSA.9–14 Being from multiple investigators, and with no existing consensus on assessment methodology, the techniques employed by these studies varied widely, failing to account for SC CSA variability in their study design. Further, no study has objectively quantified the magnitude of local variation in the healthy SC CSA, or supported a method of SC CSA assessment compared with a comprehensive assessment throughout a volumetric image. We hypothesise that: (1) SC cannot be accurately characterised by a single radial cross-sectional measurement, and (2) SC can be accurately and efficiently characterised by an a priori randomisation of SC CSA measurement locations to remove observer bias. The purpose of the present study was to test and compare an average of randomised SC CSA measurements, and a single subjective CSA measurement with the average of measurements from every scan within a 1 mm segment of SC.
Methods
The study was conducted in accordance with the tenets of the Declaration of Helsinki and the Health Insurance Portability and Accountability Act. The institutional review board of the University of Pittsburgh approved the study. All subjects gave written informed consent before participation.
Study protocol
The nasal limbus of normal healthy eyes was scanned three times by SD-OCT using a volumetric raster scan pattern.15 These scans were analysed by three techniques: (1) Using a random number table, CSA measurements at five random locations within a 1 mm segment of SC were made and averaged as an estimate of overall CSA (Random); (2) A single CSA measurement was made at a location within the 1 mm segment at which SC was easily visualised (Subjective) and (3) CSA was measured in all 31 scans within the 1 mm segment. The ‘comprehensive’ analysis was performed first. Once completed, the ‘random’ data were drawn from the comprehensive data set using a random number table to identify five random locations. Finally, the ‘subjective’ location was identified by reviewing the images within the region measured for the ‘comprehensive’ data. When SC was determined to be most prominent, the measurement of SC at that location within the existing ‘comprehensive’ data set was identified and used as the ‘subjective’ measurement.
The average of the 31 measurements provided the gold standard estimate of SC CSA for that segment. (Comprehensive, figure 1). In addition, within the 31 comprehensive measurements, change was quantified as the absolute difference in SC CSA between adjacent B-scans within each volume.
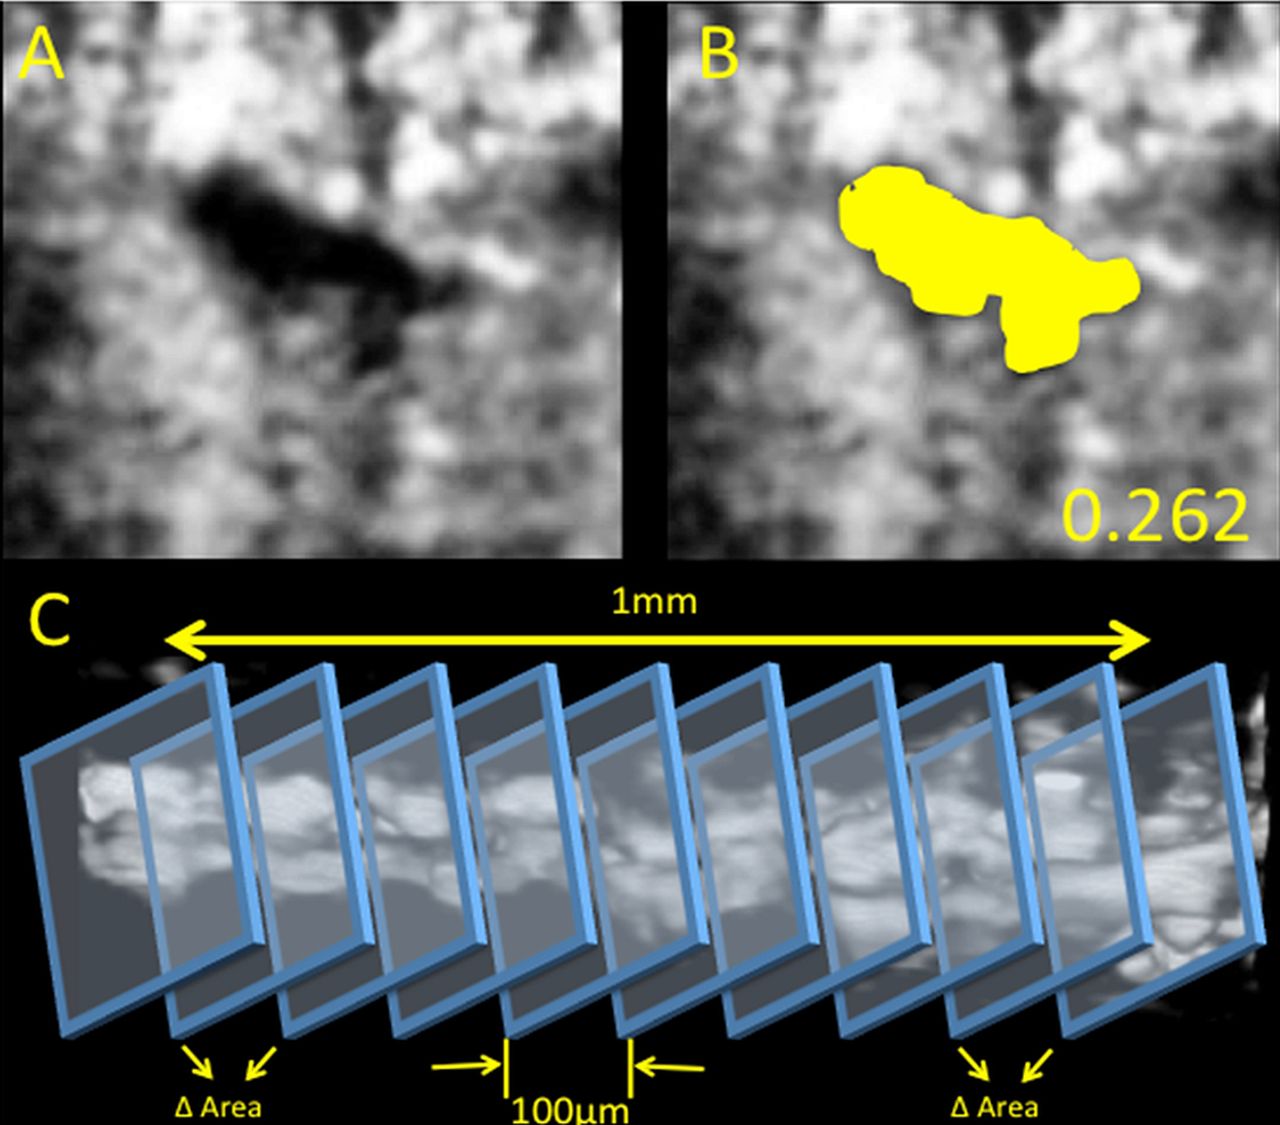
Schlemm's canal reconstruction. Cropped processed image showing a cross section of Schlemm's canal without (A) and with (B) the canal traced (yellow). The cross-sectional area of Schlemm's canal was measured as the area of the traced region. The circularity computed for this section is shown on the bottom right. Panel C illustrates the method to measure the variations in Schlemm's canal area using sequential cross sections.
SC imaging
Ten healthy volunteers were recruited from the staff and faculty of the UPMC Eye Center. At one visit, three ‘Anterior Segment 512×128’ volumetric scans were obtained (Cirrus HD-OCT; Zeiss, Dublin, California, USA). Each scan comprised a 4×2×4 mm (512×1024×128 samples) volume of the limbus region from the right eye (nasal quadrant). Chin and forehead rests were used to centre the eye in the image frame, and verbal commands were used to direct the volunteer to move their eye and centre the desired region of the limbus in the field of view. This procedure produces SD-OCT scans with the limbus oriented orthogonally to the laser beam. Twenty-seven thousand A-scans were acquired per second. B-scans were evenly distributed and separated by 31.25 μm. The scan time was 2 s.
Image processing
The routine used in our previous studies was applied to the present image set.15 Briefly, images were blurred and contrast enhanced by local contrast enhancement using adaptive histogram filtering in Fiji (ImageJ 1.45q, NIH, http://imagej.nih.gov/ij/). Images were resampled to create isotropic pixels, facilitating measurements. An adjustment of contrast and brightness was applied to the entire image stack. B-scans were excluded if SC's borders were not visible or excessive noise or shadowing were present. Using vasculature and collector channels as landmarks, one location contained in each of the three scan volumes was identified and used to ensure that the same region of the limbus was analysed throughout. Manual segmentation was performed as described previously,8 using a subjective full-width half-height approach.16 ,17 SC was traced using the freehand tool in Fiji, and area calculated automatically (figure 1).
Statistics
All CSA measurements are presented as mean±SD. The distributions of all comprehensive SC CSA measurements and of positional SC CSA fluctuation values are presented in histograms. Subjective and random SC CSA means were compared with the gold standard comprehensive mean. To account for correlation of data obtained in three scans of the same eyes, averages were compared by general estimating equation analysis. Structural equation modelling was used to quantify agreement between the three analysis techniques, and generate calibration equations between them. Agreement is displayed by scatter plot. Unlike regression, which only quantifies imprecision between data sets, a calibration equation quantifies imprecision and bias. For example, data sets of 1, 2, 3, 4, 5 and 1001, 1002, 1003, 1004, 1005 would produce a r2 value of 1.0 (no imprecision) with regression analysis, and fail to describe the enormous bias. A calibration equation quantifies both.
With a reported coefficient of variation of 11% in measurements of SC using the technique described above,8 and reported SC CSA of 12 890 µm2, this study has 90% power to detect a difference in the measurement of SC CSA as small as 1321.2 µm2, as significant.
Results
Demographics
The average age of the 10 healthy volunteers (3 male, 7 female) was 41 years (range 22–63 years). In total, 29 scans were analysed; one of the three volumetric scans from subject 8 was excluded from the reproducibility analysis due to eye movements during acquisition.
Data distributions
Thirty-one measurements from each of the 29 analysed scans yielded 899 measurements of SC CSA, and 870 B-scan to B-scan absolute differences within the normal cohort. The distribution of the SC CSA measurements is provided in figure 2. Note that 51 scans (5.7%) presented with SC CSAs between 0 μm2 and 1000 μm2. The remaining SC CSA values are distributed approximately normally around the mean value of 4064 μm2 with 23 CSAs (2.6%) larger than 10 000 μm2.
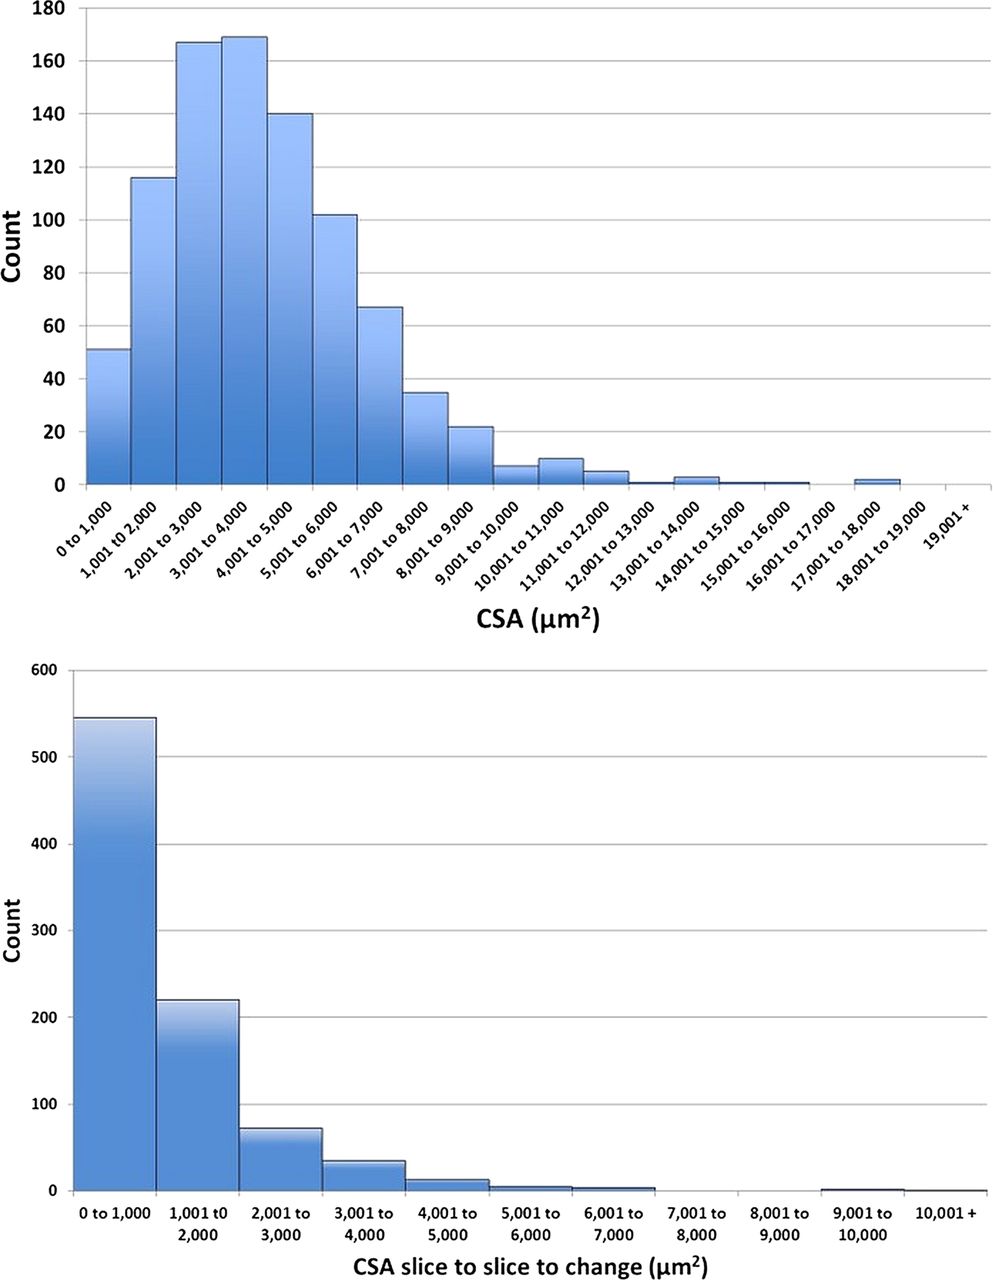
(Top) Histogram of cross-sectional area (CSA) measurements as the number of measurements. (Bottom) Histogram of CSA B-scan to B-scan change calculations as the total number of calculations.
The absolute difference in B-scan to B-scan SC CSA, or positional fluctuation was 1223±1162 μm2. Figure 2 shows the distributions of SC CSA and positional fluctuation for all subjects. Five hundred and forty-six (62.8%) of all frame to frame differences were less than 1000 μm2, though approximately 15 instances (1.7%) of SC CSA changes larger than 4000 μm2 were observed, with some approaching 10 000 μm2.
Cross-sectional area
The comprehensive, subjective and random mean CSAs are provided in table 1. Subjective estimates of SC CSA were significantly higher than the comprehensive mean (table 1). There was no difference between comprehensive and random estimates of SC CSA. (table 1) Subjective (figure 3) and random (figure 4) estimates of SC CSA were in good agreement with the comprehensive means; however, as suggested by the differences found in the general estimating equation analysis, the subjective CSAs were significantly biased toward higher values compared with the comprehensive means (figure 4).
Schlemm's canal (SC) cross-sectional area (CSA) as measured (1) comprehensively in 31 B-scans within a 1 mm segment of SC, (2) in a single subjective location, and three in five random frames is presented as mean±SD
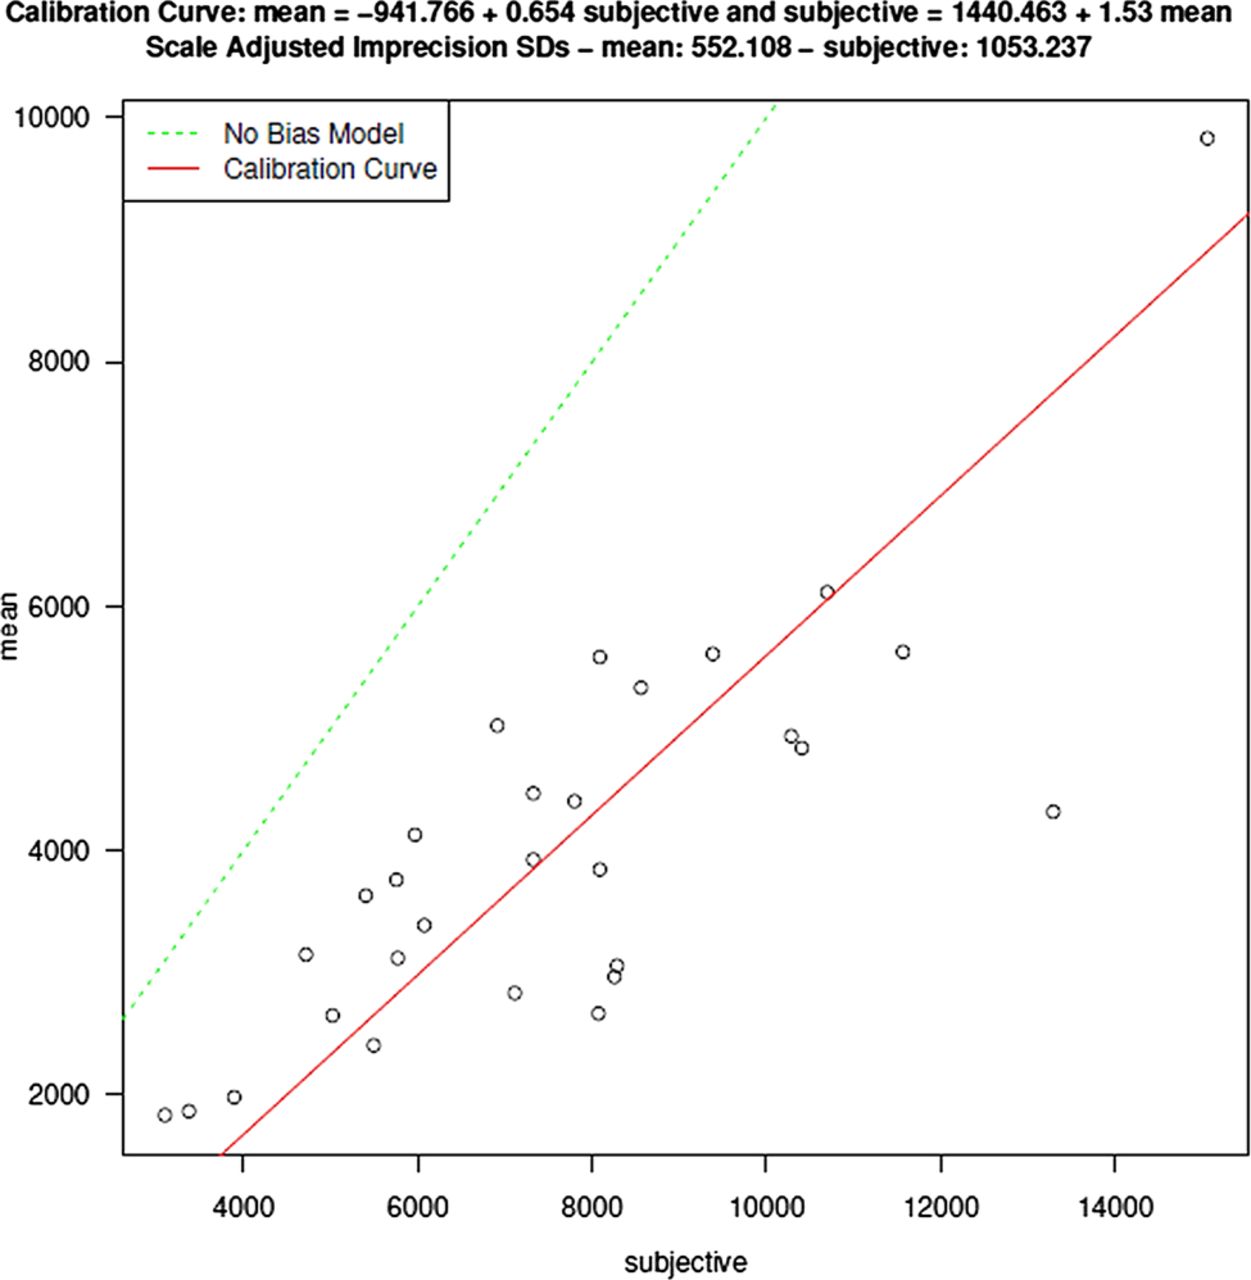
Measurements of Schlemm's canal (SC) cross-sectional area made at a single subjectively identified location are representative of, but larger than, those obtained in a comprehensive assessment of all B-scans within a 1 mm circumferential segment of SC.
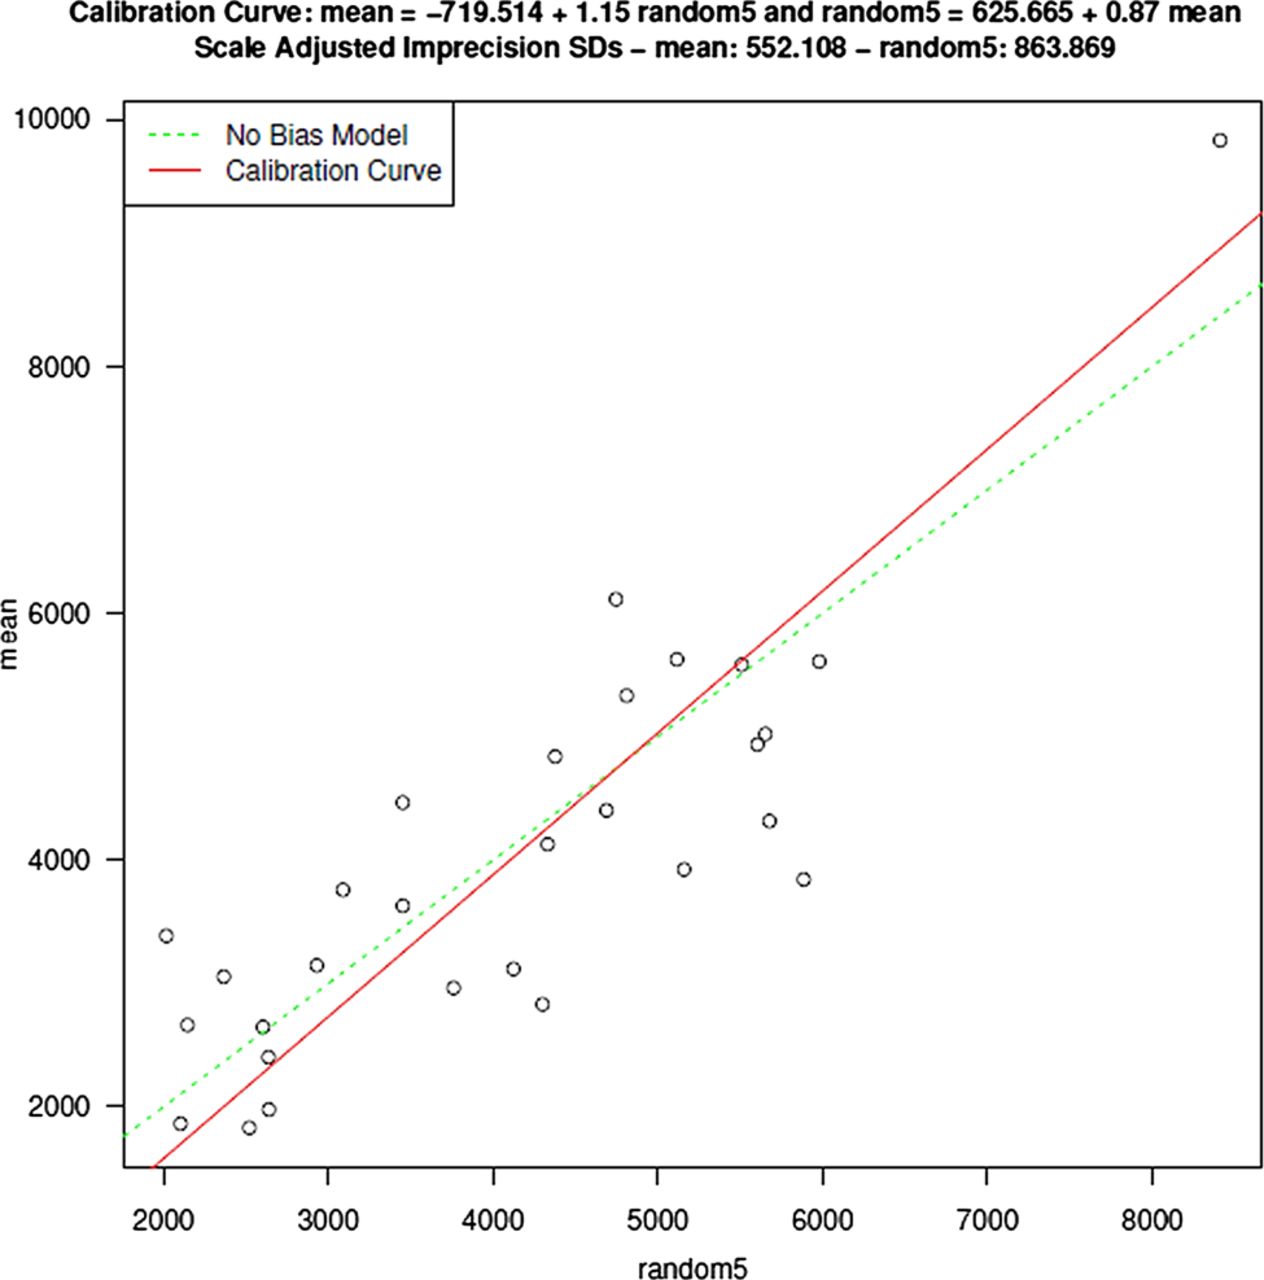
Measurements of Schlemm's canal cross-sectional area made at five randomly selected locations are representative of those obtained in a comprehensive assessment with minimal bias.
Discussion
In this study we compared three approaches with the assessment of SC CSA: an all-encompassing comprehensive analysis of all available scans throughout a region of a volumetric scan, a subjective single slice approach and a random sample approach. We found that subjective and random approaches produce estimates of SC CSA proportional to the gold standard approach of ‘analyse everything’, but a subjective ‘search and measure’ approach tends to overestimate SC CSA compared with comprehensive and random measurements.
Previous studies have used different combinations of these approaches. In our 2010 publication, we were not attempting to provide an overall characterisation of SC, but only to test a clinical observation of SC expansion at the location of collector channel ostia.8 In this instance, the utility of the volumetric scan was not in the supply of sufficient samples for general characterisation, but inclusion of enough tissue within the scan to facilitate identification of a landmark position available within all three scans. Once located, adjacent ‘non-ostium’ sections of SC could be measured and compared. While confirming the hypothesis that SC expands at ostia, the large difference observed suggested that SC CSA might present with large variations in extremely short circumferential distances. The present study approaches the more general problem of characterisation of SC, at least on a regional basis. Herein, the present data suggests that a sample of five random locations provides an estimate of SC CSA similar to that of a comprehensive measurement of all available sequential frames within a region. This is important due to the processing time required for high quality measurements. Image processing times are minimal, requiring approximately 2–3 min to prepare a volume for manual segmentation; however, the actual segmentation of SC can take as much as 1–2 min per frame. A comprehensive analysis of a 1 mm segment might, therefore, require half an hour for a single volume. This represents ∼ 15 h of manual segmentation time for the data set in the present study. Reducing the task to five random samples per volume reduces the overall processing time of the same data set from 15 h to a little over 2.5 h. While sampling provided an accurate general quantification of SC, clinical applicability, such as canaloplasty, may still require a comprehensive description of the distribution of all SC CSAs, especially the percentage of locations at which SC is completely collapsed.
The findings of the present study have important implications in the interpretation of recent publications. Hong et al11 used SD-OCT to compare SC CSA in healthy eyes and those with primary open angle glaucoma in cohorts of Chinese persons. They found that eyes with primary open angle glaucoma have a reduced CSA compared with normal healthy controls, and observed a positive correlation between SC CSA and IOP. The CSAs observed in their study are consistent with those observed at the ostia8 and those observed in subjectively identified frames (present data). This is consistent with the scanning protocol used by Hong et al. They used a single line scan, interrogating the limbus until a clear view of SC was obtained. In this case, it is likely that only the largest viewable regions of SC were measured. The positive correlation in the present data suggest that measurements obtained by a single subjectively identified sample are representative of actual SC CSA, but may overestimate the actual average SC CSA present in the cohort of examined eyes. However, in their study, they used a RTVue OCT device, and it is possible that systematic differences between devices could yield systematic differences in SC CSA measurements.
Day et al measured SC diameter and trabecular meshwork CSA by identifying landmarks denoting its boarders.10 Similar to Hong et al, they used a line scan protocol to acquire limbus imagery. Unlike Hong et al, the Day et al study used the depth of the inner wall of SC, the Schwalbe's line and the location of the scleral spur to identify the borders of the trabecular meshwork. Though SC diameter was not measured in the present study, visualisation of its three-dimensional (3D) morphology suggests that the diameter that would be observed in cross section would vary widely in a fashion similar to CSA.15 Rapidly changing SC CSAs were subjectively observable in the present data (figure 5). Assuming that the same tendency to seek locations of prominent visualisation of SC due to its larger than average local size, it is possible that the estimates of SC diameter are also larger than the average SC CSA within a given region.

Three dimensional visualisation of Schlemm's canal (SC) (Bottom) shows that two nearly adjacent B-scans (blue lines show approximate locations of the B-scans on top) may have radically different cross-sectional areas. The two B-scans (top) are separated along the circumferential direction of SC by a distance of 23 μm only.
Shi et al used a swept-source OCT for the assessment of SC.13 As with the other studies, the authors have used a single line scan to represent SC, yielding an estimation of SC CSA of 7888.38±1472.58 μm2. Their measurements are remarkably close to the 7614±2162 μm2 obtained in the present study when a single subjective location was sought.
There were several limitations in the present study. This study was completed on one SD-OCT device only. Some portions of the structures being studied may be too small to be visualised by the current generation of the SD-OCT device. The 3D reconstructions suggest that the structures visualised in the 2D slices indeed are aqueous outflow vasculature,9 but this does not ensure that the smallest structures were visualised completely. However, a subjective comparison with latex corrosion castings and fluorescent microsphere models suggests that SD-OCT images include sufficient outflow structure to afford their 3D reconstruction the same appearance and completeness as the gold-standard comparisons.18 Another limitation is the possibility that the processing alters the measured size of structures within the images. However, such a systematic alteration of SC size would affect measurements equally, and could not explain the significant difference between subjective and comprehensive analysis observed in the present data. Further, the present study only included normal healthy eyes. SC has been shown to be smaller in eyes with glaucoma.11 It is possible that the findings obtained in a population of larger SC CSAs may not be generalisable to a population of eyes with disease, and associated smaller outflow structures. The distribution of SC sizes in the healthy eyes herein appeared to be skewed to the right, though the mean and median values were nearly identical (unpublished data). It is possible that the distribution of SC CSAs in eyes with glaucoma may be worse, and non-parametric statistics would be required. The analysis used in the present study did not assume a normal distribution, though the potential for skewed data necessitates testing for normality. Finally, the present study only included a limited number of eyes. This data set cannot be used to anticipate or account for variations that may exist between different ethnic and age groups.
In conclusion, SC can be assessed efficiently in a small number of randomly sampled frames. When a measurement location is sought subjectively, the resulting estimate of SC CSA will be approximately twice the actual average CSA. If the purpose of a study is to accurately describe SC CSA, a high density of radial scans facilitating multiple measurements of SC CSA, as provided by a volumetric scan across the region of interest, is required.
References
Footnotes
-
Contributors All authors have contributed substantially to the conception or design of the work; or the acquisition, analysis or interpretation of data for the work. In addition, all authors have contributed to editing and revising, and providing final approval of the version submitted, and will also provide approval of the version to be published. All authors agree to be accountable for all aspects of the work in ensuring that questions related to the accuracy or integrity of any part of the work are appropriately investigated and resolved.
-
Funding This work was supported by NIH R01-EY013178, P30-EY008098, the Eye and Ear Foundation (Pittsburgh, PA), Research to Prevent Blindness, and the American Health Assistance Foundation.
-
Competing interests JSS receives royalties from Zeiss Inc. for intellectual property licensed from MIT.
-
Patient consent Obtained.
-
Ethics approval The institutional review board of the University of Pittsburgh.
-
Provenance and peer review Commissioned; externally peer reviewed.