Article Text

Abstract
The lamina cribrosa (LC) is believed to be the site of injury to retinal ganglion cell axons in glaucoma. The ability to visualise this structure has the potential to help increase our understanding of the disease and be useful in the early detection of glaucoma. While for many years the research on the LC was essentially dependent on histology and modelling, a number of recent advances in optical coherence tomography (OCT) have dramatically improved the ability to visualise the LC, such that it is now possible to image the LC in vivo in humans and animals. In this review, we highlight recent advances in OCT imaging of the LC, in the technology, processing and analysis, and discuss the impact that these will have on the ability to diagnose and monitor glaucoma, as well as to expand our understanding of its pathophysiology. With this manuscript, we aspire to share our excitement on the achievements and potential of recent developments as well as advise caution regarding the challenges that remain before imaging of the LC and optic nerve can be used routinely in clinical practice.
- Glaucoma
- Imaging
- Intraocular Pressure
- Optic Nerve
- Anatomy
This is an Open Access article distributed in accordance with the Creative Commons Attribution Non Commercial (CC BY-NC 3.0) license, which permits others to distribute, remix, adapt, build upon this work non-commercially, and license their derivative works on different terms, provided the original work is properly cited and the use is non-commercial. See: http://creativecommons.org/licenses/by-nc/3.0/
Statistics from Altmetric.com
Introduction
Loss of vision in glaucoma occurs due to damage to retinal ganglion cell axons. This damage is believed to initiate at the level of the lamina cribrosa (LC), a network of connective tissue beams that provide structural and nutritional support to the retinal ganglion cell axons as they traverse the optic nerve head (ONH) to the brain.1 The resulting glaucomatous damage is characterised by distinctive changes in the ONH and patterns of visual field loss. Clinically, the disease is monitored by examining ONH morphology for signs of glaucomatous optic neuropathy, which if untreated will be recognised as a progressive deepening and enlarging of the cup and thinning of the neuroretinal rim.
Although the pathophysiology of the disease is still not completely understood, it is clear that glaucoma is a multifactorial disease with substantial variability in individual susceptibility and speed of progression. Despite decades of study, elevated intraocular pressure (IOP) remains the only modifiable risk factor for slowing the progression of disease, regardless of whether or not the IOP is elevated.2 Hence, to further understand the pathogenesis of glaucoma, improve diagnosis and enable novel means for preventing or treating glaucoma, it is of interest to understand the effects of IOP on the ONH, and in particular the biomechanics of the LC and surrounding sclera.3 Furthermore, it is necessary to understand how these effects vary from one individual to another, as well as how they may change with disease or ageing.
Recent advances in optical coherence tomography (OCT) have made it possible to image in vivo the deep structures of the ONH, and in particular the LC.4–6 OCT has been widely adopted for clinical care to objectively assess small-scale changes in the eye, most commonly for retinal pathology but increasingly for glaucoma diagnosis and monitoring purposes. In glaucoma, OCT-derived structural parameters such as retinal nerve fibre layer (RNFL) and macular ganglion cell complex thicknesses have shown promise for early glaucoma detection and assessing glaucoma progression.7 It is hoped that glaucoma diagnosis and risk management could be improved if additional structural information from the LC could be extracted using the same OCT scans—but this remains an imaging challenge.
The purpose of this review is to highlight recent advances in OCT imaging of the LC, in the technology, processing and analysis, and the impact these will have on our ability for diagnosing and monitoring glaucoma as well as expanding our understanding of its pathophysiology.
Techniques of OCT imaging of the LC
A fundamental challenge in imaging the LC using OCT is that the light signal is attenuated as the beam travels through the tissue. Therefore, it is difficult to obtain good images of structures deep within the ONH or of those behind highly reflective or absorbing tissues. Using conventional spectral domain (SD)-OCT, only a small fraction of the LC is visible during imaging. In particular, peripheral LC or regions posterior to large blood vessels typically remain difficult or out of reach for OCT imaging. Conventional wisdom is that this means typically LC visibility would be worse in healthy subjects who have thick prelaminar tissues, and better in individuals with glaucoma who had suffered loss of prelaminar tissue. Similarly, LC visibility would be worse in humans than in animals with thinner prelaminar tissues or shallower LCs, such as monkeys or pigs. Nevertheless, this remains to be demonstrated. Postprocessing techniques to improve LC visualisation are being developed and are discussed later.
An important consideration when imaging the LC is that longer scans are prone to increased ocular movements, leading to motion artefacts.8 Patients with poor fixation, particularly the elderly, may require faster, lower density scans, resulting in poorer LC visualisation and decreased reproducibility of quantitative measurements. The complexity of the LC architecture and the need to measure minute focal changes to detect disease progression make low scanning resolution especially problematic. Some commercially available OCT instruments incorporate eye tracking technologies (eg, FastTrack from Zeiss or TruTrack from Heidelberg Engineering) to detect eye motion and either discard the data or correct for the motion artefact. Recently, software tools have been developed to correct for small eye motions and oscillation artefacts.9 While promising, it is important to validate these tools to avoid introducing artefacts.
Optimal OCT images of the LC are acquired with a focal plane deeper than that which optimises images of the RNFL. This means that traditional images of the ONH intended for analysis of cup shape and RNFL thickness often produce suboptimal visualisation of the LC. A technique called enhanced depth imaging (EDI) has been developed to improve visualisation of deeper structures, such as the choroid and LC. In EDI, the imaging window is moved closer to the zero-delay, which has superior signal to noise ratio.6 Lee et al5 have used EDI to improve LC reflectivity and contrast compared with conventional SD-OCT. EDI-OCT offers perhaps the best method for visualising the LC using commercial scanners. A disadvantage of this setup is that current commercial scanners do not offer high density isotropic sampling of the LC. Commercial EDI-enabled OCT systems often use averaging of multiple frames in order to see the deep tissue. To keep imaging times reasonable, commercial scanners typically use radial patterns or have wide distance between B-scans.
An interesting recent development has been polarisation sensitive OCT, where intrinsic tissue properties such as phase retardation can be measured and visualised in conjunction with the structure. This technology has been used to image the LC and sclera in vivo, providing contrast to the structures not always visible in the intensity images.10
A recently developed technology used for LC in vivo imaging is swept source OCT (SS-OCT). SS-OCT offers reduced sensitivity roll-off versus depth compared with SD-OCT (figure 1A, B). Because SS-OCT does not require averaging of multiple B-scans to visualise the deep tissues, it allows 3D raster scanning with excellent sampling density, enabling clearer observation of the 3D structure of the optic disc (figure 1C). Although isotropic sampling improves visualisation and simplifies postprocessing, it is not an absolute requirement if the interest is on the ONH macroarchitecture, such as the general LC shape, and several important studies have been conducted using anisotropic scanning patterns. For example, anisotropic sampling was used to show a nasal-temporal ridge in the anterior LC.11

Swept source optical coherence tomography (SS-OCT) for assessing the lamina cribrosa (LC) defects. (A) Colour disc photograph shows orientations of the SS-OCT scan. (B) B-scan image averaging multi-scan frames at green line in (A), with the anterior (red dots) and posterior border (green dots) of the LC delineated. The LC pores are also visualised as hyporeflective lines in LC. (C) The SS-OCT C-mode image reconstructed from raster scan. The laminar pores are visualised as hyporeflective spots on the en face image. The LC defects are shown by green arrowheads as hyporeflective lesions. (D) The SS-OCT sectioned volume image oriented by white line in (A). The LC defects are shown by green arrowheads as a hyporeflective line, which shows full-thickness loss of the lamina reflectivity on B-scan image.
Another important recent advance has been the integration of adaptive optics (AO) into OCT (AO-OCT). AO-OCT corrects ocular aberrations, permitting improved transverse resolution, from 20 to 5 μm.12 This enables high quality images of the posterior pole and visualisation of the LC trabecular structure (figure 2A). Technologies currently in development include 1-micron resolution (axial and lateral) micro-OCT13 and ultrahigh resolution OCT.14 The impact of these on ophthalmic imaging remains to be elucidated.

Adaptive optics optical coherence tomography (AO-OCT) for assessing lamina cribrosa (LC) microarchitecture. (A) C-mode section at the level of the LC through an AO-OCT scan of a glaucomatous eye acquired in vivo. (B) The beams (cyan) and pores (green) were identified using a semiautomated segmentation technique. (C) 3D structural view of LC beams; (D) 3D LC beam thickness was then measured at every voxel, where hotter colours represent thicker beams. Adapted with permission from Nadler et al.37
LC changes during IOP variations
A major area of interest has been in assessing the dynamic reaction of the LC to IOP changes (figure 3). Analysing single B-scans through the ONH, Agoumi and colleagues measured compression of prelaminar tissue, without any changes in LC position (on average) following acute IOP elevation, produced using ophthalmodynamometry.15 The effects of acute increases in IOP on animal ONHs have also been studied using OCT imaging. In normal rhesus monkeys, increases in IOP produced significant posterior displacement of the anterior LC surface in some monkeys, but not in others.16 Numerical models of humans17 and monkeys18 suggest that whether their LC displaces or not following an acute change in IOP is largely determined by the biomechanical properties and anatomy of both the LC and sclera. Thus, the range of biomechanical effects of IOP on the LC over a population is due to the variability in LC and sclera properties and their complex interactions.19 Note that even without anterior–posterior LC movement, an acute change in IOP may still cause substantial lateral displacements, forces (stresses) and deformations (strains) within the LC.20 Combined experimental and numerical techniques to measure IOP-induced displacements and deformations of the LC are currently being developed and may shed further light on the biomechanical behaviour of the eye.21 ,22

Effects of intraocular pressure (IOP) increase on non-human primates. (A and B) The acute effects of (A) 10 mm Hg (top) and (B) 45 mm Hg (bottom) IOP on spectral domain optical coherence tomography (SD-OCT) B-scans of a normal monkey eye. Bruch's membrane (red dots) and the anterior lamina cribrosa (LC) surface (green dots) have been delineated. The area enclosed by the anterior surface of the LC and a plane defined at Bruch's membrane opening (area shaded green) is larger in the scan at 45 mm Hg. There was no detectable lateral expansion of the scleral canal at Bruch's membrane opening (vertical green lines). Using a second reference plane parallel to BM opening (dashed red lines), it is also visible that the BM is outwardly bowed at high IOP, which suggests that there is IOP-induced posterior deformation of the peripapillary sclera. While choroidal compression may contribute to this finding, we believe that the behaviour of BM is principally related to the behaviour of the sclera. (C) The chronic effects of IOP elevation on the morphology and position of the internal limiting membrane and anterior surface of the LC are compared in an early glaucoma monkey eye. (D) Anterior LC surface and neural canal opening at baseline (green), follow-up 1 (yellow) and follow-up 2 (red). Delineations were made on images acquired with SD-OCT. Adapted with permission from Sigal et al46 and Strouthidis et al.27
There is also considerable interest in measuring the effects on the LC of IOP-reducing surgery. Both Reis and colleagues and Lee et al found significant anterior lamina displacement following a decrease in IOP through trabeculectomy at 1 week postsurgery.23 ,24 It is well known that a reversal of optic disc cupping often occurs after successful glaucoma surgery in children, but is rarely observed in adults.25 EDI-OCT has revealed the reversal of the position of LC following IOP reduction, which suggests that the reversal of the optic disc cupping may result from the anterior movement of LC.26 Although the extent of reversal of LC position certainly reflects the amount of IOP lowering, it has not been elucidated whether detection of this phenomenon is clinically useful. The biomechanical paradigm of glaucoma proposes that LC reversal may represent a relief of potential pathological strain and stress levels, reducing biomechanical insult on the astrocytes, load bearing structures and vascular system.
SD-OCT imaging of monkeys has also been used to study the effects of unilateral chronic IOP elevation (figure 3C, D). The results demonstrate that it is possible to detect longitudinal structural changes in the anterior laminar surface and prelaminar tissues using SD-OCT imaging in an experimental model of glaucoma.27 These changes included posterior displacement of the anterior surface of the LC and of Bruch's membrane opening, as well as thinning of the prelaminar tissues and a decrease of the minimum neuroretinal rim width. Interestingly, all of these changes occurred prior to the detection of peripapillary nerve fibre layer thinning, whether detected by SD-OCT, scanning laser polarimetry or multifocal electro-retinogram.28 This suggests that LC imaging might be useful for detecting structural change prior to visual field damage in glaucoma.
In animals, IOP levels can be better controlled and sustained than on patients. A sustained increase in IOP offers certain advantages in assessing the biomechanical response of an eye compared with acute IOP elevation since the effects of acute increases in IOP are not instantaneous. Due to tissue properties, including viscoelasticity and fluid shifts within the eye, the mechanical response of the eye changes over time.29 This time-dependent biomechanical behaviour of the eye may aid in protecting the delicate structures of the eye, such as the nerves passing through the LC, from transient forces and increases in IOP, such as from ocular pulse or rubbing our eyes. The role of viscoelasticity on long-term disease is also unknown, but the ability to measure IOP-induced deformations on the LC is a necessary first step.
LC microarchitecture and defects
Several studies using OCT to image the LC have described focal LC defects, identified using both EDI-enabled SD-OCT30 ,31 and SS-OCT.32 The definition of a defect, however, is yet to be established, as these are sometimes described as laminar holes or disinsertions,31 laminar surface irregularities30 or as pits or cavities in the LC.32 The SD-OCT studies have reported that LC defects are associated with local glaucomatous optic disc changes such as neuroretinal rim thinning/notching or acquired pits of the optic nerve30 ,31 as well as disc haemorrhages.33 SS-OCT studies have revealed that LC defects are sometimes associated with disc haemorrhages and longer axial length.34 However, it should be noted that careful interpretation must be applied for the detection of the LC defects because of the potential for artefacts due to vascular shadowing. These shadow artefacts lead to LC defect-like artefacts even when using SS-OCT (figure 1C,D). Further investigations are needed to determine when LC defects occur and their association with glaucomatous optic neuropathy, and whether the regions of the lamina that can be visualised consistently are sufficient to be representative of the LC as a whole.
Recently, 3D microarchitecture has started to be reported using SS-OCT,35 ,36 AO-OCT35 ,37 and AO-SLO.38 Microarchitectural analysis has generally aimed to identify changes in LC beam and pore structure associated with the development or progression of glaucoma. The studies using AO-SLO primarily used manual delineation of individual LC structure, whereas the SS-OCT and AO-OCT studies demonstrated a semi-automated segmentation analysis capable of segmenting and analysing individual LC beams and pores (figure 2B–D).35 The quantitative assessment of the LC beams and pores in vivo may provide important mechanistic insights into the pathogenesis of glaucoma. For example, a study using SS-OCT reported significant in vivo changes in LC microarchitecture of glaucoma subjects, such as a reduction in pore size and increased pore variability, which may be a cause or a result of axonal loss and beam remodelling.39 The potential clinical significance of such findings has been discussed elsewhere.1–3 ,40
Improving visualisation of the LC
Addressing the challenge of signal penetration and the need for improved visualisation of the LC and deep structures of the ONH, Girard, Mari and colleagues proposed postprocessing algorithms to enhance the contrast of OCT signals by compensating for light attenuation.41 ,42 They have demonstrated that these algorithms can help reduce shadowing from blood vessels and peripapillary structures, and increase confidence in identifying the LC region (figure 4), although the gains vary from one patient to another.42 Improved visualisation of the LC would allow extending the studies of the LC to larger populations and eliminate the bias that may arise with restricting analyses to cases with more easily visualised LC.

Adaptive compensation for lamina cribrosa (LC) imaging. Baseline optical coherence tomography (OCT) images of two healthy patients and their enhanced versions using adaptive compensation to correct the effects of light attenuation. In the baseline images, arrows indicate poor visibility of the LC (red) and of the peripapillary sclera (blue). Adaptive compensation, when applied as a postprocessing treatment, allows recovery of the LC and peripapillary sclera even in cases where OCT signal is barely visible in the original images (left). Note that for the left image, the entire LC cannot be recovered. Adapted with permission from Mari et al.42
Limitations of OCT imaging the LC
Important challenges remain to the use of OCT imaging for the study of the LC and optic nerve. First, the resolution and contrast of OCT images is still inferior to that of other optical techniques such as histology or second harmonic generated imaging.43 While neither of these can be used to study the LC in vivo, they have proven important research tools. Second, OCT is not consistently capable of imaging the whole LC.
Several recent papers have reported SD-OCT defined LC thickness measurements, most notably observing a relationship between reduced LC thickness and reduced visual field mean deviation44 and reduced LC thickness and the presence of pseudoexfoliative glaucoma as compared with non-pseudoexfoliative glaucoma eyes with the same level of IOP and glaucoma damage.45 While the results of these studies are compelling (despite low numbers of subject eyes) and ‘fit’ with preconceptions regarding LC morphometry in glaucoma, one must not, however, underplay the fact that the LC is a complex 3D structure, likely under-represented by the single thickness measurements considered in these studies. Furthermore, the detection of the posterior surface of the lamina, even with EDI and compensation algorithms, is highly variable with many experts struggling to identify the posterior LC surface in some images. Often, large regions of the LC remain difficult to visualise. The detection of the posterior surface of the LC in OCT images must still be verified by comparison with histology, in both human and monkey eyes. There is a risk that the proliferation of articles on this topic may prematurely push laminar thickness measurements into clinical practice. It is perhaps preferable to wait until LC thickness measurements can be obtained consistently and it is better understood what these represent of the actual structures. Most importantly, it is necessary to understand how OCT defined measurements of LC thickness relate to visual function in glaucoma.
Future of LC analysis
A promising technique for analysing images of the LC involves the use of tracking to identify the short-term deformations (strains) and long-term remodelling caused by acute and chronic IOP changes (figure 5). These methods are currently being developed and demonstrated for both OCT21 and second harmonic generated imaging.22 Application of these methods may shed further light on the biomechanical behaviour of the eye; for example, by helping identify regions of structural weakness that may predispose to disease, or in assessment of techniques aiming to reinforce an eye to reduce sensitivity to IOP. These techniques, combined with improved signal penetration and robustness to eye movement, will enable longitudinal analysis for risk stratification and improved management of glaucoma.

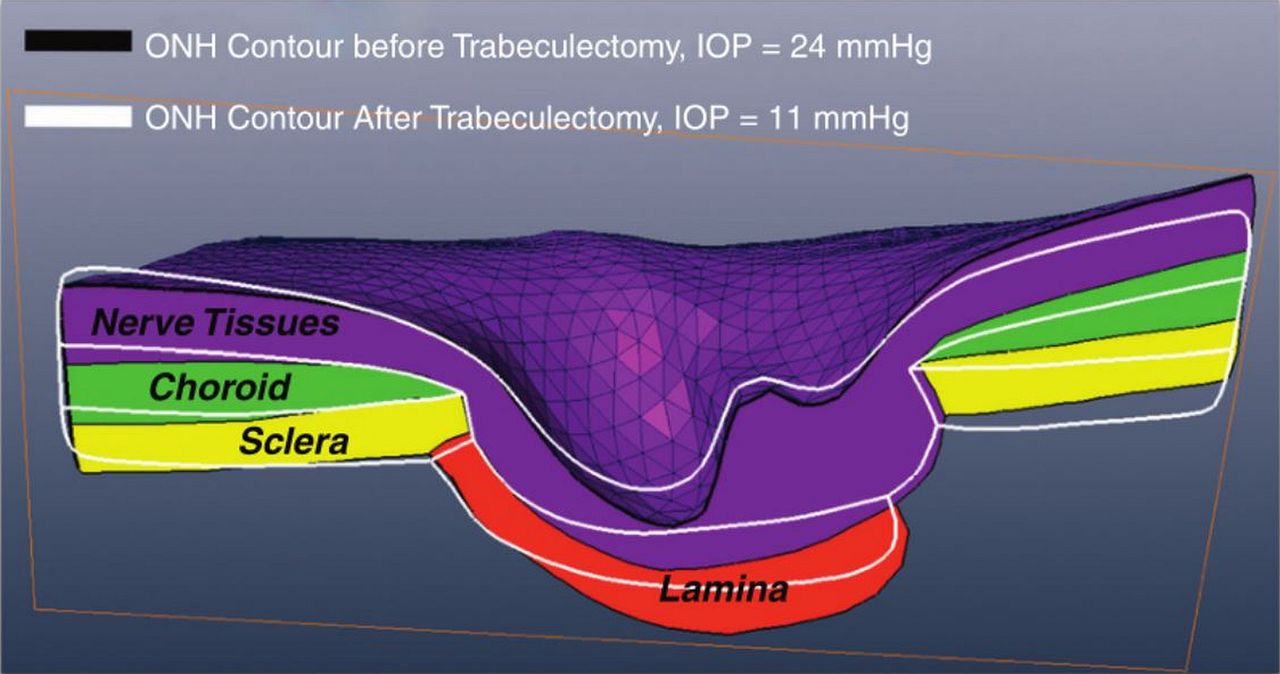
3D deformation tracking. Results from tracking analysis to determine the 3D displacement in response to the change in intraocular pressure (IOP) caused by IOP-lowering trabeculectomy in a glaucoma subject. Adapted with permission from Girard et al.47
Conclusions
Further studies are needed to understand the effects of IOP on the LC and the optic nerve, and the roles these play in the pathophysiology of glaucoma. Nevertheless, recent advances in OCT imaging have dramatically improved the ability to visualise the LC. While for many years the research on the LC was essentially dependent on histology and ex vivo modelling, developments in OCT imaging have enabled in vivo visualisation. These are exciting times for imaging and analysis of the LC, with many promising avenues that can potentially improve the diagnosis, risk profiling and perhaps treatment of glaucoma and other diseases of the ONH.
References
Footnotes
-
Contributors All authors were involved in the preparation of the manuscript.
-
Competing interests NGS: lecture and author fees for Heidelberg Engineering, MSD pharmaceuticals and Allergan Inc. IAS: Supported in part by National Institutes of Health Grants R01-EY023966 and P30-EY008098; Eye and Ear Foundation (Pittsburgh, Pennsylvania); and unrestricted grants from Research to Prevent Blindness (New York, New York). BW: Supported in part by National Institute of Health Grants R01-EY013178 and T32-GM008208. NGS: acknowledges a proportion of his financial support from the Department of Health through the award made by the National Institute for Health Research to Moorfields Eye Hospital NHS Foundation Trust and UCL Institute of Ophthalmology for a Biomedical Research Centre for Ophthalmology. The views expressed in this publication are those of the authors and not necessarily those of the Department of Health. TA: Supported in part by a Grant-in-Aid for Scientific Research (25462713) from the Japan Society for the Promotion of Science (JSPS). MJAG: Singapore Ministry of Education, Academic Research Funds, Tier 1 and a NUS Young Investigator Award (NUSYIA_FY13_P03, R-397-000-174-133).
-
Provenance and peer review Commissioned; externally peer reviewed.