Article Text

Abstract
Objective To determine the diagnostic accuracy of telemedicine in various clinical levels of diabetic retinopathy (DR) and diabetic macular oedema (DME).
Methods PubMed, EMBASE and Cochrane databases were searched for telemedicine and DR. The methodological quality of included studies was evaluated using the Quality Assessment for Diagnostic Accuracy Studies (QUADAS-2). Measures of sensitivity, specificity and other variables were pooled using a random effects model. Summary receiver operating characteristic curves were used to estimate overall test performance. Meta-regression and subgroup analyses were used to identify sources of heterogeneity. Publication bias was evaluated using Stata V.12.0.
Results Twenty articles involving 1960 participants were included. Pooled sensitivity of telemedicine exceeded 80% in detecting the absence of DR, low- or high-risk proliferative diabetic retinopathy (PDR), it exceeded 70% in detecting mild or moderate non-proliferative diabetic retinopathy (NPDR), DME and clinically significant macular oedema (CSME) and was 53% (95% CI 45% to 62%) in detecting severe NPDR. Pooled specificity of telemedicine exceeded 90%, except in the detection of mild NPDR which reached 89% (95% CI 88% to 91%). Diagnostic accuracy was higher with digital images obtained through mydriasis than through non-mydriasis, and was highest when a wide angle (100–200°) was used compared with a narrower angle (45–60°, 30° or 35°) in detecting the absence of DR and the presence of mild NPDR. No potential publication bias was detected.
Conclusions The diagnostic accuracy of telemedicine using digital imaging in DR is overall high. It can be used widely for DR screening. Telemedicine based on the digital imaging technique that combines mydriasis with a wide angle field (100–200°) is the best choice in detecting the absence of DR and the presence of mild NPDR.
- Diagnostic tests/Investigation
- Telemedicine
- Retina
This is an Open Access article distributed in accordance with the Creative Commons Attribution Non Commercial (CC BY-NC 4.0) license, which permits others to distribute, remix, adapt, build upon this work non-commercially, and license their derivative works on different terms, provided the original work is properly cited and the use is non-commercial. See: http://creativecommons.org/licenses/by-nc/4.0/
Statistics from Altmetric.com
Introduction
In 2013, 382 million people across the globe had diabetes mellitus. If no action is taken, that number will rise to 592 million by 2035.1 Diabetic retinopathy (DR) is the most frequently occurring complication of diabetes and one of the major causes of acquired blindness in the working-age population around the world.2 The WHO has estimated that DR accounts for approximately 15–17% of all cases of total blindness in the USA and Europe, and 7% of all cases in China and Mongolia.3 A pooled analysis of 35 studies showed that the overall prevalence of DR of any severity is 34.6%, and that the prevalence of the sight-threatening stages typified by proliferative diabetic retinopathy (PDR) and diabetic macular oedema (DME) is 6.96% and 6.81%, respectively.4 The task of detecting and evaluating patients for the presence and severity of DR and DME is enormous and urgent, because early detection of DR and timely treatment can reduce the risk of visual impairment.
DR can be detected using various methods. Conventionally, it is found by an ophthalmologist examining the fundus using either an indirect ophthalmoscope or a slit-lamp biomicroscope following pupillary dilation. Alternatively, photographs of the fundus may be taken through a dilated pupil and subsequently examined by an ophthalmologist. The gold standard for DR detection is the Early Treatment Diabetic Retinopathy Study (ETDRS) using 30°, seven standard field stereoscopic 35 mm colour slides (7F-ETDRS) or fundus fluorescein angiography (FFA) taken by a skilled photographer and assessed by skilled readers.5–7 The 7F-ETDRS is time consuming and expensive and leads to poor compliance,8 which makes it impractical for routine clinical use; the potential adverse effects associated with FFA9 make FFA impractical for use as a screening tool. Telemedicine based on digital photographs of the fundus that have been compressed (or not), stored and forwarded to a distant ophthalmologist electronically for analysis is being used with increasing frequency to detect DR, and especially for DR screening.
In a previous review, Vaziri et al10 evaluated the validity and feasibility of telemedicine for the diagnosis of DR using a statistical agreement value (κ statistics) as an indicator. The aim of this review is to assess the diagnostic accuracy of telemedicine in the full range of DR and DME severity compared with the current gold standard.
Methods
Search strategy and selection criteria
We searched PubMed, Embase and Cochrane databases for relevant citations in April 2013 and updated the search in February 2014. There was no time and language restriction. We used a combination of medical subject headings and text terms to generate two subsets of citations: one for DR or macular oedema, based on a search using such terms as ‘diabetic retinopathy’, ‘macular edema’ and ‘diabetic maculopathy’, and the other for telemedicine based on a search using such terms as ‘telemedicine’, ‘remote consultation’, ‘telehealth’, ‘tele’, ‘ehealth’, ‘mobile health’, ‘teleophthalmology’, ‘telescreening’, ‘telecommunication’, ‘teleretinal’, ‘internet’, ‘web’, ‘online’, ‘digital imaging’, ‘retinal imaging’, ‘grading and ETDRS’ and ‘screening and ETDRS’. We combined the terms to generate a subset of citations relevant to our research question. We also examined the reference lists in all known primary and review articles to identify additional studies that were not captured by the electronic searches.
We included studies if they met the following criteria: (1) recruited subjects with either type 1 or type 2 diabetes; (2) compared telemedicine with 7F-ETDRS for DR or DME detection; and (3) provided sufficient data to calculate the diagnostic accuracy of the technique used. Studies in which telemedicine was compared with other methods of DR detection were excluded, as were studies with no description of its subjects.
Two reviewers (LS and HW) examined the electronic searches independently and obtained a full report of each citation that was likely to meet the predefined selection criteria. Disagreements were resolved by consensus and after discussion with a third reviewer (JD).
Quality assessment and data extraction
The quality of the included studies was assessed using the Quality Assessment for Diagnostic Accuracy Studies (QUADAS-2)11 and RevMan 5.2. QUADAS is designed to evaluate the quality and validity of the studies by assessing their potential bias and applicability in patient selection, as an index test, the reference standard used and in terms of flow and timing. We considered a study to be of good quality if it was based on prospective consecutive recruitment; it included an adequate description of the study population, the index test and the reference standard; it provided full verification of the index test using a reference standard; the index test and the reference standard were evaluated and interpreted independently; and more than 90% of the subjects were included in the final analysis.
Two reviewers (LS and HW) extracted information about the study characteristics and assessed the quality of the included studies independently. Disagreements were resolved by consensus and after discussion with a third reviewer (JD).
Data analysis
Two reviewers (LS and HW) independently extracted the raw data regarding the true and false positives and true and false negatives of each included study. Study authors were contacted if the raw data could not be extracted or calculated. The statistical analysis was performed using Meta-Disc v1.4 software.12 We computed the measures of test accuracy for each included study (ie, sensitivity, specificity, positive likelihood ratio (PLR), negative likelihood ratio (NLR) and diagnostic OR (DOR) with corresponding 95% CI).
Heterogeneity induced by the threshold effect in the included studies was assessed by calculating the Spearman correlation coefficient and p value between the logit of sensitivity and logit of 1–specificity. Heterogeneity induced by non-threshold effects was assessed using a χ2 test and quantified by I2. In general, I2 >50% (p<0.05) indicates that heterogeneity among the included studies could have an impact on outcomes.13 If the heterogeneity was found to be significant, we pooled the measures of test accuracy using the random effects model. In addition, the estimate of the summary receiver operating characteristics (SROC) curve was used to describe the relationship between test sensitivity and specificity across the included studies. Q* values, defined by the point at which sensitivity equalled specificity, were calculated based on the SROC curve. The area under the SROC curve (AUC) was calculated to show the probability of the correctly ranked diagnostic test values for a random pair of subjects (one with disease and one without disease). Potential heterogeneity factors were analysed using meta-regression. Subgroup analyses were carried out to identify the test-related factors or other factors responsible for heterogeneity in test accuracy. Statistical significance was defined by a p value of <0.05.
Publication bias was determined using the Deeks test.14 Stata V.12.0 software was used to explore the potential publication bias in this review.
Results
The literature search yielded 720 references. Figure 1 presents a flowchart of the study selection process including reasons for study exclusion. Twenty studies with a total of 1960 participants were included, 19 in English and one in German.

Flow chart of study selection.
Summary characteristics of included studies
Both men and women were recruited for each study. With the exception of a study by Hubbard et al15 which only recruited subjects with type 1 diabetes, the recruited subjects had either type 1 or type 2 diabetes. Some of the studies described how digital images were transferred. In one study they were transferred telemetrically,16 in others via network,17 ,18 and in another study they were uploaded to a secure web server.19 The remaining studies did not include a description of the method of transmission.
In the study by Hanse et al,20 digital imaging was carried out with mydriasis in 83 participants at the Department of Ophthalmology; an additional 59 subjects (who were demographically not statistically significantly different from the others) underwent digital imaging without mydriasis at an optician's shop. Li et al21–25 conducted a series of studies to evaluate multiple digital photography versus 7F-ETDRS. One of these studies was designed specifically to evaluate the use of digital imaging in DME.21 A description of the included studies is presented in table 1.
Characteristics of the included studies
Quality of included studies
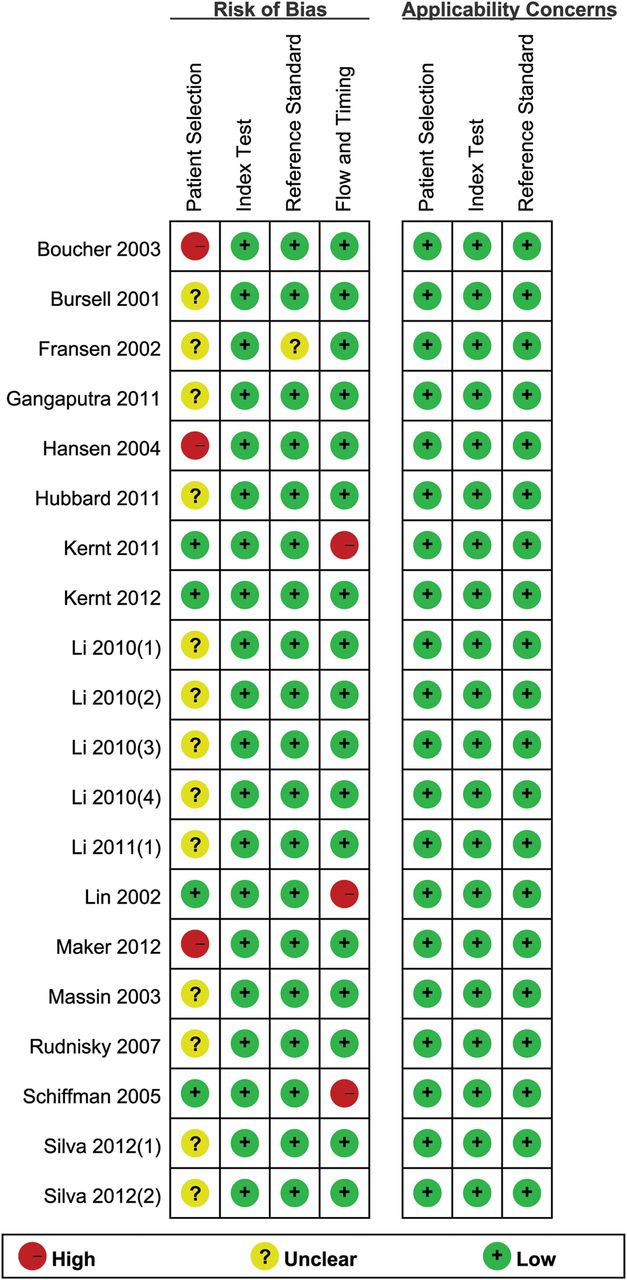
The methodological quality of the included studies is summarised in online supplementary table S1 and shown in figure 2. The overall quality of the included studies was high. The subject selection method may have introduced high bias in two studies in which recruitment was weighted towards patients with less severe retinopathy,20 ,26 and in a third study in which it was weighted towards patients with more severe retinopathy.27 Inclusion and exclusion criteria were clearly defined in all studies and no inappropriate exclusions were noted. The method used to obtain digital images of the fundus to transmit for telemedicine were described well enough to allow the reviewer to answer the review question in all included studies. The number of subjects not included in the analysis and the reasons for their exclusion are listed in the notes in online supplementary table S1.

Results of the Quality Assessment for Diagnostic Accuracy Studies (QUADAS)-2 evaluation of each study.
Heterogeneity and threshold effect analysis
The Spearman correlation coefficient and p value for various clinical levels of DR and DME (listed in online supplementary table S2) indicate that heterogeneity was not due to a threshold effect.
Accuracy of telemedicine in detecting DR
Among the 20 included studies, four studies (all conducted by Li and colleagues) used the same subjects.22–24 ,28 For this reason, only one of these studies was included in the meta-analysis,23 giving a total of 17. In seven studies15–19 ,23 ,29 the photographs were graded by ETDRS levels (levels 10, 14, 15, 20……). In 10 studies20 ,26 ,27 ,30–36 the ETDRS levels were converted to the analogous clinical scale: absence of DR (or no DR): levels 10 and 14; mild non-proliferative diabetic retinopathy (NPDR): levels 15, 20 and 35; moderate NPDR: levels 43 and 47; severe NPDR: level 53; low-risk PDR: levels 60, 61 and 65; and high-risk PDR: levels 71, 75 and 80.37 We used an analogous clinical scale for data analysis; however, not all of the included studies covered the full range of severity for DR and DME.
Figure 3 shows the sensitivity and specificity of each study and the pooled estimates when telemedicine was used to determine various clinical levels of DR and DME. The pooled sensitivity exceeded 70%, except in telemedicine detection of severe NPDR in which it was 53% (95% CI 45% to 62%). The pooled specificity exceeded 90%, except in telemedicine detection of mild NPDR in which it was 89% (95% CI 88% to 91%). Most of the I2 in sensitivity and specificity forest plots exceeded 50% with p<0.05, which suggests the existence of significant heterogeneity among the included studies.
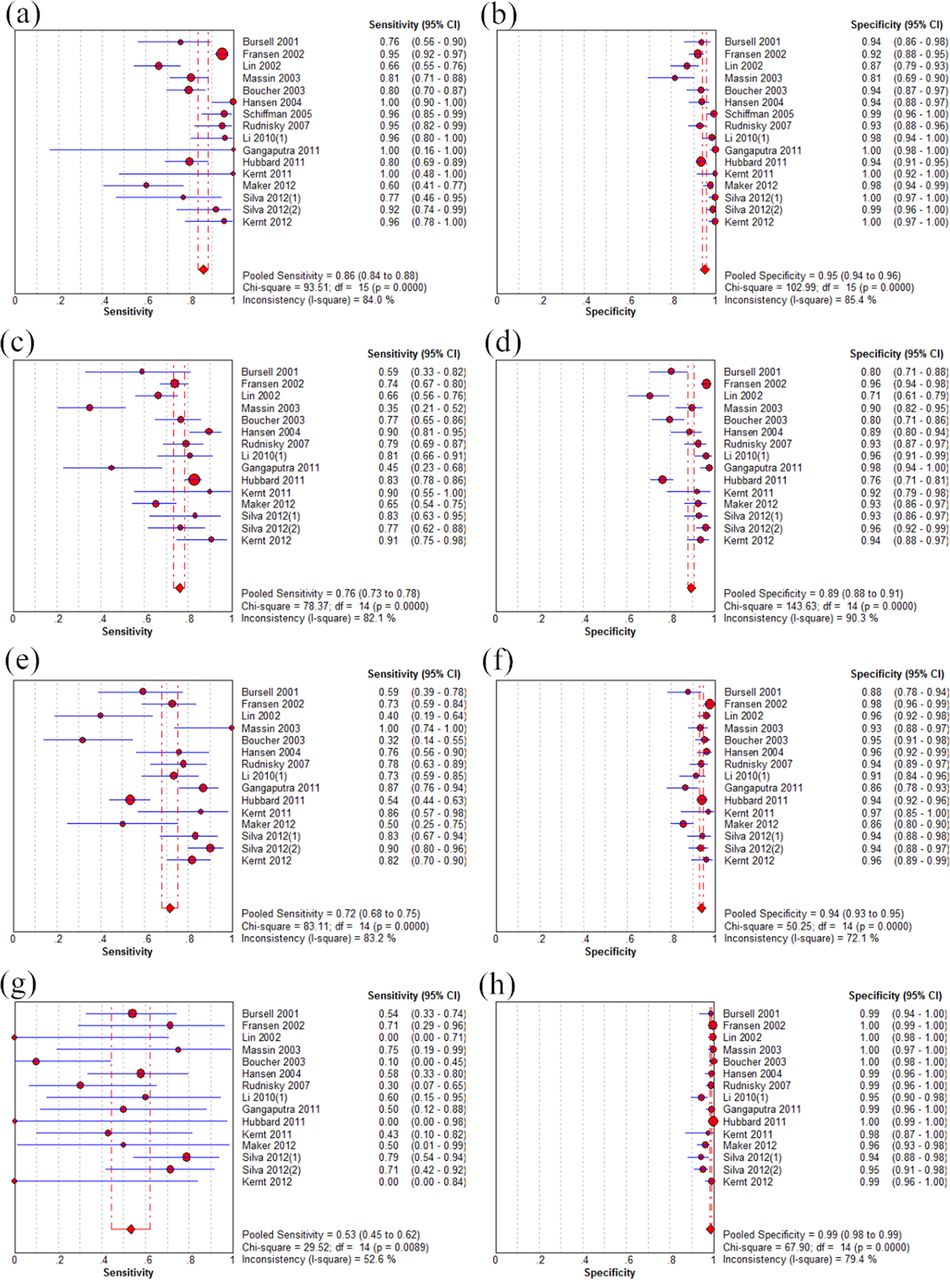

Forest plots of sensitivity and specificity in telemedicine detection of the absence of DR (A, B), mild NPDR (C, D), moderate NPDR (E, F), severe NPDR (G, H), low-risk PDR (I, J), high-risk PDR (K, L), DME (M, N) and CSME (O, P). DR, diabetic retinopathy; NPDR, non-proliferative diabetic retinopathy; PDR, proliferative diabetic retinopathy; DME, diabetic macular oedema; CSME, clinically significant macular oedema.
The corresponding SROC curves (figure 4) showed AUC >0.9 in the detection of the full range of severity of DR and DME and pooled diagnostic accuracy (Q*) ≥0.9 or close to 0.9 except in telemedicine detecting mild NPDR (Q*=0.8389, SE=0.0313). These findings indicate an overall high degree of accuracy for telemedicine in the detection of DR.

Summary receiver operating characteristic (SROC) curves of various clinical levels of DR and DME: (A) absence of DR; (B) mild NPDR; (C) moderate NPDR; (D) severe NPDR; (E) low-risk PDR; (F) high-risk PDR; (G) DME; and (H) CSME. AUC, area under the curve; DR, diabetic retinopathy; DME, diabetic macular oedema; PDR, proliferative diabetic retinopathy; NPDR, non-proliferative diabetic retinopathy; CSME, clinically significant macular oedema.
Meta-regression analysis
We attempted to explore the sources of heterogeneity across the included studies using meta-regression analysis with several demographic covariates including mean age, duration of diabetes, subjects recruited (consecutive or otherwise), and digital imaging techniques including mydriasis versus non-mydriasis, observation angle, stereoscopy versus non-stereoscopy, number of fields, use of colour versus monochromatic techniques, image resolution and image compression versus non-compression. We found no evidence that any of these factors corresponded with heterogeneity.
Subgroup analyses
We carried out four subgroup analyses of the accuracy of digital image-based telemedicine in the detection of DR and DME based on the use of mydriasis versus non-mydriasis, the observation angle, stereoscopic versus non-stereoscopic techniques and compression versus non-compression. The results indicate that telemedicine using mydriasis had higher sensitivity and specificity, PLR, NLR and DOR than telemedicine without mydriasis in detecting the absence of DR and the presence of mild NPDR. We also found that an observation angle of 100–200° provided the greatest diagnostic accuracy, followed by an observation angle of 30° or 35°, 45–60° (tables 2 and 3).
Subgroup analysis of mydriasis versus non-mydriasis in telemedicine detection of absence of DR and mild NPDR
Subgroup analysis of observation angle in telemedicine detection of absence of DR and mild NPDR
We divided 10 of the included studies into four subgroups according to the digital imaging technique (see online supplementary table S3). In two studies20 ,35 using non-mydriatic, 5-field, 45° angle, non-stereoscopic, colour, non-compressed techniques, heterogeneity in telemedicine detection of severe NPDR was greatly reduced. In three studies17–18 ,32 using non-mydriatic, single-field, 100–200° angle, non-stereoscopic, colour, non-compressed techniques, heterogeneity in telemedicine detection of the absence of DR, mild NPDR and moderate NPDR was greatly reduced. The other two subgroup analyses, which evaluated the use of mydriatic, 7-field, 30°, stereoscopic, colour digital imaging technique in which compressed images were used in one subgroup15 ,24 and non-compressed images in another,23 ,26 ,29 revealed the existence of unexplained heterogeneity.
Publication bias
We used the raw data generated in studies of various clinical levels of DR and DME to detect publication bias. As shown in online supplementary figure S1, these studies did not demonstrate statistical significance for telemedicine in the use of DR detection (p>0.05). The results indicated no potential publication bias.
Discussion
Telemedicine is the transfer of digital photographs of the retina to a reading centre where they can be evaluated by an ophthalmologist. It allows clinicians to detect DR in a non-ophthalmological setting and thus allows them to serve patients in rural, remote and hard-to-reach locations. Previous literature reviews and studies have indicated that telemedicine is a cost-effective means of screening patients for DR and can alleviate some of the burden of DR.38 Patients have expressed a high degree of satisfaction with the telemedicine examination.39
All of the included studies except the study by Lin et al16 were based on the number of eyes rather than the number of patients. We believe that ‘eye count’ versus ‘person count’ had little relationship with the results, so we included both in the meta-analysis. The overall high accuracy of telemedicine in detecting DR suggests that it is valuable for this purpose. When telemedicine was used to detect the absence of DR and mild NPDR, the diagnostic accuracy was higher when the images were acquired through mydriasis than through non-mydriasis and a wide angle (100–200°) of observation rather than a narrower angle (45–60° or the more commonly used 30°or 35°).
Sensitivity varied widely among primary studies, falling as low as zero (see figure 3). A potential explanation for this variability might be the small sample size and ungradable digital images. A previous meta-analysis was limited to the detection of the presence or absence of DR.40 In this review we analysed the full range of severity of DR and DME. It would have been ideal to use the entire sample size. When the total population was assigned to different clinical levels of DR, however, the sample sizes became quite small. In the study by Hubbard et al,15 of the total of 628 eyes, the 7F-ETDRS detected severe NPDR in one eye that was not detected by telemedicine; this resulted in a sensitivity of zero. Compared with 7F-ETDRS, digital imaging was more likely to result in images that could not be graded. The ungradable slides were excluded, but the ungradable digital images were included in the analysis.16 ,29 This reduced the sensitivity of telemedicine.
When telemedicine was used to detect the absence of DR, a positive number represented the absence of DR and a negative number represented any clinical level of DR within a 2×2 (true positive vs false positive and false negative vs true negative) array. We were also able to calculate sensitivity and specificity based on the distribution of results within the same 2×2 array. The sensitivity was just the specificity of DR absence detection and the specificity was just the sensitivity of DR absence detection. Thus, when any DR was detected, the pooled sensitivity was 95% (95% CI 94% to 96%) and the pooled specificity was 86% (95% CI 84% to 88%). Sensitivity is the effectiveness of telemedicine in detecting DR in patients who have DR, and thus reduces the risk of missing DR. The analogous sensitivity and specificity were also displayed in the subgroup analysis using digital imaging. The high sensitivity in detecting any clinical level of DR suggests the good performance of telemedicine in ophthalmology and supports its common use in DR screening.8 The pooled sensitivity for detecting severe NPDR was lower than for other levels of DR; this was also shown by the two subgroup analyses (see online supplementary table S3).
One limitation of this review was the presence of heterogeneity. The results of meta-regression analysis using covariates such as subject characteristics, recruitment methods and digital imaging techniques did not provide valuable information. Even after the subgroup analyses based on the digital imaging technique, heterogeneity was only partially ameliorated. In a previous study, the authors reported that the prevalence of DR of any clinical level was higher in people with type 1 diabetes than in those with type 2 diabetes.4 ,41 Even when we excluded the study that recruited subjects with type 1 diabetes only,15 heterogeneity was not ameliorated (data not shown). In the 20 studies that were included, the percentage of subjects with no DR varied from 1.27%36 to 59.86%;35 this may also have been a source of heterogeneity. Another limitation of our findings was that the raw data provided by three studies were unavailable and the data used in the meta-analysis were only from published papers. This, in turn, introduces the possibility of study selection bias. Additionally, the quality of telemedicine largely depends on the experience of readers who grade the digital images and the technician who takes the images. Thus, the use of telemedicine is limited.
In summary, the diagnostic accuracy of telemedicine using digital imaging in DR is overall high. The high sensitivity of its detection of any clinical level of DR indicates that telemedicine can be used widely for DR screening. Telemedicine based on digital imaging techniques that incorporate mydriasis and a wide (100–200°) field is the best choice for detecting the absence of DR and mild NPDR. Further research should be carried out to evaluate the diagnostic accuracy of telemedicine based on each digital imaging technique using a study design that may prevent heterogeneity across studies.
References
Supplementary materials
Supplementary Data
This web only file has been produced by the BMJ Publishing Group from an electronic file supplied by the author(s) and has not been edited for content.
Files in this Data Supplement:
- Data supplement 1 - Online supplement
Footnotes
LS and HW contributed equally.
-
Contributors LS, HW: data collection, data analysis, writing the manuscript, final approval. JD: conception, critical review, final approval. KJ: data collection. XL, JS: data analysis, logistical support.
-
Funding This work was supported by a grant from the National Natural Science Foundation of China (No. 81271668).
-
Competing interests None.
-
Provenance and peer review Not commissioned; externally peer reviewed.
Linked Articles
- At a glance