Article Text

Abstract
Aims To evaluate the efficacy of Fourier domain-optical coherence tomography (FD-OCT) in imaging and quantifying the limbal palisades of Vogt and to correlate these images with histological findings.
Methods The superior and inferior limbal region of both eyes of 50 healthy volunteers were imaged by FD-OCT. Images were processed and analysed using Matlab software. In vitro immunofluorescent staining of a cadaveric donor limbus was analysed to correlate the presence of stem cells in the visualised structures.
Results FD-OCT could successfully visualise limbal crypts and the palisades of Vogt in the limbus region. Fluorescent labelling confirmed the presence of stem cells in these structures. The mean palisade ridge width (ΔPR) and the mean interpalisade epithelial rete peg width (ΔERP) were both of the order of 72 μm, leading to a palisade density (PD) of about 7.4 palisades/mm. A significant difference in ΔPR, ΔERP and PD was seen between the inferior and superior sides of the right eye and the superior sides of the left and right eye(p<0.05.). A significant influence of iris colour on parameters ΔPR, ΔERP and PD was found, and of age on PD and ΔERP (p<0.05).
Conclusions In vivo OCT imaging is a safe and effective modality to image the limbus and can be used to visualise the palisades of Vogt. Image processing using Matlab software enabled quantification and density calculation of imaged limbal palisades of Vogt. This technique may enhance targeted limbal biopsies for transplantation.
- Cornea
- Imaging
- Physiology
- Stem Cells
This is an Open Access article distributed in accordance with the Creative Commons Attribution Non Commercial (CC BY-NC 4.0) license, which permits others to distribute, remix, adapt, build upon this work non-commercially, and license their derivative works on different terms, provided the original work is properly cited and the use is non-commercial. See: http://creativecommons.org/licenses/by-nc/4.0/
Statistics from Altmetric.com
Introduction
Stem cell niches are highly organised three-dimensional (3D) structural units that provide a unique microenvironment to support stem cells in the human eye.1 Three different anatomical/histological structures have been described as stem cell niches: limbal crypts (LC), focal stromal projections (FSP) and limbal epithelial crypts (LEC).2–4 LEC were first described as structures extending from the peripheral aspect of the interpalisade ridge and extended radially into the conjunctival stroma parallel to the palisade or circumferentially along the limbus at the right angles to the palisade.4 FSP's are described as finger-like projections of stroma extending upward into the corneal limbal epithelium, while LC are defined as epithelial rete pegs (ERP), that is, distinct invaginations of epithelial cells that extend from the peripheral cornea into underlying stroma.3
All three limbal stem cell niches are located at the level of the palisades of Vogt (POV) and are mainly present at the superior and inferior limbus.5 There is no consensus about the exact number and location of niches in the limbus, and visualisation of the niches remains challenging.3 ,5 Overall limbal health can be estimated by visualising the POV using non-invasive slit-lamp biomicroscopy. In up to 20% of patients, however, the POV are not visible at slit-lamp examination.2 ,6 ,7 In addition, biomicroscopy does not generate a cross-sectional view of the limbal structures, nor does it allow quantification of the limbal niches.
Optical coherence tomography (OCT) is a well-established imaging technique and provides cross-sectional tomographic images of biological tissues in situ, by a non-contact method. Ultra high-resolution-OCT (UHR-OCT) has been used to successfully identify the POV and three-dimensionally reconstruct the limbal region.8 ,9 However, UHR-OCT is not commercially available and its use in imaging the limbus has yet to be introduced in the clinic. High-resolution OCT devices, including the RTVue, have a lower resolution but are more readily available in daily ophthalmological practice. They can evaluate tear film and corneal architecture, and its use has been described to differentiate ocular surface pathologies.10–14
In this study, we aim to image the limbal stem cell niches with a commercially available Fourier domain-OCT (FD-OCT) and to correlate these images with histological findings. A software method to analyse and quantify the imaged limbal stem cell niches is described. Furthermore, we performed descriptive analysis of the niche structures and assessed possible correlations with gender, age, eye colour and laterality.
Materials and methods
The study followed the tenets of the Declaration of Helsinki and was approved by the Antwerp University Hospital Ethical Committee (EC: 12/39/302).
Clinical evaluation
Study design and inclusion criteria
The study was conducted on 50 healthy volunteers (15 men, 35 women; age range: 21–51 years). Exclusion criteria were a history of corneal disease, ocular surgery, ocular and periocular inflammatory disorders, diabetes mellitus, systemic diseases with eye involvement, the use of rigid gas permeable contact lenses or wearing soft contact lenses for more than 3 days a week. Written informed consent was obtained from all participants. All subjects underwent a slit-lamp biomicroscopy examination prior to OCT imaging to the absence of the exclusion criteria. Slit-lamp photographs were taken of superior and inferior limbal regions of both eyes and assessed by two independent examiners to rate the visibility of the POV, identified as radially arranged linear or branching structures at the corneoscleral rim (figure 1). In case of discrepancy between the two evaluations, the assessment of a third examiner was decisive. The slit-lamp images were also used to classify the subjects' eye colour. Iris colour was classified into two groups, based on the grading classification of Grieve and Morant.15 Patients containing more blue, grey or green than brown pigment were classified as ‘blue-grey-green’, whereas patients containing more brown than blue, grey or green pigment were classified as ‘hazel-brown-black’.

Slit-lamp photograph of an inferior limbal rim of a pigmented subject (left) and its magnification (right). The arrow indicates the palisades of Vogt (POV). According to the classification of Townsend, these POV would be ruled as attenuated that is, the structures are visible but have a low degree of pigmentation.2
FD-OCT imaging
Anterior segment FD-OCT images were obtained using the RTVue 100–2 (Optovue, California, USA) by a trained operator. For each subject and each eye, three sets of 31 horizontal B-scan images—that is, cross sections—of the superior and inferior limbal regions were taken using the L-cam lens and the standard line scan protocol (figure 2A, B), which has a width of 6.0 mm and resolution of 6.9 µm. Each set of 31 scans was averaged using the autoaveraging protocol to generate a composed image. During the imaging procedure, each subject placed their head on a chin–forehead support, and the required eccentric fixation of the subjects was obtained using an external fixation light.

Steps of the OCT image analysis: (A) selection of the region of interest on the OCT image; (B) location on the limbus; (C) detail of the delineated region, flattened to account for the corneal curvature; (D) mean grey scale values of (C) calculated along the vertical direction in arbitrary units, along with the manually placed markers (red circles), indicating the minima and maxima of the grey scale variations and the automatically calculated midpoints (black circles). The complete limbal region visualised on the OCT scan is analysed following these methods. The delineated region in image (B) is for illustrative purposes only and does not limit a region of analysis. ERP, epithelial rete pegs; OCT, optical coherence tomography; PR, palisade ridge.
Image analysis
For each eye and each location (superior and inferior limbus), three autoaveraged B-scan images were available. From these three images, the best quality scan was chosen for further processing, based on the visibility and contrast of the line pattern corresponding with the POV. The image analysis consisted of selecting a region of interest with at least 10 lines in the image (white box in figure 2B), after which the image was flattened to account for the corneal curvature. Next, the first 30 pixels were automatically selected (figure 2C), corresponding with the anterior 135 μm of the corneal surface, from which the mean grey value in the vertical direction was calculated. These mean grey values form a sinusoidal pattern (blue dots in figure 2D) in which the minima and maxima (red dots) were determined manually by a trained observer, from which the midpoints were derived (black dots). The distances between these midpoints were then taken as the width of the palisade ridges (ΔPR) or that of the ERP (ΔERP), while correcting for the geometric distortion introduced by the corneal flattening. Finally, the palisade density (PD) was calculated as 1000/[ΔPR(μm)+ΔERP(μm)]. All image processing was performed using Matlab R2011b (The MathWorks, Massachusetts, USA).
In vitro verification
Both eyes from a research-consented cadaveric 77-year-old donor were enucleated at from the Antwerp University Hospital Eye Bank within 4 hours postmortem. At enucleation, the medial rectus muscle was dissected at 1 cm of the globe to allow orientation of the eye. There were no signs of eye disease at slit-lamp examination, and no recorded medical history of previous eye disease. Both eyes were anatomically orientated in a plastic dummy head mount, which was placed in the chin–forehead support of the RTVue. Eccentric fixation was mimicked manually. Similar to the healthy controls, three B-scans were obtained from each region of interest using the same scanning protocol. The scanned zone was delineated with a tissue stain for further in vitro verification (see online supplementary data 1). The marked area of interest, containing the limbal rim, was dissected from the eyeball. The tissue samples were fixed in 4% paraformaldehyde, embedded in paraffin and subsequently sectioned into 5±1µm thick consecutive axial sections. Every fifth section was stained with H&E, whereas the remaining sections were stored for subsequent immunohistochemical analysis with either Delta Negative-p63, Cytokeratin/12, CK14 or CK7 primary antibodies. Antibodies were eventually incubated with an immunofluorescent-labelled antibody (FITC or Cy3). Cell nucleus was 4′,6-diamidino-2-phenylindole-counterstained. Images of H&E-stained sections were recorded at low magnification (5× or 8×), encompassing wide areas of the region of interest. Immunofluorescence-stained sections were recorded at either low (4×), medium (10×) or high (20×) magnification to obtain overview images of the region of interest, as well as detailed imaging of POV. The detailed protocol of immunohistochemistry is attached as online supplementary data 1.
supplementary data
Statistics
The statistical analysis was performed using SPSS 23 (IBM, Armonk, New York, USA) at a significance level of 0.05. No Bonferroni correction for α inflation due to multiple comparisons was applied as the parameters ΔPR, ΔERP and PD are not independent from each other. Based on the Shapiro-Wilk test, it was determined that five out of 12 variables were not normally distributed (p<0.05), which necessitated the use of non-parametric tests.
Results
Subjects
A total of 50 subjects were recruited for this study. The mean age of the subjects was 27.6±5.5 years. Further details on the study cohort can be found in table 1.
Subject details*
Visualisation of the limbal crypts
Clinically, the POV were seen as radially arranged linear or branching structures at the corneoscleral rim (figure 1). OCT imaging of the limbal rims revealed distinct bright lines narrow at the epithelial side and expanding towards the base, alternated with darker lines narrow at the base and expanding towards the epithelial side. These anatomical structures are identified as the PR and the ERP, respectively.3
By OCT-imaging, the PR's and the ERP's could be visualised in 194 of the 200 (97%) limbal regions. In six (3%) of the OCT images, no limbal structures could be observed by OCT. There was only one (0.5%) limbal rim in which POV were observed at slit-lamp examination, but not at OCT imaging. However, in 91% (49/54) of the regions in which POV could not be identified clinically, PR's and ERP's could be observed by OCT-imaging (table 2).
Visibility of crypt structures
In 52 (26%) of the OCT scans, POV structures could be identified, yet the region of interest had less than 10 lines in the image or the image contrast was insufficient to perform reliable analyses of the POV dimensions. Of the excluded images in the analyses, 15 were located at the inferior limbus (29%), whereas 37 (71%) were located at the superior limbus.
Dimensions of the limbal crypts
The width of the PR and ERP (ΔPR and ΔERP) was determined for the inferior and superior corneoscleral rim of both right and left eyes (table 3). Mean ΔPR and mean ΔERP were both about 72 μm, leading to a PD of about 7.4 palisades/mm. Parameters ΔPR, ΔERP and PD significantly differed between the inferior and superior ridges of the right eye and between the superior rims of the right and left eye. No significant differences could be found between the inferior and superior ridges of the left eyes, or between the inferior rims of the left and right eyes. (Wilcoxon, p>0.05; table 3).
Statistical overview of the parameters
There was a significant Spearman correlation between the parameters ΔPR, ΔERP and PD of the inferior and superior rims of right eyes and between all parameters for the right and left eyes at the superior and inferior rims. No significant correlations could be found between the parameters of the superior and inferior rims in left eyes. (p<0.05).
For the right inferior rim, there was a significant influence of iris colour on ΔPR, ΔERP and PD and of age on PD and ΔERP, but not on ΔPR. There also was a significant influence of age on all parameters for the left superior limbal region. No significant influence of subject gender was observed for this cohort (Mann-Whitney U test, p<0.05; table 4).
Influence of gender, age or pigmentation (p values)*
Repeatability of the method
In order to estimate the measurement error of the image analysis method, 10 eyes of five randomly selected subjects were measured five times, from which the repeatability could be determined (table 5). The measurement error of the superior limbus is about 40%–50% larger than that of the inferior limbus, indicating that the superior measurements are less reliable.
Repeatability of the measurement procedure
In vitro verification
The POV could be visualised at slit-lamp examination and OCT imaging in each superior and inferior limbal region. PR and ERP could be identified on the OCT images (figure 3A). ΔPR, ΔERP and PD were not calculated, as results would not be reliable due to postmortem tissue swelling. H&E staining of tissue sections of the involved region showed the presence of PR- and ERP-like structures with small cells that have relative high nucleus-to-cytoplasm ratio (N/C ratio) present at the basal epithelial layers (figure 3B). Immunofluorescent labelling confirmed that these small basal cells showed positive expression of ΔNp63 (figures 3C and 4). Labelling with CK3/12, CK7 and CK14 confirmed that the region of interest was the POV, hence the Limbal Epithelial Stem Cell niche (data not shown).
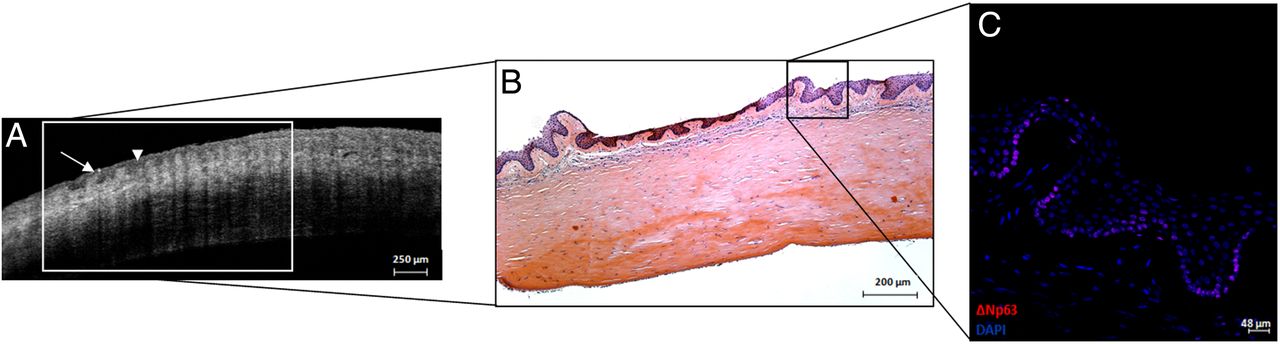
Fourier domain-optical coherence tomography (FD-OCT) imaging of the inferior limbus of the right cadaveric donor (A). Tissue sections of the scanned region with H&E staining (5×) (B) and composed DAPI—ΔNp63 immunofluorescent labelling (20×) (C). (A) FD-OCT imaging allows visualisation of structures resembling palisade ridges (arrow) and epithelial rete pegs (arrow head) as well as the underlying stroma and endothelium (A). H&E staining of the region of interest corresponds to the image obtained by FD-OCT scanning (B). Immunofluorescent labelling at 20× magnification allows for further identification of structures (figures 3C and 4D–F).

Immunofluorescent staining of the scanned inferior limbus (A–F); DAPI stain (A and D); ΔNp63 staining (B and E), merged image DAPI+ΔNp63 (C and F). Magnification: (A–C) 4×; (D–F) 20×. (C and F) are merged pictures of (A) and (B), and (D) and (F), respectively. (B and E): Immunofluorescent labelling identifies ΔNp63-positive cells at the basal epithelial layer of the structures recognised as ERP (arrowhead) and PR (arrow) on Fourier domain-optical coherence tomography. ERP, epithelial rete peg; PR, palisade ridge.
Discussion
With FD-OCT, we were able to visualise anatomical crypt structures that correspond with the ERP and the crest-like structures emerging from the underlying stroma—the PR. Confirmation of the presence of LESC in the basal layers of these structures was based on the observation of small basal cells with relative high N/C ratio and ΔNp63 positivity (figures 3B, C and 4). The delta-N-isoform of the transcription factor p63 has been defined as a specific stem cell marker.16 ,17 Unfortunately, it was impossible to differentiate PR from FSP on FD-OCT due to the cross-sectional nature of the images. With FD-OCT, however, we were unable to identify LEC structures as described by Dua et al.4 This may be because these niche structures are reported to be limited in number with an average of six LEC per cornea.5 ,18 Moreover, other research groups have also been unable to identify LEC on histology or in vivo confocal microscopy (IVCM).2 ,19–21 It may be hypothesised that LEC are LC that show a more pronounced peripheral extension of the crypt, observed in certain individuals.
In our study, the POV could be identified on the OCT scans of 97% of included limbal regions, while the visibility at slit-lamp examination was 73%. These data suggest that FD-OCT is a more reliable tool for the visualisation of the POV. In this study, no clear line could be revealed in the distribution of the limbal niches. These findings could be related to the study methodology as only a region of the limbal rim was analysed and the study population was limited in size. Alternatively, these findings could also be due to the variation of limbal anatomy. Further analysis with bigger sample size is needed to confirm these findings.
The influence of age on the niche topography has previously been described by Notara et al.20 Although the age range of the study population was narrow, we revealed an influence of age on the parameters for the right inferior (PD and ΔERP) and left superior (PD, ΔPR and ΔERP) limbal region. No influence was found for subject gender, although gender was not distributed equally. To our knowledge, this is the first time a method for the quantification of limbal POV has been described for OCT imaging. The advantage of quantifying the niche structures allows us to determine normal range of anatomical variation, more than diagnosing limbal stem cell pathologies. PD below the ‘normal’ threshold in the region of interest may qualify as an exclusion criteria for harvesting tissue. Targeted biopsies could improve cell yield for procedures such as simple limbal epithelial transplantation (SLET) or cultivated limbal epithelial transplantation (CLET) and also prevent development of adverse events such as induced or iatrogenic Limbal Stem Cell Deficiency.3 ,22
Alternatively, high-resolution imaging of the limbus at the cellular level can be performed by IVCM.23 However, this technique is time-consuming, has a limited field of view, requires direct contact with the eye and is difficult to implement in daily clinical practice. OCT eliminates these limitations and could potentially offer a substitute imaging modality of the limbus. Moreover, OCT can be used for 3D limbal imaging. Although this reconstruction comes at the cost of spatial and axial image resolution, limbal 3D imaging could assist in understanding the limbal architecture, which potentially improves the outcome of targeted biopsy harvesting.8 ,9 ,24 One study subject underwent additional 3D-OCT scanning. Although resolution is insufficient to perform descriptive analysis on the reconstructed image and video, PR's and ERP's can be identified (see image and video in supplementary data 2). Restrictions of our proposed quantification method are the subjective selection of limbal niches for analysis, and the inability to image the entire limbal rim.
supplementary video
In conclusion, FD-OCT is a valuable technique to image the limbal stem cell niches in healthy subjects. Although resolution of the FD-OCT is insufficient to differentiate between FSP and PR, the POV could clearly be visualised in vivo. It was possible to quantify the POV structures with FD-OCT imaging, potentially improving SLET and CLET outcome by means of targeted biopsy harvest. Even though this cohort suggest that age and iris colour may influence the dimensions of limbal structures, no major conclusions could be drawn from the distribution of Stem cell niches in either the superior or inferior limbal rim. FD-OCT might offer a promising imaging modality allowing safe and rapid evaluation of both healthy and compromised corneoscleral rims in clinical practice.
Acknowledgments
The authors would like to thank Dr H Sillen and R Leysen for assisting in obtaining slit-lamp images of the subjects and optical coherence tomography -imaging of the cadaveric donor eye, and D De Rijck and Dr I Pintelon from the Department of Veterinary Sciences, University of Antwerp for their help in guiding the immunohistochemistry in vitro verification.
References
Footnotes
MH and JB contributed equally.
Contributors MH, JR, SND, M-JT and NZ contributed to the planning of this study. MH, JB, JR, VVG, SM and NZ contributed to the conduction of this study, whereas MH, JB, JR, SND and NZ significantly contributed to the reporting of the work.
Funding This research was funded by, Horizon2020 ARREST BLINDNESS, ‘Agentschap voor Innovatie door Wetenschap en Technologie—Toegepast Biomedisch onderzoek’ (IWT-TBM), and Funds for Research in Ophthalmology Belgium. Michel Haagdorens is a PhD student who holds a Research Foundation—Flanders scholarship.
Competing interests None declared.
Patient consent Obtained.
Ethics approval Ethisch Comité UZA.
Provenance and peer review Not commissioned; externally peer reviewed.
Linked Articles
- At a glance