Article Text

Abstract
Aim To estimate the prevalence of glaucoma in Australia.
Methods This was a population-based study of 3098 non-Indigenous Australians (50–98 years) and 1738 Indigenous Australians (40–92 years) stratified by remoteness. Each participant underwent a standard examination that included visual field assessment, tonometry and non-mydriatic fundus photography. Two fellowship-trained glaucoma specialists independently assessed relevant case notes (past ocular history, best-corrected visual acuity, frequency doubling technology visual fields, Van Herick grade, intraocular pressure and optic disc-centred photographs) and assigned a diagnosis ranked on a scale of certainty: none, possible, probable or definite glaucoma.
Results A total of 4792 (99.1%, 3062 non-Indigenous and 1730 Indigenous) participants had retinal photographs in at least one eye that were gradable for glaucoma. The weighted prevalence of glaucoma (definite) in non-Indigenous Australians and Indigenous Australians was 1.5% (95% CI 1.0 to 2.2) and 0.6% (95% CI 0.4 to 1.1), respectively. When definite and probable cases of glaucoma were combined, rates were 3.4% (95% CI 2.7 to 4.3) among non-Indigenous and 1.6% (95% CI 1.1 to 2.3) in Indigenous Australians. Only 52.4% of non-Indigenous Australians and 28.0% of Indigenous Australians with glaucoma self-reported a known history of glaucoma.
Conclusion We estimate that 198 923 non-Indigenous Australians aged 50 years and over and 2139 Indigenous Australians aged 40 years and over have glaucoma. Given the high rates of undiagnosed glaucoma coupled with a significant ageing of the Australian population, improvements in case detection and access to low vision rehabilitation services may be required to cope with the growing burden of glaucoma.
- epidemiology
- public health
- glaucoma
Statistics from Altmetric.com
Introduction
Glaucoma is a leading cause of vision loss among the adult population globally1 and in Australia.2 Previous research has established that glaucoma has a significant impact on quality of life3 and poses a significant financial burden, with estimated annual direct costs in Australia of $144 million.4 There is currently a paucity of recent data on the prevalence of glaucoma from population-based surveys conducted in Australia. Current and accurate data are useful to quantify Australia’s burden of glaucoma and inform planning for eye healthcare delivery.
A recent meta-analysis of 50 population-based studies from around the globe reported the pooled glaucoma prevalence (age range=40–80 years) to be 3.5%.5 In Australia, two population-based studies, conducted in the early 1990s, the Melbourne Visual Impairment Project (Melb VIP)6 and the Blue Mountains Eye Study (BMES),7 reported a prevalence of primary open-angle glaucoma of 1.7% and 3.0%, respectively. Despite being conducted more than two decades ago, the Melb VIP and BMES remain as the reference studies for glaucoma in Australia. Since their completion, there have been substantial demographic changes (eg, increase in life expectancy and population growth),8 highlighting the need for an updated national estimate of the prevalence of glaucoma.
Unlike the non-Indigenous population, the Indigenous Australian population has been reported to have negligible rates of glaucoma.9 10 This is despite the presence of large optic nerve heads with associated increased cup to disc ratios,11 higher rates of pseudoexfoliation syndrome12 and thinner central corneal thickness13 that has been consistently found among Indigenous Australians. This was highlighted recently in the Central Australian Ocular Health Study (CAOHS, 2010), where the reported prevalence of primary open-angle glaucoma in Indigenous Australians aged 40 years and over was only 0.52%.10 However, robust comparisons among Indigenous and non-Indigenous populations have been problematic due to the adoption of different definitions for the classification of glaucoma among the various studies. That is, both BMES and Melb VIP used a clinical categorical severity classification, while the CAOHS applied the International Society of Geographical and Epidemiological Ophthalmolog definition.
The National Eye Health Survey (NEHS), with its nationally representative sample of non-Indigenous and Indigenous Australians, stratified by remoteness strata, provides an ideal setting in which to investigate the epidemiology of glaucoma in Australia.
Materials and methods
Study population
The NEHS is a nationwide population-based survey (March 2015–April 2016) that investigated the prevalence and causes of vision impairment (VI) (presenting visual acuity (VA) <6/12 to ≥6/60 in the better eye) and blindness (presenting VA <6/60 in the better eye) in non-Indigenous Australians, aged 50 years and older, and Indigenous Australians, aged 40 years and older. The younger age inclusion criteria for Indigenous Australians was chosen as they have earlier onset and more rapid progression of several eye diseases, including diabetic retinopathy.14 The sampling methodology of the NEHS has been described in detail elsewhere.15 In brief, multistage random-cluster sampling was used to select participants from 30 geographic areas across five Australian states and one territory, stratified by remoteness, based on data from the 2011 Australian Census.16 Participants were recruited door to door, and high overall positive response rates and examination rates were achieved (83.5% and 71.5%, respectively). Study procedures adhered to the tenets of the Declaration of Helsinki as revised in 2013 and participants provided written informed consent to participate.
Procedures
The examination protocol of the NEHS has been described in detail elsewhere.17 In brief, an interviewer-administered questionnaire was used to collect information on sociodemographic factors and ocular and medical histories. The component of the questionnaire pertaining to glaucoma history asked participants whether they had ever been told by a health professional that they have glaucoma (self-reported glaucoma). Presenting distance VA was assessed using a logMAR chart and automated refraction was performed (Nidek, Japan) on participants with vision loss (<6/12) who improved to ≥6/12 with pinhole testing. Intraocular pressure (IOP) was measured in both eyes using the iCare tonometer (iCare, Finland). Visual fields were assessed using frequency doubling technology (FDT) perimetry (Zeiss Humphrey Systems & Welch Allyn, USA). An N-30-5 screening test was completed by each participant, and if sensitivity was reduced in any of the 19 field test locations for either eye, the test was repeated to determine the reproducibility of the defect and the best result was graded. Two standard, 45-degree, non-stereoscopic colour retinal photographs were taken of each eye, one centred on the optic disc (field 1) and the other centred on the macula (field 2) using a Digital Retinography System (DRS, CenterVue SpA, Italy). In cases where photograph quality was poor, pupillary dilation was conducted if anterior chambers were deemed wide enough to do so safely using the Van Herick method.
Diagnosis of glaucoma and ocular hypertension (OHT)
To ensure an accurate diagnosis of glaucoma, a three-step protocol was used. First, an experienced grader from the Centre for Eye Research Australia graded each image, and the clinical records of participants who were regarded as glaucoma suspects (box 1) were compiled. Second, two fellowship-trained glaucoma specialists (GSA and JCFG) reviewed relevant case notes (past ocular history, best-corrected VA, FDT visual fields, Van Herick grade, IOP and optic disc-centred photographs) and independently assigned a diagnosis ranked on a scale of certainty: none, possible, probable or definite glaucoma. Given the sensitivity to detect glaucoma by FDT perimetry on its own is suboptimal,18 visual fields were viewed in conjunction with the appearance of the optic nerve head.19 Perimetric defects were only considered to be glaucomatous if they correlated with the optic disc features. In line with Melb VIP protocols,6 each expert used their own clinical judgement to classify each case, and no specific criteria were used. Lastly, any cases with a difference of two or more steps were adjudicated by a third senior glaucoma specialist (JC). OHT was defined as an IOP greater than 21 mm Hg in either eye after excluding cases graded as probable or definite glaucoma.
Criteria for glaucoma suspect
IOP greater than 21 mm Hg and possible glaucomatous visual field defect (≥2 points missed on FDT)
self-reported a history of glaucoma
CDR ≥0.7
CDR asymmetry of >0.2
disc haemorrhage
disc rim thinning
cup notching
nerve fibre layer defect.
CDR, cup:disc ratio; FDT, frequency doubling technology; IOP, intraocular pressure.
Statistical analysis
Data were weighted by calculating sample weights for all records using the probability of selection at each stage of sampling. Ninety-five per cent CIs, taking into account the sampling design, were calculated for prevalence of glaucoma. The sampling weight-adjusted prevalence of glaucoma was calculated using logistic regression models.
Logistic regression analysis examining associations between known and potential risk factors of glaucoma was stratified by Indigenous status. Covariates included age, gender, years of education, ethnicity, remoteness area, self-reported stroke and diabetes, IOP and previous history of cataract surgery. The Box-Tidwell model was used to find the best power for model fit based on maximal likelihood estimates. Analyses were conducted with Stata V.14.2.0.
Results
A total of 4836 individuals were recruited and examined in the NEHS, including 3098 non-Indigenous (64%) and 1738 (36%) Indigenous Australians, respectively. Of these, 4792 (99.1%, 3062 non-Indigenous and 1730 Indigenous) participants had retinal photographs in at least one eye that were gradable for glaucoma (gradable images in only one eye=0.6%, 27/4836). Of the total non-Indigenous population with gradable retinal images for glaucoma, 46.3% (n=1418) were male and 71.7% (n=2195) identified as Oceanian. Forty-one per cent (n=710) of Indigenous participants with gradable retinal images for glaucoma were male.
Of the total 4792 participants, 736 (15.4%, 442 non-Indigenous and 249 Indigenous) were identified as glaucoma suspects, and both eyes (gradable eyes=96.7%, 1448/1472) were subsequently graded independently by the two fellowship-trained glaucoma specialists. Of these, a disagreement of two or more steps on the glaucoma diagnosis scale occurred in 2.1% (30/1448) of eyes. These cases were subsequently adjudicated by the third senior glaucoma specialist. In the non-Indigenous population, 51 (1.7%) were regarded as definite glaucoma, 65 (2.1%) as probable and 191 (6.2%) as possible glaucoma sufferers. Eight (0.5%) participants in the Indigenous population were regarded as definite glaucoma, with probable glaucoma graded in 17 (1.0%) and possible in 165 (9.5%) participants.
Weighted prevalence of glaucoma by Indigenous status
In the non-Indigenous population aged 50 years and over, the weighted prevalence of definite glaucoma was 1.5% (95% CI 1.0 to 2.2), with probable or definite glaucoma observed in 3.4% (95% CI 2.7 to 4.3). Definite glaucoma was found in 0.6% (95% CI 0.4 to 1.1) of Indigenous Australians aged 40 years and over, with probable or definite glaucoma observed in 1.6% (95% CI 1.1 to 2.3) (table 1). In Indigenous Australians aged ≥50 years, the prevalence of definite glaucoma remained at 0.6% (95 CI 0.2 to 1.1). Bilateral definite glaucoma was found in 35.3% (18/51) of all cases in the non-Indigenous population and 12.5% (1/8) of cases in the Indigenous population.
Weighted prevalence (% (95% CI)) of glaucoma by Indigenous status, age and gender
The weighted prevalence of glaucoma (probable or definite) increased with age in non-Indigenous participants, with the following age-specific prevalence estimates: 1.8% in those <60 years, 3.0% in those aged 60–69 years, 4.2% in those aged 70–79 years and 6.7% in those aged ≥80 years (P<0.001, figure 1). In the Indigenous population, the prevalence of glaucoma for the age groups <60 years and >60 years were 0.7% and 3.6%, respectively (P<0.001). Among non-Indigenous Australians aged 50 years and over, the prevalence of probable or definite glaucoma was 3.9% for males and 3.0% for females (P=0.23). Definite or probable glaucoma was found in 1.8% of males and 1.5% of females in the Indigenous population (P=0.65).
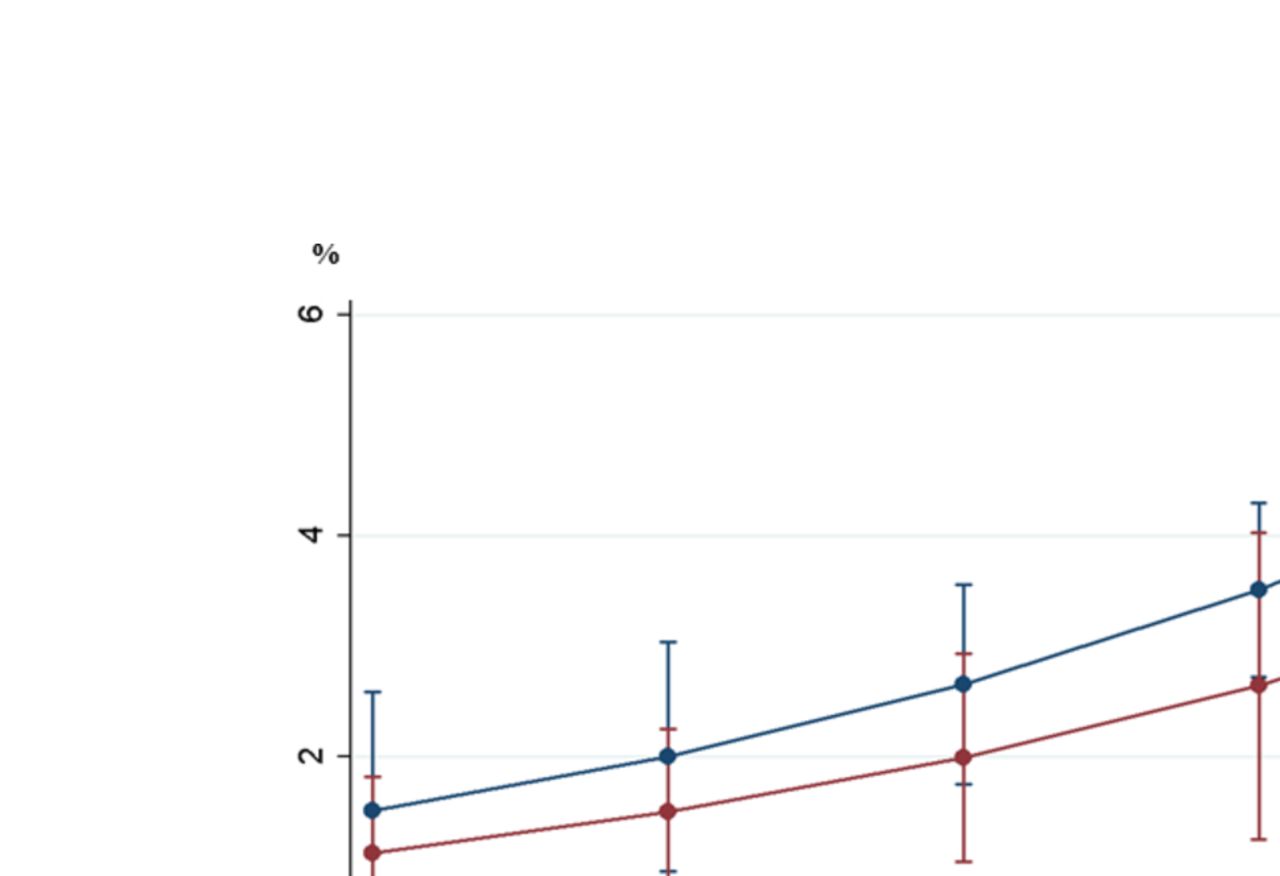
Adjusted prevalence of glaucoma for Indigenous and non-Indigenous participants by age.
Undiagnosed glaucoma
In the non-Indigenous population, 70.6% (36/51) of definite glaucoma cases and 40.0% (26/65) of probable glaucoma cases self-reported a history of being previously diagnosed with glaucoma (combined rate=53.4%, 62/116). Of all undiagnosed cases in the non-Indigenous population, only 7.4% (4/54) had an IOP >21 mm Hg and 50% (27/54) had accessed an optometry or ophthalmology service in the past 12 months (self-report). Among the Indigenous population, only three (37.5%, 3/8) participants with definite glaucoma and four with probable glaucoma (23.5%, 4/17) self-reported a history or being previously diagnosed with glaucoma (combined rate=28.0%, 7/25). Six per cent (1/18) of Indigenous participants with undiagnosed glaucoma had an IOP >21 mm Hg and 56% (10/18) had accessed an optometry or ophthalmology service in the past 12 months (self-report).
Ocular hypertension
The weighted prevalence of OHT in non-Indigenous and Indigenous Australian adults was 4.3% (95% CI 3.5 to, 5.2) and 3.5% (95% CI 2.6 to 4.7), respectively. There was no significant difference in the prevalence of OHT between males and females among non-Indigenous (males=4.3% vs females=3.5%, P=0.56) and Indigenous (males=4.1% vs females=3.1%, P=0.27) participants. After adjustments, the prevalence of OH decreased significantly with age (p for trend=0.01) (figure 2).

Adjusted prevalence of ccular hypertension for Indigenous and non-Indigenous participants by age.
Associations of glaucoma
In the non-Indigenous population, univariate logistic regression analysis revealed older age (OR=1.63 per 10 years, P<0.001), fewer years of education (OR=0.94, P=0.02) and a history of previous cataract surgery (OR=3.06, P<0.001) were associated with the presence of glaucoma. After adjusting for known and potential covariates, older age and a history of previous cataract surgery remained associated with glaucoma (table 2).
Sampling weight adjusted multivariable logistic regression analysis investigating associations for glaucoma (probable and definite), stratified by Indigenous status
In the Indigenous population, univariate analysis revealed that older age (OR=1.36 per 10 years, P=0.008), self-reported diabetes (OR=2.37, p=0.002) and residing in a remote geographical area (OR=4.80, P=0.01) were associated with the presence of glaucoma. After adjustments, self-reported diabetes and residing in a remote geographical area remained a risk factor for glaucoma. Given the low frequency of glaucoma found in the Indigenous population, these associations should be viewed with caution.
Discussion
This paper presents the prevalence of glaucoma in a population-based, national sample of non-Indigenous and Indigenous Australian adults. Extrapolating our findings to the Australian population, we estimate that 198 923 non-Indigenous Australians aged 50 years and over and 2139 Indigenous Australians aged 40 years and over have glaucoma. Nearly half of non-Indigenous participants and more than 70% of Indigenous participants with glaucoma did not have a known history of the disease.
When definite and probable cases of glaucoma were combined, rates of glaucoma in non-Indigenous Australians were similar to that found in previous studies—the reported prevalence of glaucoma was 3.0% in the BMES,7 3.4% in the Singapore Malay Eye Study,20 3.7% in the Beijing Eye Study21 and 4.0% in the Reykjavik Eye Study22—but higher than that reported in Caucasians in the Rotterdam Study (1.1%).23 However, these comparisons should be viewed with caution due to differing age distributions and definitions of glaucoma. In the Australian context, we are able to compare the age-standardised prevalence of glaucoma with the Melb VIP. After age standardisation, the prevalence of glaucoma (probable or definite) in non-Indigenous participants in the present study (3.4%) is marginally higher than that of the Melb VIP (3.0%). This finding is not surprising, given the steady ageing of the population in Australia over the past two decades.8 Consistent with the findings of a large body of previous literature,6 7 the prevalence of glaucoma increased substantially with age, with non-Indigenous persons aged 80 years and older being three times more likely to have glaucoma than persons aged 60–69 years. Unlike the BMES7 and Melb VIP,6 the prevalence of OHT decreased with age in the present study. While cohort effects may be a contributory factor, there is no clear explanation for this finding.
After adjusting for age, the prevalence of glaucoma in Indigenous participants was 2–3 times lower than that found among non-Indigenous Australians. The finding of a low prevalence of definite glaucoma among Indigenous participants (0.6%) is remarkably similar to previous Australian studies, the CAOHS (0.57%)10 and the National Trachoma and Eye Health Project (0.4%).24 These findings seem counterintuitive, given that higher rates of known glaucoma risk factors.11 12 25 We can only speculate that genetic factors and/or the lower life expectancy of Indigenous Australians26 may contribute to the low prevalence of glaucoma in this cohort.
In the current study, nearly half of non-Indigenous Australians and three-quarters of Indigenous Australians who had probable or definite glaucoma did not have a known history of glaucoma. The lower glaucoma awareness among Indigenous Australians is most likely explained by a poorer access to, and less frequent utilisation of, eye care services in this group.27 Our finding from the non-Indigenous population is similar to that reported in previous studies internationally23 and highly consistent with rates reported in the Melb VIP (50%)6 and the BMES (49%).7 For Indigenous Australians aged 40 years and over in the NEHS, rates of previous awareness of diagnosis in those with glaucoma (28%) was only modestly higher than that reported a decade ago in the National Indigenous Eye Health Survey (2008) (19.3%).9 Our finding that the majority of cases with undiagnosed glaucoma (non-Indigenous=93% and Indigenous=94%) had an IOP of ≤21 mm Hg is modestly higher than previous studies8 and reinforces the limited diagnostic value of a single IOP measurement. Furthermore, the finding that approximately 50% of non-indigenous and Indigenous Australians with undiagnosed glaucoma had not accessed an optometry or ophthalmology service in the past 12 months is noteworthy. From a public health perspective, these results emphasise that continued efforts are required to improve awareness of glaucoma and the importance of regular eye examinations in Australia, particularly as early detection is essential for the protection of visual function.
The strengths of this study include its study and sampling design, stratification by Indigenous status and the use of standardised protocols based on that from the Melb VIP.6 A number of limitations must also be considered. First, a gonioscopy was not performed, and therefore, we could not disaggregate glaucoma type (ie, primary open angle vs angle closure). Despite this, previous reports from Australia suggest that rates of primary angle-closure glaucoma are negligible (0.1%).6 Second, as a diurnal IOP variability is well known, a single IOP measurement in each eye is likely to have produced a less sensitive measure than if multiple IOP measurements were adopted. Furthermore, IOP was measured by a rebound iCare tonometer that has been reported to overestimate IOP28 when compared with gold standard applanation tonometry. Therefore, it is possible that the present study overestimated the prevalence of OHT. Third, participants’ visual fields were examined using the N-305 screening protocol of the FDT perimeter, and not by a full-threshold perimetric examination. Finally, the exclusion of optical coherence tomography in the study protocol may have resulted in a reduced sensitivity of glaucoma detection.
Herein we have described the age-specific and Indigenous-specific prevalence estimates of glaucoma in a national population-based sample of Australian adults. In line with previous data from other Caucasian and Asian populations, glaucoma continues to pose a considerable burden in the non-Indigenous Australian population. Given that high rates of undiagnosed glaucoma exist coupled with a significant ageing of the Australian population, improvements in screening methods and access to low vision rehabilitation services may be required to cope with the growing burden of this important cause of blindness.
Acknowledgments
The Centre for Eye Research Australia (CERA) and Vision 2020 Australia wish to recognise the contributions of all the NEHS project steering committee members (HRT, PvW, JFG, Dr Jason Agostino, Anna Morse, Sharon Bentley, Robyn Weinberg, Christine Black, Genevieve Quilty, Louis Young and Rhonda Stilling) and the core CERA research team who assisted with the survey field work (JF, PYL, Rosamond Gilden, Larissa Andersen, Benny Phanthakesone, Celestina Pham, Alison Schokman, Megan Jackson, Hiba Wehbe, John Komser and Cayley Bush). Furthermore, we would like to acknowledge the overwhelming support from all collaborating Indigenous organisations who assisted with the implementation of the survey, and the Indigenous health workers and volunteers in each survey site who contributed to the field work. In-kind support was received from our industry and sector partners, OPSM, Carl Zeiss, Designs for Vision, the Royal Flying Doctor Service, Optometry Australia and the Brien Holden Vision Institute. We would like to specifically acknowledge OPSM, who kindly donated sunglasses valued at $130 for each study participant.
References
Footnotes
Contributors All the authors have contributed to the planning, conduct and reporting of the work described in the article.
Funding The National Eye Health Survey was funded by the Department of Health of the Australian Government, and also received financial contributions from Novartis Australia and the Peggy and Leslie Cranbourne Foundation. This work was supported by the Department of Health of the Australian Government, an NHMRC Career Development Fellowship (#1090466, MD), the Peggy and Leslie Cranbourne Foundation and Novartis Australia. The Centre for Eye Research Australia receives Operational Infrastructure Support from the Victorian Government.
Competing interests None declared.
Patient consent Obtained.
Ethics approval The protocol was approved by the Royal Victorian Eye and Ear Hospital Human Research Ethics Committee (HREC-14/1199H) as well as state-based Indigenous ethics organisations.
Provenance and peer review Not commissioned; externally peer reviewed.
Data sharing statement The datasets generated during and/or analysed during the current study may be available from the corresponding author on reasonable request.
Linked Articles
- At a glance