Article Text

Abstract
Background/aims Current understanding of the alterations in the retinal vascular network in neuromyelitis optica spectrum disorders (NMOSDs) is limited. We aim to assess the peripapillary and parafoveal vessel density in aquaporin-4 antibody-positive NMOSD patients by optical coherence tomography (OCT) angiography.
Methods A total of 55 aquaporin-4 antibody-positive NMOSD patients with or without a history of optic neuritis (ON) and 33 healthy controls underwent spectral domain OCT and OCT angiography. Clinical histories, Expanded Disability Status Scale score, visual functional system score (VFSS) and disease duration were collected.
Results Peripapillary and parafoveal vessel density was significantly decreased in NMOSD eyes with or without a history of ON. The decrease in retinal vessel density could occur before ON and retinal nerve fibre layer (RNFL) atrophy. Peripapillary vessel density correlated well with the spectral domain OCT measurements and VFSS in NMOSD eyes with a history of ON.
Conclusion Subclinical primary retinal vasculopathy may occur in NMOSD prior to ON and RNFL atrophy. Peripapillary vessel density might be a sensitive predictor of visual outcomes in NMOSD patients with ON.
- neuromyelitis optica spectrum disorders (NMOSD)
- optic neuritis (ON)
- optical coherence tomography angiography
This is an Open Access article distributed in accordance with the Creative Commons Attribution Non Commercial (CC BY-NC 4.0) license, which permits others to distribute, remix, adapt, build upon this work non-commercially, and license their derivative works on different terms, provided the original work is properly cited and the use is non-commercial. See: http://creativecommons.org/licenses/by-nc/4.0/
Statistics from Altmetric.com
- neuromyelitis optica spectrum disorders (NMOSD)
- optic neuritis (ON)
- optical coherence tomography angiography
Introduction
Neuromyelitis optica spectrum disorders (NMOSDs) are idiopathic inflammatory diseases of the central nervous system (CNS) with a mostly relapsing disease course. Clinically, NMOSD is characterised by severe attacks of optic neuritis (ON), longitudinally extensive transverse myelitis and brainstem encephalitis including postrema syndrome. Aquaporin-4 antibody (AQP4-ab) is detected in up to 80% of the patients who meet the clinical and radiologic criteria for NMOSD. It has been proven to be directly involved in the pathogenesis of NMOSD and significantly contributes to differentiating NMOSD from multiple sclerosis (MS).1 2
NMOSD is one of the most common CNS inflammatory diseases in China, whereas MS is relatively rare. To date, the epidemiological data on NMOSD in mainland China are limited. However, the number of patients with NMOSD is estimated at 8–10 times as many as that of MS in the NMO-MS clinic of Shanghai Huashan Hospital and Eye & ENT Hospital of Fudan University (Shanghai, China). According to our recent report on a large Chinese cohort with AQP4-ab-positive NMOSD, 45.5% of the patients had an ON attack at disease onset and 64.1% experienced ON at least once during the whole course.3 Patients presenting with ON at onset had a higher relapse rate and probability of subsequent involvement of other CNS regions.3 NMOSD-related ON has been reported to cause severe vision impairment after a single ON episode, extensive optic nerve lesion longer than that of MS and profound thinning of retinal nerve fibre layer (RNFL), indicating diffuse axonal injury.4–6 However, current understanding of the changes in the retinal vascular network in NMOSD is limited. Recently, attenuation of the peripapillary vascular tree and focal arteriolar narrowing were observed in NMOSD eyes through funduscopy.7 As cerebral and retinal vasculatures are anatomically interconnected and share similar features, a retinal vascular study may shed light on the underlying pathogenesis of NMOSD.
Optical coherence tomography (OCT) angiography is a novel non-invasive method that can generate high-resolution information on retinal blood vessels. The present study aimed to assess the retinal vascular network through OCT angiography in AQP4-ab-positive NMOSD patients with or without a history of ON to further explore the vascular abnormalities in NMOSD and evaluate their correlation to clinical outcomes.
Materials and methods
Subjects
From June 2015 to June 2017, we evaluated 110 consecutive eyes of 55 patients with NMOSD who were admitted to the NMO-MS clinic of Huashan Hospital and Eye & ENT Hospital of Fudan University. NMOSD was diagnosed according to the 2015 criteria of the International Panel for NMO Diagnosis.8 The inclusion criteria for patients were as follows: best corrected visual acuity (BCVA) of the eye with better eyesight ≥20/400; no ON attack within the last 3 months before enrolment; refraction error within +3.00 to −8.00; able to cooperate with OCT and visual field (VF) examination; and serum AQP4-ab positive. All of the patients received a clinical neurological examination with evaluation of the Expanded Disability Status Scale (EDSS) on the same day of OCT/angiography assessment. The demographic and clinical data of the NMOSD patients are listed in table 1. The relapse preventative regimens for the patients were azathioprine (n=27), mycophenolate mofetil (n=4), cyclophosphamide (n=4), tacrolimus (n=4), rituximab (n=4) and intermittent intravenous immunoglobulin (n=1). The remaining 11 patients were not receiving any preventive medications at the time of inclusion for different reasons. AQP4-ab was examined for the diagnosis of AQP4-ab-positive NMOSD; it was not tested on the day of OCT/angiography assessment.
The demographic and clinical data of the patients with NMOSD and healthy controls
The history of ON was defined in the presence of acute relapse lasting more than 24 hours and associated with decreased high-contrast visual acuity, eye movement pain, colour vision and/or VF impairments or optic nerve enhancement visualised by MRI.
Among the 110 eyes examined, two eyes were excluded because of poor OCT image qualities, and the remaining 108 eyes were further divided into two groups: (1) NMOSD+ON group: eyes with a history of ON, which comprised 52 eyes from 33 patients; and (2) NMOSD-ON group: eyes with no history of ON, consisting of 56 eyes from 34 patients.
A total of 66 eyes of 33 age-matched and sex-matched healthy subjects with BCVA ≥20/25 and a normal ophthalmic examination were included in the study as controls. The exclusion criteria for patients and controls were as follows: the presence of corneal scarring, cataract or obvious vitreous opacity, which can affect the transparency of refracting media; presence of pathological myopia, retinal vein occlusion, diabetic retinopathy, hypertensive retinopathy, age-related macular degeneration, glaucoma, non-arteritic anterior ischaemic optic neuropathy, congenital eye disorders and other fundus diseases; history of eye trauma or eye surgery; presence of chronic diseases such as hypertension, diabetes, coronary heart disease and chronic obstructive pulmonary disease; intravenous or oral steroids in the prior 30 days; long-term antihypertensive and antiarrhythmic medication; and history of hydroxychloroquine, ethambutol or tamoxifen medication.
The study wasperformed in accordance with the Declaration of Helsinki and its later amendments. Written informed consent was obtained from all of the subjects.
AQP4-ab detection
Serum AQP4-ab status was evaluated with an indirect cell-based immune-fluorescence testin assay (EUROIMMUN AG, Luebeck, Germany).
Basic ophthalmic examination
All of the patients and healthy controls underwent slit lamp and ophthalmoscopy examination to exclude potential eye diseases. The mean artery pressure (MAP) and mean ocular perfusion pressure (MOPP) were calculated. Intraocular pressure (IOP), refraction error and axis length were measured and compared between the patient and the control groups to ensure that basic eye conditions were comparable. The BCVA was assessed using a Snellen chart. The central VF was assessed using a Humphrey Field analyzer 750 with a Swedish Interactive Thresholding Algorithm SITA standard 30–2 test program (Carl Zeiss Meditec, Dublin, California, USA).
Spectral domain OCT
Avanti RTVue-XR (Optovue, Fremont, California, USA; software V.2017.100.0.1) with an axial scan speed of 100 KHz using a 840 nm wavelength laser with a tuning range of 100 nm was used in spectral domain OCT assessment after pupillary dilation. The image resolution was 5.3 mm axially and 18 mm laterally. The peripapillary RNFL thickness was obtained using the optic nerve head map protocol, with a scanning range covering a circle 3.45 mm in diameter centred on the optic disc. The ganglion cell complex (GCC) thickness was acquired using the GCC scanning protocol, which generates the data through scans centred 1 mm temporal to the fovea and covered a square grid (7 mm × 7 mm) on the central macula. Only high-quality images with signal strength index ≥40 were accepted according to the OSCAR-IB criteria.9
OCT angiography
OCT angiography images were obtained using Avanti RTVue-XR, which is based on split-spectrum amplitude decorrelation algorith.
To evaluate peripapillary perfusion, cross-sectional registered reflectance intensity images and flow images were summarised and viewed as an en face maximum flow projection. Radial peripapillary capillary network was obtained in scans within a 0.7 mm wide elliptical annular region extending outward from the optic disc boundary, and the vasculature within the internal limiting membrane and the nerve fibre layer were analysed automatically using the software (figure 1). A parafoveal capillary network was acquired through scans within the annular zone of 0.6 mm–2.5 mm diameter around the foveal centre, and the superficial capillary layer from 3 µm down below the internal limiting membrane to the outer boundary of the inner plexiform layer was analysed (figure 1). Meanwhile, the software automatically generated the thickness of parafoveal ganglion cell and inner plexiform layer (GCIPL) corresponding to the range of parafoveal area and the depth of superficial capillary layer. Vessel densities, defined as the percentage area occupied by the large vessels and microvasculature in the analysed region, were automatically generated in the whole scan area and in all sections of applied grid according to the ETDRS.10

Image analysis of OCT angiography of the parafoveal and peripapillary area. (A) Parafoveal capillary network was acquired through scans within the annular zone of 0.6 mm to 2.5 mm diameter around the foveal centre (between yellow and blue lines), and the superficial capillary layer from 3 µm down below the internal limiting membrane to the outer boundary of the inner plexiform layer (between red and green lines) were analysed. (B) Radial peripapillary capillary network was obtained in scans within a 0.7 mm wide elliptical annular region extending outward from the optic disc boundary (between yellow and blue lines), the vasculature within the internal limiting membrane and the nerve fibre layer were analysed (between red and green lines). OCT, optical coherence tomography.
The quality of OCT angiography images were evaluated by two independent ophthalmologists blinded to the subject’s diagnostic category. Poor quality images with a signal strength index <40 or with residual motion artefacts were rejected. The OCT data acquisition and report in this study was in alignment with the Advised Protocol for OCT Study Terminology and Elements (APOSTEL) recommendations.11
Statistical analysis
Statistical analysis was performed using IBM SPSS V.20.0 for Windows. Differences in demographics and basic ophthalmic parameters among the cohorts were tested using one-way analysis of variance or Kruskal-Wallis test. Comparisons of spectral domain OCT parameters and OCT angiography parameters between the cohorts were performed using generalised estimating equation (GEE) models accounting for intrasubject inter-eye dependencies. GEE results are provided with regression coefficient (B) and SE. Correlations between OCT angiography parameters and spectral domain OCT measurements, and also between OCT angiography parameters and clinical measurements were detected using the GEE models. Statistical significance was set at p<0.05. Due to the exploratory nature of this study, no correction for multiple comparisons was performed.
Results
Basic ophthalmic assessment
The MAP, MOPP, IOP, AL, spherical refraction error and BCVA of the NMOSD+ON, NMOSD-ON and healthy control groups were compared. No significant differences in these baseline ophthalmic parameters were observed among the three groups, except for BCVA (see online supplementary file 1).
Supplemental material
Spectral domain OCT
RNFL thickness
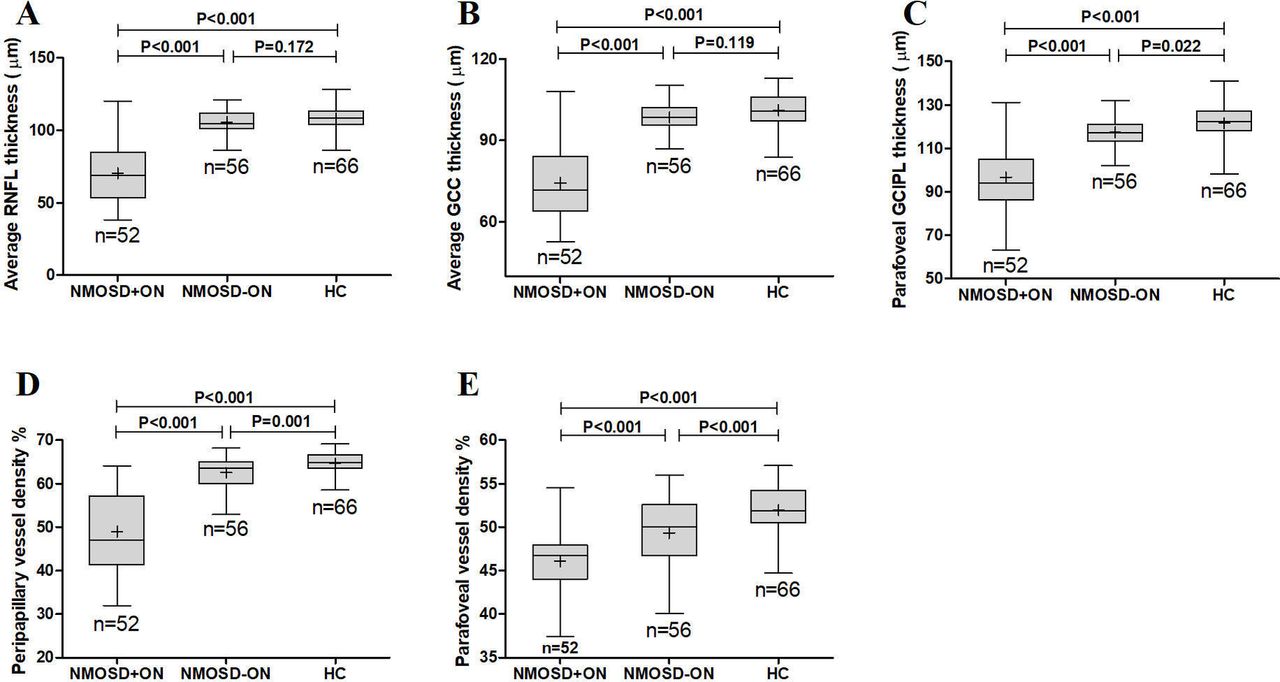
The average RNFL thickness of the NMOSD+ON group was 70.3±19.8 µm (range: 38~120 µm), significantly lower compared with the healthy control group (108.3±8.1 µm, range: 86.00~128.00 µm; GEE B=37.905, SE=3.036, p<0.001) and the NMOSD-ON group (105.5±8.5 µm, range: 86.00~121.00 µm; GEE B=35.166, SE=3.091, p<0.001). The average RNFL thickness of the NMOSD-ON group was not significantly different from that of the healthy control group (GEE B=2.640, SE=1.934, p=0.172) (figures 2 and 3A).

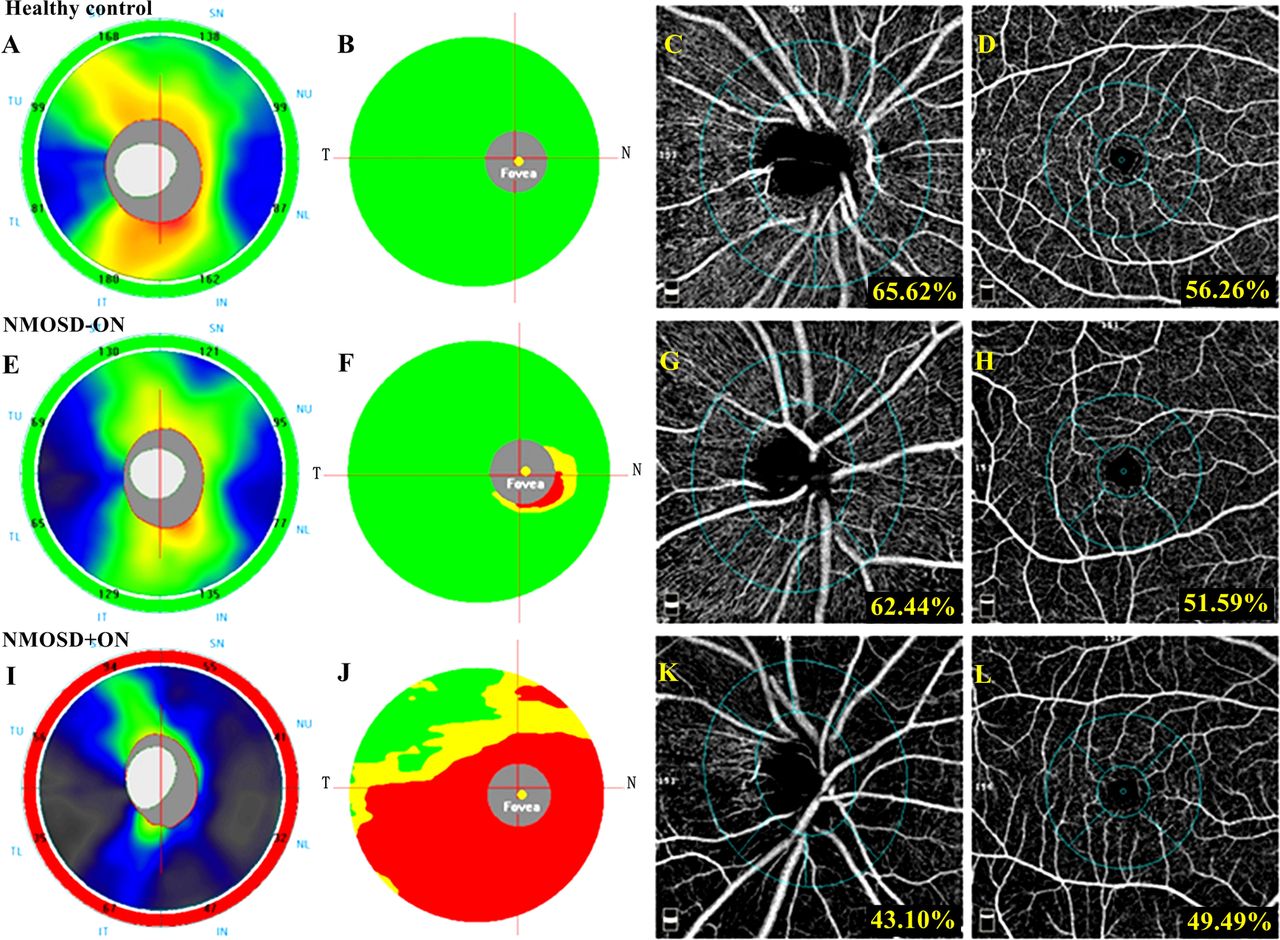
The spectral domain OCT and OCT angiography outcomes of a healthy eye, an NMOSD eye without history of ON and an NMOSD eye with a history of ON. In the first line, a healthy eye shows a normal RNFL (A) and GCC (B) thickness at spectral domain OCT and a normal peripapillary (C) and parafoveal (D) vessel density at OCT angiography. In the second line, an NMOSD eye without a history of ON exhibited RNFL thickness within the normal range (E), mild GCC thinning in the inferior nasal sector (F) and decreased vessel density in the peripapillary (G) and parafoveal (H) region. In the third line, an NMOSD eye with a history of ON shows severe thinning of the RNFL (I) and GCC (J) and diffusely decreased vessel density in the peripapillary (K) and parafoveal (L) regions. GCC, ganglion cell complex; NMOSD, neuromyelitis optica spectrum disorders; OCT, optical coherence tomography; ON, optic neuritis; RNFL, retinal nerve fibre layer.

The comparison of average RNFL thickness (A), average GCC thickness (B), parafoveal GCIPL thickness (C), peripapillary vessel density (D) and parafoveal vessel density (E) among the NMOSD eyes with a history of ON, NMOSD eyes without a history of ON and healthy control eyes. GCC, ganglion cell complex; GCIPL, ganglion cell and inner plexiform layer; HC, healthy control; NMOSD, neuromyelitis optica spectrum disorders; ON, optic neuritis; RNFL, retinal nerve fibre layer.
GCC thickness
The average GCC thickness was significantly lower in the NMOSD+ON group (74.2±14.0 µm, range: 52.6~108.0 µm) than in the healthy controls (101.2±6.5 µm, range: 83.8~113.1 µm; GEE B=27.010, SE=2.206, p<0.001) and the NMOSD-ON group (98.6±5.1 µm, range: 86.9~110.3 µm; GEE B=24.428, SE=2.069, p<0.001). The GCC thickness of the NMOSD-ON group was not significantly different compared with the healthy controls (GEE B=2.213, SE=1.418, p=0.119) (figures 2 and 3B).
Parafoveal GCIPL thickness
The parafoveal GCIPL thickness was remarkably lower in the NMOSD+ON group (96.6±15.1 µm, range: 63.0~131.0 µm) compared with the NMOSD-ON group (117.4±6.4 µm, range 102.0~132.00 µm; GEE B=20.841, SE=2.628, p<0.001) and the healthy controls (121.6±7.6 µm, range 98.0~141.0 µm; GEE B=24.852, SE=2.739, p<0.001). Moreover, the parafoveal GCIPL thickness was significantly lower in the NMOSD-ON group compared with the healthy controls (GEE B=3.909, SE=1.703, p=0.022) (figure 3C).
OCT angiography
Peripapillary vessel density
The peripapillary vessel density in the NMOSD+ON group (49.0%±8.6%, range: 32.0%~64.1%) was significantly reduced compared with the healthy controls (64.7%±2.4%, range: 58.6%~69.2%; GEE B=15.702, SE=1.272, p<0.001) and the NMOSD-ON group (62.5%±3.6%, range: 52.9%~68.2%; GEE B=13.519, SE=1.355, p<0.001). We also observed that the peripapillary vessel density significantly decreased in the NMOSD-ON group than in the healthy controls (GEE B=2.223, SE=0.669, p=0.001) (figures 2 and 3D).
Parafoveal vessel density
The parafoveal vessel density was dramatically reduced in the NMOSD+ON group (46.1%±3.5%, range: 37.4%~54.5%) compared with the NMOSD-ON group (49.3%±3.9%, range: 40.1%~56.0%; GEE B=3.401, SE=0.755, p<0.001) and the healthy controls (52.0%±3.0%, range: 44.7%~57.1%; GEE B=5.947, SE=0.641, p<0.001). Parafoveal vessel density also decreased in the NMOSD-ON group compared with the healthy controls (GEE B=2.571, SE=0.690, p<0.001) (figures 2 and 3E).
As optic nerve is often affected near the chiasm in NMOSD, and potential carry-over effects may impact the retina of the contralateral fellow eye after unilateral ON.12 To exclude such impact on the data of the NMO-ON group, we excluded the contralateral fellow eyes of 12 patients with only one eye affected from the NMOSD-ON group and run the comparison again. We additionally observed that the GCC thickness of the NMOSD-ON group was significantly lower compared with the healthy controls (GEE B=3.159, SE=1.441, p=0.028). The remaining results were similar (see online supplementary file 2).
Supplemental material
The correlation between OCT angiography parameters and spectral domain OCT parameters
In the NMOSD+ON group, significant positive correlations were observed between average RNFL or GCC thickness and peripapillary vessel density in all of the sectors. Average RNFL and GCC thickness was also positively correlated with parafoveal vessel density in average and some sectors (table 2A). In the NMOSD-ON group, average parafoveal vessel density positively correlated with average GCC thickness (table 2B).
The correlation between OCT angiography parameters and spectral domain OCT parameters or VFSS
The correlation between OCT angiography parameters and visual outcome
In the NMOSD+ON group, significant inverse correlations were observed between VFSS and peripapillary vessel density in average and all of the sectors (except superior nasal) (table 2A). No significant correlations were found between vessel density parameters and disease duration in either group. No significant correlations between vessel density parameters and the number of ON episodes were detected in the NMOSD+ON group.
Discussion
Previous investigations support the concept of NMOSD as a primary astrocytopathy. The end feet of astrocytes, where AQP4 is highly expressed, physically connect to the brain capillary walls and aid in the maintenance of the blood–brain barrier (BBB) function. A recent investigation has revealed that NMO immunoglobulin G pooled from patient sera induces interleukin (IL)-6 production by AQP4-positive astrocytes and that IL-6 signalling to the vascular endothelial cells decreases barrier function, increases chemokine production and enhances leucocyte transmigration in an in vitro BBB model.13 14 Moreover, the concept of astrocyte-associated vascular change has been supported by multiple laboratories, which state that astrocytes play a key role in regulating local cerebrovascular microcirculation.15–19 In the retina, there exist AQP4 expressing astrocytic cells called ‘Müller cells’, which might be directly targeted by AQP4-ab and become a potential cause of primary retinopathy in NMOSD.20 21 Furthermore, vascular changes have been detected by funduscopy in NMOSD-affected eyes.7 Although the relationship between Müller cell inflammation and retinal vascular changes needs further validation, it is reasonable to postulate that vascular alterations are involved in the pathogenesis of NMOSD and NMOSD-related ON.
In the current investigation, we used OCT angiography to examine peripapillary and parafoveal vessel changes in NMOSD eyes. The main finding of our study is the significantly reduced peripapillary and parafoveal vessel density in NMOSD eyes with or without a history of ON. The results provide clear evidence that vascular changes occur in NMOSD eyes even prior to the development of ON, indicating subclinical primary retinal vasculopathy. Such subclinical retinal vasculopathy was not observed in similar studies on MS.22 23 Considering the previous evidence supporting the astrocyte-associated vascular change,15–19 it will be of great interest to further elucidate the connection between retinal vascular impairment and AQP4-ab-mediated Müller cell inflammation.
Unsurprisingly, we found a remarkable reduction of RNFL, GCC and GCIPL thickness in NMOSD eyes with a history of ON, similar to previous observations.20 The RNFL and GCC thickness of the unaffected eyes did not differ from the healthy controls. However, the parafoveal GCIPL thickness of the unaffected eyes significantly decreased. Compared with GCC, GCIPL thinning is a more specific indicator of ganglion cell loss as it is not interfered by RNFL. Our results transmit important information that subclinical retinal neuronal damage may occur prior to RNFL atrophy and ON, which agrees with the observations of other groups.24–26 The ON-independent thinning of GCIPL indicates primary retinopathy, which is highly probable to be the consequence of reduced energy supply due to decreased retinal perfusion, as indicated by our results. As the GCIPL data were collected in the parafoveal area, which is characterised by a high density of Müller cells, AQP4-ab-mediated chronic Müller cell inflammation is very likely to be responsible for the subclinical neuronal loss. This theory is supported by the experimental study conducted by Felix et al,21 who showed that the passive transfer of NMO anti-AQP4 autoantibodies by intravitreal injection into rat eyes resulted in a significant loss of Müller cell AQP4 expression with a gliotic response, microglial activation and mild retinal ganglion cell loss.
In NMOSD-affected eyes, the peripapillary and parafoveal vessel densities correlated well with the spectral domain OCT parameters, suggesting that the vascular changes are related to structural damages involving the retina. In unaffected eyes of patients with NMOSD, a positive correlation can be observed between average parafoveal vessel densities and average GCC thickness, suggesting that these subclinical changes may be interconnected to a certain extent.
Due to the cross-sectional nature of our study, we cannot demonstrate whether vascular alterations are secondary to less energy requirements from the atrophied retina or a primary process causing a generalised ischaemia with secondary retina atrophy. However, the retinal perfusion reduction already exists before RNFL thinning and the occurrence of ON highly implies that vascular changes might be a primary process. This notion can be further supported by the absence of correlation between all of the OCT angiography parameters and disease duration, as well as the number of ON episodes.
We observed that peripapillary vessel densities were negatively correlated with VFSS in the NMOSD+ON group. This indicates that patients with poorer peripapillary perfusion may present with more severe VF or visual acuity impairment and that peripapillary vessel density may be a surrogate predictor of visual outcomes in NMOSD patients with ON.
In conclusion, we hereby show evidence of reduced peripapillary and parafoveal blood perfusion in NMOSD eyes with or without a history of ON. The decrease in retinal perfusion could occur before ON and RNFL atrophy, suggesting a subclinical primary retinal vasculopathy. Peripapillary vessel density might be predictive of visual outcomes in NMOSD patients with ON. Our results should be further validated in a large-scale, multicentre, international collaborative study.
Acknowledgments
We would like to thank LetPub (www.letpub.com) for providing linguistic assistance during the preparation of this manuscript.
References
Footnotes
YH and LZ contributed equally.
Contributors YH: OCT data acquisition and analysis, draft of the manuscript and study design. LZ: data acquisition and analysis, revision of the manuscript and study concepts. JZ: data acquisition and analysis and literature research. TC, BW, XL and LW: clinical history acquisition and analysis. CL: study concept and supervision. CZ: study concept and design. JL: study concept and design and manuscript review. CQ: critical revision of the manuscript for important intellectual content, study concept and design and manuscript final version approval. MW: critical revision of the manuscript for important intellectual content, study concept and design and study supervision.
Funding This work was supported by the National Natural Science Foundation of China (NSFC) grant number 81771296 and the National Key Research and Development Program of China grant number 2016YFC0901504.
Competing interests None declared.
Patient consent Obtained.
Ethics approval The study was approved by the Medical Ethics Committee of Huashan Hospital and Eye & ENT Hospital of Fudan University.
Provenance and peer review Not commissioned; externally peer reviewed.
Linked Articles
- At a glance