Article Text

Abstract
Aim To analyse quantitative optical coherence tomography angiography (OCTA) parameters of choriocapillaris (CC) at the foveal, perifoveal and parafoveal regions in healthy subjects of different age.
Methods In this observational cross-sectional study, consecutive healthy subjects underwent swept source OCTA (PLEX Elite 9000, Carl Zeiss Meditec, USA). 3×3 mm and 6×6 mm scans centred on the fovea were acquired analysed and postprocessed with thresholding and binarisation processes. The main outcome measures included CC quantitative OCTA features (perfusion density (PD), vessel length density (VLD) and vessel diameter index (VDI)) at the foveal, perifoveal and parafoveal regions, and their relationship with age.
Results Seventy-two eyes (72 patients, mean age 47.4±19.2 years, mean axial length 24.0±0.7 mm) were included. The mean PD was statistically lower in the foveal region compared with the parafoveal region in 3×3 mm scans (p=0.009). In subjects aged 70–80, PD of the foveal region was significantly reduced compared with the perifoveal region in 6×6 mm scans (p=0.008). A strong negative correlation was found between PD and ageing in the foveal, parafoveal and perifoveal regions (p<0.001 in all analyses). Furthermore, PD in the nasal-perifoveal region was significantly lower than the temporal-perifoveal region (p=0.005). No significant correlation was found between VLD and age in all regions, whereas VDI was strictly correlated with age (p<0.001).
Conclusions We reported in vivo a strong negative correlation between PD and ageing in the CC of healthy subjects. This reduction seems related to a reduced diameter, and not to a reduced number, of capillaries. The age-related changes were higher in the central area compared with the perifoveal area.
- aging
- choriocapillaris
- healthy subjects
- optical coherence tomography angiography
- perfusion density
- vessel density
- vessel diameter index
- vessel length density
Statistics from Altmetric.com
- aging
- choriocapillaris
- healthy subjects
- optical coherence tomography angiography
- perfusion density
- vessel density
- vessel diameter index
- vessel length density
Introduction
The choriocapillaris (CC) is a dense network of wide-bore capillaries with sac-like dilatations lined by a continuous layer of fenestrated endothelial cells and supported by delicate connective tissue. It nourishes the overlying retinal pigment epithelium (RPE) and photoreceptors, helping to keep the health of the outer retina.
Multiple histopathological studies in animal models and human eyes have revealed that the CC is characterised by a decrease in density and diameter with age.1 2 Despite recent advances in retinal imaging, the visualisation of the CC in vivo may still be challenging. For this reason, although many studies based on structural optical coherence tomography (OCT) reported an overall decrease in choroidal thickness (ChT) with age,3–6 these studies failed to provide a detailed profile of CC. Wakatsuki et al 7 investigated the structural changes occurring in choroidal layers with a swept source (SS)OCT, and displayed that the thinning of CC plus the Sattler’s layer was strongly correlated with age.
The recent introduction in clinical practice of OCT angiography (OCTA) has overcome some limits of the traditional imaging techniques as it provides depth-resolved high-resolution imaging of the retina and choroidal vasculature.8 In this regard, OCTA can isolate the CC and consequently quantify its blood flow. Nevertheless, very limited information has been reported about the CC changes with ageing using OCTA. Spectral domain OCTA (SD-OCTA) uses an 840 nm wavelength, which has limited ability to penetrate the RPE, compromising the assessment of the CC. On contrary, SS-OCTA uses a longer wavelength (1050 nm), offering a deeper penetration of the light and improving the images’ quality of the CC meshwork.9–11 In this study, we analysed quantitative OCTA parameters of CC (perfusion density (PD), vessel length density (VLD) and vessel diameter index (VDI)) at the foveal, perifoveal and parafoveal regions in healthy people of different age. The information from such analysis is of paramount importance, considering that CC loss may contribute to several retinal and choroidal disorders, including age-related macular degeneration (AMD).12–16
Methods
In this observational cross-sectional study, we analysed the images of consecutive healthy subjects from the Medical Retina and Imaging Unit of San Raffaele Hospital (Milan, Italy) visited by the senior author (GQ) between June 2017 and March 2018. All individuals had no ocular disorders and were submitted to multimodal imaging evaluation as part of their standard clinical examination. Written informed consent was obtained from patients to allow analysis of the collected data.
The inclusion criteria were (1) patients older than 18 years, and (2) adequate pupillary dilation and fixation to permit execution of OCTA imaging.
The exclusion criteria were (1) history of any relevant ocular diseases (including amblyopia, AMD, diabetic retinopathy, uveitis or pathological myopia); (2) relevant opacities of the optic media and low-quality images; (3) refractive error greater than +5 dioptres (D) or −6D of sphere or ±3D of cylinder; (4) axial length (AL) greater than 25.5 mm or inferior than 20.0 mm; (5) ocular surgery within 1 year of enrolment; and (6) presence of diabetes mellitus, uncontrolled hypertension and/or other cardiovascular diseases identified by their internists and general practitioners.
If both eyes of a patient can be included in the study, only one eye was randomly chosen and included.
All included patients underwent a complete ophthalmological examination, including best-corrected visual acuity (BCVA) on the Snellen chart, measurement of AL, infrared reflectance (IR), structural SD-OCT and OCTA. AL was obtained using IOLMaster (Carl Zeiss Meditec AG, Jena, Germany), whereas IR and structural SD-OCT were obtained using Spectralis Heidelberg Retinal Angiography + OCT (Heidelberg Engineering, Heidelberg, Germany).
OCTA imaging
Patients underwent SS-OCTA imaging using PLEX Elite 9000 (Carl Zeiss Meditec, Dublin, California, USA), including 3×3 mm and 6×6 mm scans centred on the fovea. Only OCTA volume scans with signal strength index (SSI) >7 were included in the analysis.
A fully automated retinal layer segmentation algorithm was applied to the three-dimensional structural OCT data, in order to segment the CC slab (20 µm thick starting from 29 µm posterior to the RPE reference). This segmentation was then applied to OCTA flow intensity data to obtain vascular images. The automated segmentation of CC was verified in each case by a senior retinal specialist (GQ) in order to check for segmentation error.
Image analysis
The image-processing algorithm to investigate the CC variables is illustrated in online supplementary efigure 1. The obtained averaged CC en face images (3×3 mm and 6×6 mm) were then exported and analysed using ImageJ V.1.50 software (National Institutes of Health, Bethesda, Maryland; available at http://rsb.info.nih.gov/ij/index.html)17 and binarised using the Phansalkar method (radius, 15 pixels) for quantitative image analysis of the signal voids.18–21 These images were then processed with the ‘Analyze Particles’ command in order to count and measure the flow voids, as previously shown.18–20
Supplemental material
Subsequently, images were inverted, and the morphology of the vessels was investigated as follows: (1) PD, defined as the ratio of the area occupied by the vessels divided by the total area; (2) VLD, which is the total vessel length divided by the total number of pixels in the analysed skeletonised image, in which the vessels are visualised as traces of 1 pixel in width; and (3) VDI, which represents the average vessel calibre and was calculated by dividing the PD by the VLD.
The CC regions directly beneath the major superficial retinal vessels were masked and excluded from analysis in order to limit shadowing artefacts from confounding the analysis. To identify the superficial vessels, the ‘MaxEntropy’ threshold was applied to the superficial capillary plexus image in order to identify the large superficial retinal vessels, as previously shown.18–21 This thresholded image was then merged to the CC images in order to allow analysis of the CC after removal of the superficial vessels.
Notably, we performed a topographical analysis of the CC variables.
The 3×3 mm images were investigated in a circle centred on the foveal pit using structural cross-sectional OCT (foveal region—radius of 0.5 mm) and in a circular annulus around the fovea (parafoveal region—radius of 1.5 mm) (online supplementary efigure 2).
Supplemental material
According to the ETDRS charts, the 6×6 mm images were investigated in a circle centred on the foveal pit using structural cross-sectional OCT (foveal region—radius of 0.5 mm) and in two concentric circular annuli around the fovea (parafoveal and perifoveal regions—radius of 1.5 mm and 3 mm, respectively). These annuli were divided into four regions (superior (S), nasal (N), inferior (I) and temporal (T)) (online supplementary efigure 2).
Statistical analysis
Data collected were analysed using SPSS Statistics V.20. Quantitative variables were expressed as mean±SD, and categorical variables as count and percentage. The Gaussian distribution of continuous variables was verified with the Kolmogorov-Smirnov test. Comparisons of PD, VLD and VDI between the foveal and parafoveal regions in 3×3 mm OCTA scans were performed with the Student’s independent samples t-test. Comparison of SSI between 3×3 mm and 6×6 mm OCTA scans was performed with the Student’s independent samples t-test. Also, comparisons of PD between patients affected by controlled systemic hypertension and not and between phakic and pseudophakic eyes were assessed with the Student’s independent samples t-test. Comparisons of PD among the foveal, parafoveal and perifoveal regions in 6×6 mm OCTA scans were performed using analysis of variance (ANOVA) with Bonferroni post-hoc analysis. Correlations between age with PD, VLD and VDI were verified with linear regression analysis. Correlations between PD with BCVA, AL and SSI were verified with Pearson’s correlation analysis. In all analyses, p values <0.05 were considered statistically significant.
Results
A total of 72 eyes of 72 Caucasian patients (38 women and 34 men) were imaged during the study period. The mean age was 47.4±19.2 years (median 47; range 20–80), the mean AL was 24.0±0.7 mm (median 24.0; range 21.7–25.3) and BCVA was 20/20 in all patients. The distribution of subjects in each decade is reported in table 1A. Five patients were pseudophakic and all other patients were phakic. Of note, according to the exclusion criteria, all patients were not affected by any retinal disease. Six patients were affected by medically controlled essential hypertension and no patients were affected by other cardiovascular diseases or diabetes.
Perfusion density, vessel length density and vessel diameter index in 3×3 mm optical coherence tomography angiography scans according to age
Each eye was analysed using two different en face OCTA images (3×3 mm and 6×6 mm scans) which were segmented at the level of the CC. The mean SSI was 8.2±0.7 (median 8; range 7–10) in 3×3 OCTA images and 8.1±0.7 (median 8; range 7–10) in 6×6 images (p=0.354).
OCTA analysis of 3×3 mm scans
In all 3×3 images, two different regions of interest (ROI) were analysed: a 1 mm circle centred on the fovea (foveal region) and a 3 mm circular annulus around the fovea (parafoveal region) (online supplementary figure 2). The mean PD was statistically lower in the foveal region compared with the parafoveal region (74.197%±4.092% vs 76.009%±4.009%, respectively; p=0.009). As reported in table 1A, this trend was also observed during the subanalysis of each decade of patients.
A strong negative correlation was found between PD and age of patients in both the foveal (r=0.514, p<0.001) and parafoveal (r=0.492, p<0.001) areas (figure 1). The ANOVA also confirmed this correlation during the comparison of mean PD in each decade of patients (F=5.318, p<0.001 and F=6.826, p<0.001 in the foveal and parafoveal regions, respectively) (figure 2). We also compared the results from 3×3 mm OCTA images between every two decades across all age groups. A statistically significant difference in PD was disclosed between subjects aged 20–29 and 30–39 compared with subjects aged 70–80 in the foveal (p<0.001 and p=0.010, respectively) and parafoveal (p<0.001 in both analyses) regions. All six patients affected by controlled systemic hypertension were included in the subjects between 60–69 (three patients) and 70–80 (three patients). The possible influence of controlled systemic hypertension was verified comparing the PD of both the foveal and parafoveal areas between patients with and without the disease in both decades. In the same way, the influence of pseudophakia of five patients (one included in the 60–69 subjects and four included in the 70–80 subjects) was verified. No statistically significant differences were disclosed in all analyses (p>0.1 in all analyses).

Scatterplot for age and choriocapillaris perfusion density (PD) in the foveal region (radius of 0.5 mm; graphic on the left) and of the parafoveal region (radius of 1.5 mm; graphic on the right) of 3×3 mm optical coherence tomography angiography scans showing a negative correlation between age and PD.

Graphics showing the mean perfusion density of the foveal region (radius of 0.5 mm), parafoveal region (radius of 1.5 mm) and perifoveal region (radius of 3.0 mm) in each decade on 3×3 optical coherence tomography angiography (OCTA) scans (graphic on the left) and 6×6 mm OCTA scans (graphic on the right). Error bars were set to 1 SD.
The mean VLD was 11.513%±0.384% and 11.680%±0.424% in the foveal and parafoveal regions, respectively (p=0.015). The mean VDI was also very similar in both the foveal and parafoveal regions (6.446±0.315 and 6.546±0.454, respectively; p=0.131). Interestingly, no correlation was found between VLD and age of patients in both the foveal and parafoveal regions (r=0.159 (p=0.184) and r=0.092 (p=0.443), respectively). This lack of correlation was also confirmed by ANOVA during the comparison of mean VLD in each decade of patients (F=1.368 (p=0.248) and F=0.098 (p=0.992) in the foveal and parafoveal regions, respectively). We also investigated the correlation between VDI and age in order to verify if the reduction of PD was due to a reduction of the diameter of vessels. We disclosed a strict correlation between VDI and age in CC analysis in both the foveal and parafoveal regions (r=0.470 (p<0.001) and r=0.374 (p=0.001), respectively).
No significant correlation was seen associating PD with AL and signal strength in each analysis (p>0.1 in all analyses).
OCTA analysis of 6×6 mm scans
In all 6×6 images, three different ROIs were analysed: a 1 mm circle centred on the fovea (foveal region), a 3 mm circular annulus around the fovea (parafoveal region) and a 6 mm circular annulus around the fovea (perifoveal region) (online supplementary figure 2). Although not statistically significant, the mean PD was slightly lower in the foveal region compared with the parafoveal and perifoveal regions (73.541%±4.238%, 73.849%±3.747% and 74.252%±3.055% in the foveal, parafoveal and perifoveal regions, respectively; p=0.525). This difference became statistically significant in the subgroup of subjects aged 70–80 (p=0.008). In these patients, PD of the foveal region was significantly reduced compared with the perifoveal region (68.168%±2.489% vs 71.118±1.917%, respectively; p=0.006) (table 1B).
Perfusion density in 6×6 mm OCTA scans according to age
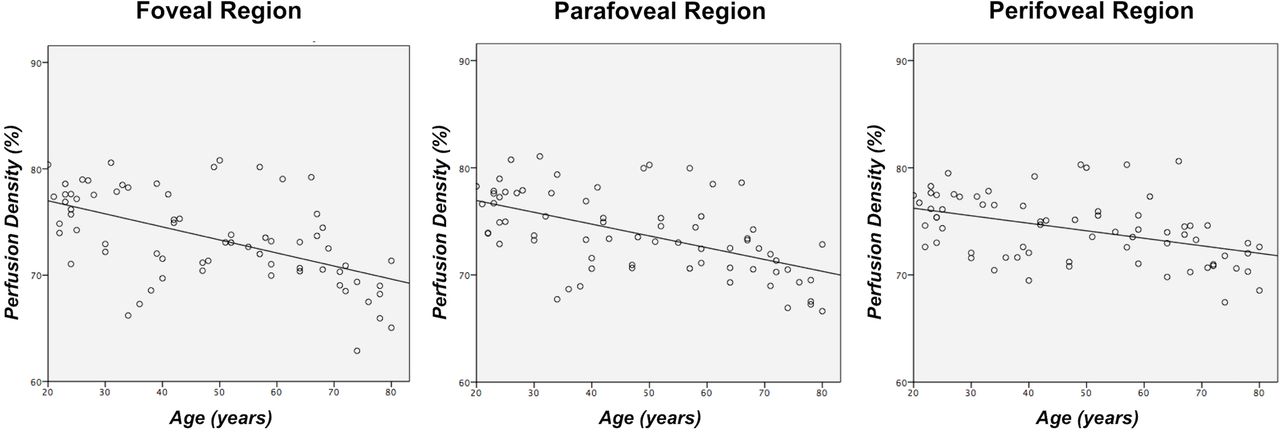
A strong negative correlation was identified between PD and age of patients in the foveal (r=0.551, p<0.001), parafoveal (r=0.559, p<0.001) and perifoveal (r=0.436, p<0.001) regions (figure 3). This PD reduction was also confirmed by ANOVA during the comparison of mean PD in each decade of patients (F=8.849 (p<0.001), F=8.202 (p<0.001) and F=5.291 (p<0.001) in the foveal, parafoveal and perifoveal regions, respectively) (figure 2).

Scatterplot for age and choriocapillaris perfusion density (PD) in the foveal region (radius of 0.5 mm; graphic on the left), parafoveal region (radius of 1.5 mm; graphic in the middle) and perifoveal region (radius of 3.0 mm; graphic on the right) of 6×6 mm optical coherence tomography angiography scans showing a negative correlation between age and PD.
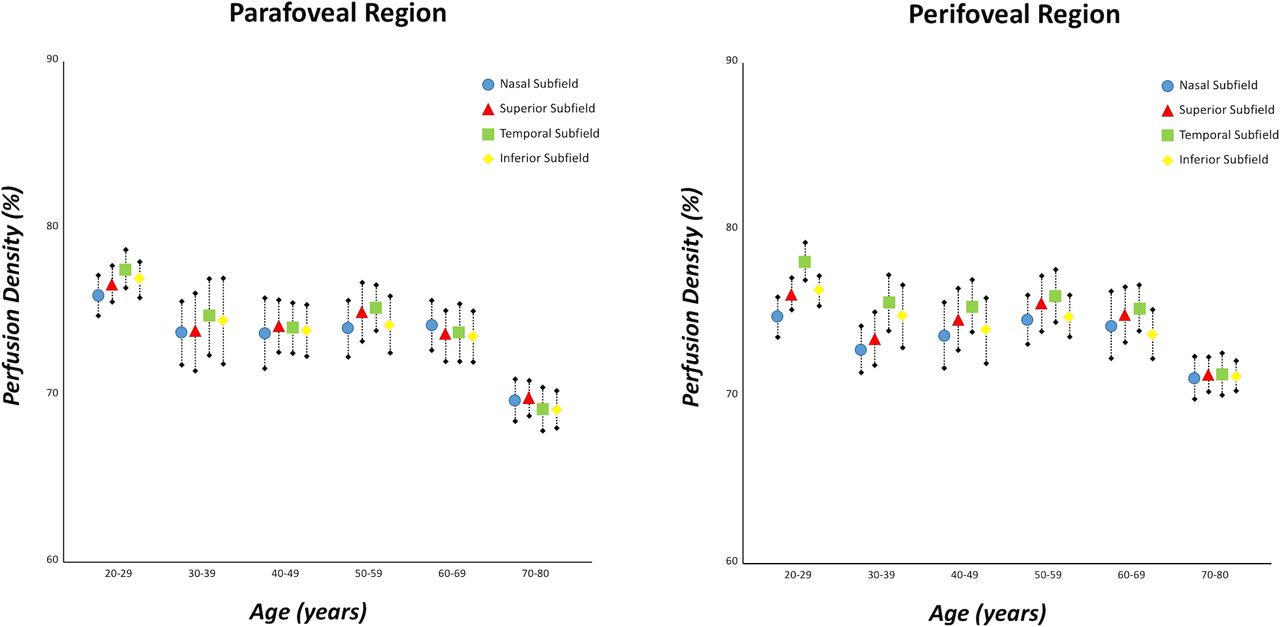
In 6×6 image analysis, parafoveal and perifoveal annuli were divided into four regions to disclose different PDs between these subfields. Analysing all 72 eyes, PD in the N-perifoveal region was significantly lower than the T-perifoveal region (p=0.005). Interestingly, this difference was evident in subjects aged 20–29, but the statistical significance has been lost in the analysis of other decades, due to a reduction of the other perifoveal subfields (table 1B) (figure 4).
Graphics showing the mean perfusion density of different subfields (nasal, superior, temporal and inferior) in each decade on the parafoveal region (radius of 1.5 mm; graphic on the left) and perifoveal region (radius of 3.0 mm; graphic on the right) of 6×6 mm optical coherence tomography angiography scans. Error bars were set to 1 SD.
No significant correlation was seen associating PD with AL and SSI in each analysis (p>0.1 in all analyses).
Discussion
In this cross-sectional study with a cohort of 72 healthy subjects aged 20–80 years, we identified a significant negative association between perfusion of the CC and age. Importantly, this reduction was higher in the foveal area compared with parafoveal and perifoveal regions.
Previous histological studies investigating the CC in healthy patients displayed that the CC vessels are arranged in a monolayer at the fovea, with a progressive increase in the number of layers centrifugally to the macula.22 The association between choroidal vasculature changes and ageing has been extensively described.1 2 Ramrattan et al 1 demonstrated that ageing is associated with choroidal thinning and reduction in CC diameter and density on histologically normal maculae from 95 healthy human eyes aged 6–100 years.
Traditional imaging modalities were not able to confirm these findings on the CC in vivo, since they do not adequately visualise this thin vascular layer. Indeed, dye-based angiography techniques are not depth-resolved, and they do not allow the visualisation of retinal and choroidal vascular plexuses separately. Hence, the small capillaries of the CC are not well visualised using fluorescein angiography or indocyanine green angiography. Although these previous imaging techniques were mainly limited in the visualisation of the CC, technological advancements in structural OCT, including enhanced depth imaging OCT and SS-OCT techniques, provide a non-invasive visualisation of choroidal layers. Therefore, using structural OCT, many authors described a tight correlation between ChT and age in healthy eyes.3–7 However, the resolution of structural SS-OCT is not detailed enough to distinguish the CC layer from the Sattler’s layer and to evaluate CC alone.7 For this reason, Wakatsuki et al 7 considered CC associated with the Sattler’s layer, and found that CC plus the Sattler’s layer correlated strongly with age in 115 eyes of 115 healthy subjects aged 21–85 years.
OCTA has overcome some important limitations of previous imaging techniques, since it visualises retinal and choroidal plexuses in a depth-resolved fashion. Recently, Al-Sheikh et al 23 analysed the vessel density (VD) and grey value of the CC in 36 healthy patients with SS-OCTA. Based on their results, the authors concluded that both the VD ratio and grey value were lower in the subfoveal field than in the pericentral four sectors. Our findings are thus in agreement with these results, as the CC perfusion in the central field resulted significantly lower than the 3 mm and 6 mm regions (tables 1A and 1B). However, Al-Sheikh et al 23 did not assess the relationship between different vascular parameters at the CC level (PD, VLD and VDI) and age.
Our results demonstrated that there was a statistically significant negative correlation between CC PD and age in all the subfields analysed (p<0.001 in all analyses) (figures 1–3). Our data are thus in contrast with the results reported by Wang et al.24 In their study, the authors displayed that the density of the CC network in the central region and in the pericentral region was not significantly associated with age. However, that study was not designed to analyse the correlation between CC vessel changes and ageing, and then the authors did not investigate elderly people where the CC impairment is greater (mean age of 35.9±13.8 years vs 47.4±19.2 years in Wang et al’s24 study and our study, respectively). Furthermore, the Wang and associates study was based on an SD-OCTA device, which is known to be limited in penetrating the RPE, and this could have negatively affected the analysis of the CC. On contrary, we used an SS-OCTA device, which uses a longer wavelength (1050 nm vs 840 nm for SS-OCTA and SD-OCTA, respectively) with an improved sensitivity roll-off, and produces higher A-scan and B-scan densities with more B-scan repeats at each position.9 10 These considerations should be kept in mind and can account for the discrepancies between our study and previous studies.
Importantly, our data are in agreement with the histological findings: histologically normal maculae show a decrease in ChT and a decrease in the density of the CC vessels.1 Of note, the VLD, which represents the total length of the capillaries, was not reduced with ageing in our in vivo results. On contrary, the VDI, which represents the average vessel calibre, significantly decreased with ageing. Based on these results we may speculate that the reduced PD in elderly people may be secondary to a reduced vascular calibre, rather than a reduction in the number of capillaries. Notably, these results are in agreement with previous histological findings, which reported that the decrease in CC density is mainly dependent on a reduced CC diameter.1
In this study, we were also interested in the subfield development of the PD reduction of the CC. Our results showed that there was a higher reduction of the central area compared with the perifoveal area according to age. Indeed, the difference of PD between the foveal and perifoveal regions became statistically significant considering only elderly subjects (p=0.008) (tables 1A and 1B) (figures 1–3). Several studies have elucidated that the vascular endothelial growth factor (VEGF)-A (secreted by the RPE) has an important trophic role on the CC in healthy eyes.25 26 Ageing has been associated with a deposition of lipids in the Bruch’s membrane, resulting in a restriction of the movement of water-soluble agents (including VEGF-A) between the RPE and choroidal layers, which seems to be higher in the foveal area than in the peripheral retina.27–29 These anatomical changes could cause a hypoxic state of the CC, resulting in a reduction of the choriocapillaris’ PD.7 Although alternative explanations cannot be ruled out, we suppose that the greater impairment of foveal PD in comparison with the perifoveal area could be due to the higher lipid accumulation in the fovea compared with the perifoveal area.
Moreover, we investigated different subfields of the perifoveal annulus and demonstrated a lower PD in the N-perifoveal region compared with the T-perifoveal region in subjects aged 20–29 years (p=0.005). These data support those reported in both our study and others’ previous studies based on structural OCT findings, showing that ChT was lower nasally to the fovea compared with the temporal region also in healthy subjects.12 30 In our current analysis, this difference was statistically significant only in subjects aged 20–29 years, probably due to the greater reduction of the other perifoveal subfields in comparison with the nasal region (table 1B) (figure 4).
Limitations of this study should be kept in mind. The small sample size is a major limitation, and some analyses could have been biased by the low statistical power, especially when looking at the age subgroups. Moreover, OCTA technology has intrinsic limitations. Indeed, despite continued technical advancements, we acknowledge that the RPE cells could partially mask and alter the evaluation of the CC. However, we used an SS-OCTA device with a 1050 nm light source, which can penetrate better the RPE and minimise the roll-off with depth. Since projection and shadowing artefacts might confound the analysis of the CC, we felt the safest approach was to determine the region beneath the major superficial vessels and exclude this region from the analysis. However, this approach might have caused inter-region and intersubject differences in the analysed CC area.
In conclusion, we reported in vivo a strong negative correlation between PD of the CC and ageing in healthy subjects, confirming previous histological data. This reduction seems to be due to a reduced diameter of the capillaries and not to a reduced number of capillaries. Furthermore, we found a greater reduction of the central area compared with the perifoveal area according to age, and a greater impairment of the N-subfield than the T-subfield (especially in younger subjects). All these data could be very useful to understand the pathogenesis of retinal diseases, considering that CC loss may contribute to several pathologies, including AMD.
References
Footnotes
Contributors RS, EB, GQ: research design, data acquisition and analysis, interpretation of data, drafting the manuscript and critical revision of the manuscript. EC, AR, LC, AC, MC, FG: data acquisition and analysis, critical revision of the manuscript. FB, LQ: interpretation of data and critical revision of the manuscript.
Funding The authors have not declared a specific grant for this research from any funding agency in the public, commercial or not-for-profit sectors.
Competing interests FB is a consultant for Alcon (Fort Worth, Texas, USA), Alimera Sciences (Alpharetta, Georgia, USA), Allergan (Irvine, California, USA), Farmila-Thea (Clermont-Ferrand, France), Bayer Schering Pharma (Berlin, Germany), Bausch and Lomb (Rochester, New York, USA), Genentech (San Francisco, California, USA), Hoffmann-La Roche (Basel, Switzerland), Novagali Pharma (Évry, France), Novartis (Basel, Switzerland), Sanofi-Aventis (Paris, France), Thrombogenics (Heverlee, Belgium) and Zeiss (Dublin, USA). GQ is a consultant for Alimera Sciences (Alpharetta, Georgia, USA), Allergan (Irvine, California, USA), Bayer Schering Pharma (Berlin, Germany), Heidelberg (Germany), Novartis (Basel, Switzerland), Sandoz (Berlin, Germany) and Zeiss (Dublin, USA).
Patient consent Obtained.
Ethics approval The study adhered to the 1964 Helsinki Declaration and its later amendments. The study was approved by the local institutional review board (Ethics Committee of San Raffaele Hospital).
Provenance and peer review Not commissioned; externally peer reviewed.