Article Text

Abstract
Purpose To compare the foveal microvascular structure characteristics in children with a history of intravitreal injection of ranibizumab (IVR) versus laser photocoagulation (LP) for retinopathy of prematurity by optical coherence tomography angiography (OCTA).
Methods In this cross-sectional study, a total of 17 children (28 eyes) underwent IVR and 20 children (37 eyes) underwent LP were recruited. The age of doing OCTA examination of the two groups are 5.4±1.1 years and 6.3±1.8 years, respectively (p=0.07). Spectral-domain OCTA was performed for all the eyes with a scan size of 3×3 mm. The data of the superficial retinal layer were analysed. The foveal avascular zone (FAZ) and vessel density (including vessel length density (VLD) and perfusion density (PD)) were measured using the software of OCTA (Cirrus AngioPlex 5000, Carl Zeiss, Meditec, Dubin, California, USA). The central foveal thicknesses (CFT) were measured by cross-sectional OCT.
Results In the central fovea, the retinal VLD and PD of patients with IVR were 13.82±2.99 mm/mm2 and 0.25±0.05 mm2/mm2, respectively, which were significantly lower than those of the LP group (15.64±2.71 mm/mm2 and 0.28±0.05 mm2/mm2, p=0.01 and p=0.006). The FAZ area of patients with IVR and LP were 0.13±0.09 mm2 and 0.09±0.07 mm2, respectively (p=0.048). The CFT of patients with IVR and LP were 200.7±16.7 µm and 220.9±22.7 µm, respectively (p<0.01). The logarithm of the minimal angle of resolution best-corrected visual acuity of patients with IVR and LP were 0.2±0.1 and 0.1±0.1, respectively (p=0.01). There was no significant difference in the parafoveal and foveal VLD and PD, FAZ morphological index and spherical equivalent refraction (SER) between the two groups.
Conclusion The IVR might contribute to microvascular changes in the macular zone, such as reducing the central foveal VLD and PD, while the LP might contribute to microstructural changes, such as smaller FAZ and thicker CFT.
- retina
- macula
- imaging
This is an open access article distributed in accordance with the Creative Commons Attribution Non Commercial (CC BY-NC 4.0) license, which permits others to distribute, remix, adapt, build upon this work non-commercially, and license their derivative works on different terms, provided the original work is properly cited, appropriate credit is given, any changes made indicated, and the use is non-commercial. See: http://creativecommons.org/licenses/by-nc/4.0/.
Statistics from Altmetric.com
Introduction
Retinopathy of prematurity (ROP) remains a leading cause of childhood blindness worldwide.1 2 Infants with ROP have a higher incidence of ocular abnormalities, including high refractive error, strabismus, cataract, glaucoma and retinal detachment.3 There are two main treatment methods for ROP currently: antivascular endothelial growth factor (VEGF) treatment and laser photocoagulation (LP). Previous researchers have studied patients’ foveal development after intravitreal injection of ranibizumab (IVR) and/or LP using optical coherence tomography (OCT),4–7 while other researchers studied the foveal microvascular structure using fundus fluorescein angiograms (FFA).8 The OCT angiography (OCTA) provides a new technique to visualise the retinal vasculature with minimal risk and no-invasion.9 Some researchers have employed OCTA to study children’s retinal microvascular structure.3 9–12 They provided comparisons between the premature children who underwent treatment (cryotherapy, anti-VEGF or laser) and the full-term children by OCTA. They also adopted it to monitor the regression of the neovascular complex in aggressive posterior ROP.13 Researchers considered that treatment modality with cryotherapy, anti-VEGF or laser may have a different effect on the formation of the foveal avascular zone (FAZ).14 However, OCTA results have been rarely compared between children underwent IVR and LP. This study aims to compare the foveal microvascular structure and visual function between children treated with IVR and LP using OCTA. In addition, we also investigated the correlation between the foveal microvascular changes with the size of FAZ, the logarithm of the minimal angle of resolution (logMAR) best-corrected visual acuity (BCVA), vessel length density (VLD), perfusion density (PD) and central foveal thicknesses (CFT).
Methods
Patients
The present study is a cross-sectional study. A total of 37 children aged from 4 to 10 years with a history of IVR or LP monotherapy for ROP who followed up in Shenzhen Eye Hospital from April 2018 to September 2019 were recruited. All children were initially diagnosed with zone II treatment-requiring ROP (zone II, stage 3, plus disease). Among them, 17 children (28 eyes) were treated with IVR and 20 (37 eyes) were with LP. The IVR was performed with 0.25 mg (0.025 mL) ranibizumab (Lucentis; Novartis, Basel, Switzerland) and was injected intravitreally 1–1.5 mm posterior to the corneal limbus. An indirect infrared diode laser (Iridis; Quantel-Medical, Cournon d’Auvergne Cedex, France) (810 nm) was used to apply LP through a 20 (diopter, D) condensing lens. All children were followed until active ROP regressed. The children were separated into the IVR group and LP group. The inclusion criteria: preterm children who underwent either IVR or LP monotherapy for ROP. Exclusion criteria: (1) children with eye diseases other than ROP; (2) children having received further treatment after initial IVR or LP; (3) stage 4 ROP or stage 5 ROP underwent vitreoretinal surgery; (4) children with high myopia (≥11D); (5) children whose OCTA scanning area was not centred at the fovea centralis and (6) children with poor fixation or imaging quality due to poor cooperation for examination. This study followed the principles of the Declaration of Helsinki and obtained the informed consent of the parents and children before this study was performed.
Measurements
The images were scanned for all subjects using the OCTA (Cirrus AngioPlex 5000 software V.9.5, Carl Zeiss Meditec, Dubin, California, USA), and the scanning mode was 3×3 mm. The superficial retinal layer was imaged from the internal limiting membranes (ILM) of the retina to the inner plexiform layer. The VLD is defined as the sum of the length of vessels in a particular area, and it is shown as mm/mm2. The PD is defined as the percentage of the area occupied by the vessels in a particular area, and it is shown as mm2/mm2.11 15 The CFT is defined as the distance from the ILM to the inner border of retinal pigment epithelium.14 The OCTA data (eg, VLD, PD, FAZ area and FAZ morphological index (MI)) were measured by the software automatically. The CFT was manually measured by an experienced ophthalmologist. In this study, the central foveal area is defined as the small circle (red zone) with 1 mm in diameter and centred at the fovea; the foveal area is defined as the large circle with 3 mm in diameter and centred at the fovea; the parafoveal area is defined as the annular area (green zone) in which the large circle without the small central circle (figure 1).16 The total parameters using OCTA mode were as follows: central foveal VLD and PD, parafoveal VLD and PD, foveal the VLD and PD, FAZ area, as well as FAZ MI. The CFT was measured using cross-sectional OCT. All children’s visual acuity and refraction data were recorded. All the examinations in this study were performed by one experienced technician using the same machine.17
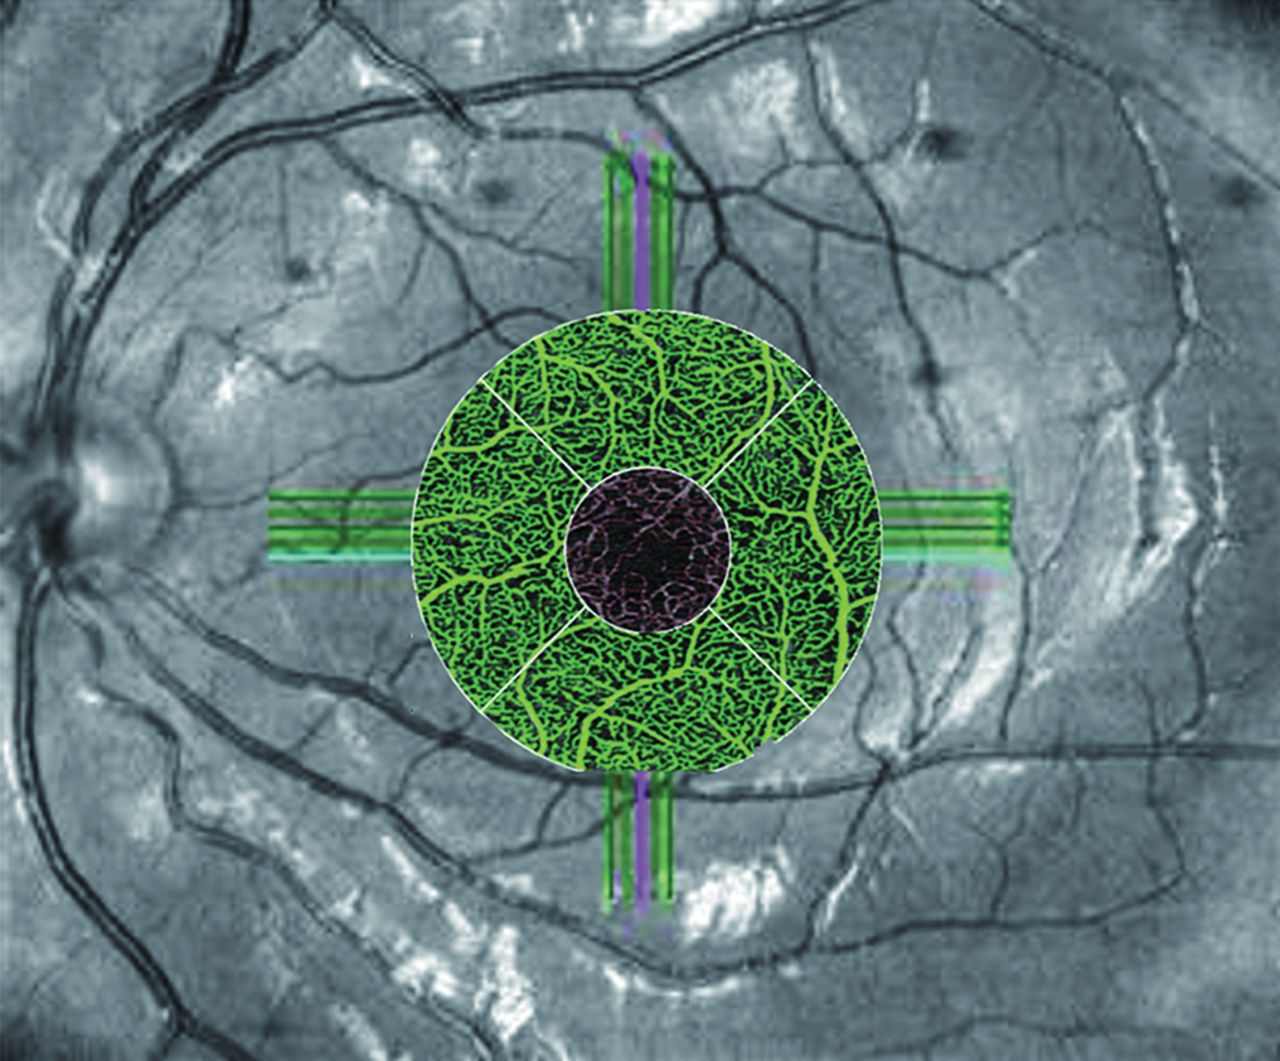
Description of the various parts of the macular area. The small circle in red is the central foveal area. The annular area in green is the parafoveal area. The foveal area is the area which includes both small and annular circle.
Statistical analyses
The statistical analysis was performed using SPSS software (V.23.0). Descriptive analysis was expressed as mean±SD for normally distributed variables. These quantitative data were compared by the t-test. X2 test was used for the categorical variables. Pearson correlation coefficient was adopted to evaluate the association of different parameters. The BCVA was converted to the logMAR equivalents for statistical analysis. In all analyses, p<0.05 was considered statistically significant.
Results
Baseline and demographic data
All of the enrolled children were initially diagnosed with zone II treatment-requiring ROP (zone II, stage 3, plus disease). The baseline characteristics of children in the two groups are listed in table 1. There was no statistically significant difference between IVR and LP groups in the sex, gestational age at birth (BGA), birth weight (BW), corrected gestational age at treatment, age of OCTA examination and birth way.
Baseline and clinical characteristics of children with IVR and LP
OCTA and OCT
Eyes with a history of IVR had a statistically significantly lower central foveal VLD and PD compared with the eyes with a history of LP (t=2.56, p=0.01; t=2.82, p=0.006) (table 1). While in the parafoveal and foveal area, there was no statistically significant difference between patients with a history of IVR and LP in the VLD and PD (table 1). The CFT of children in the IVR group was thinner than that in the LP group (t=5.83, p<0.01), and the FAZ area in the IVR group was higher than that in LP group (t=−2.01, p=0.048) (table 1, figure 2). There was no significant difference in FAZ MI between the IVR group and LP group (t=−1.56, p>0.05) (table 1). A total of two eyes (7%) and seven eyes(19%) have no FAZ in the IVR and LP group, respectively.
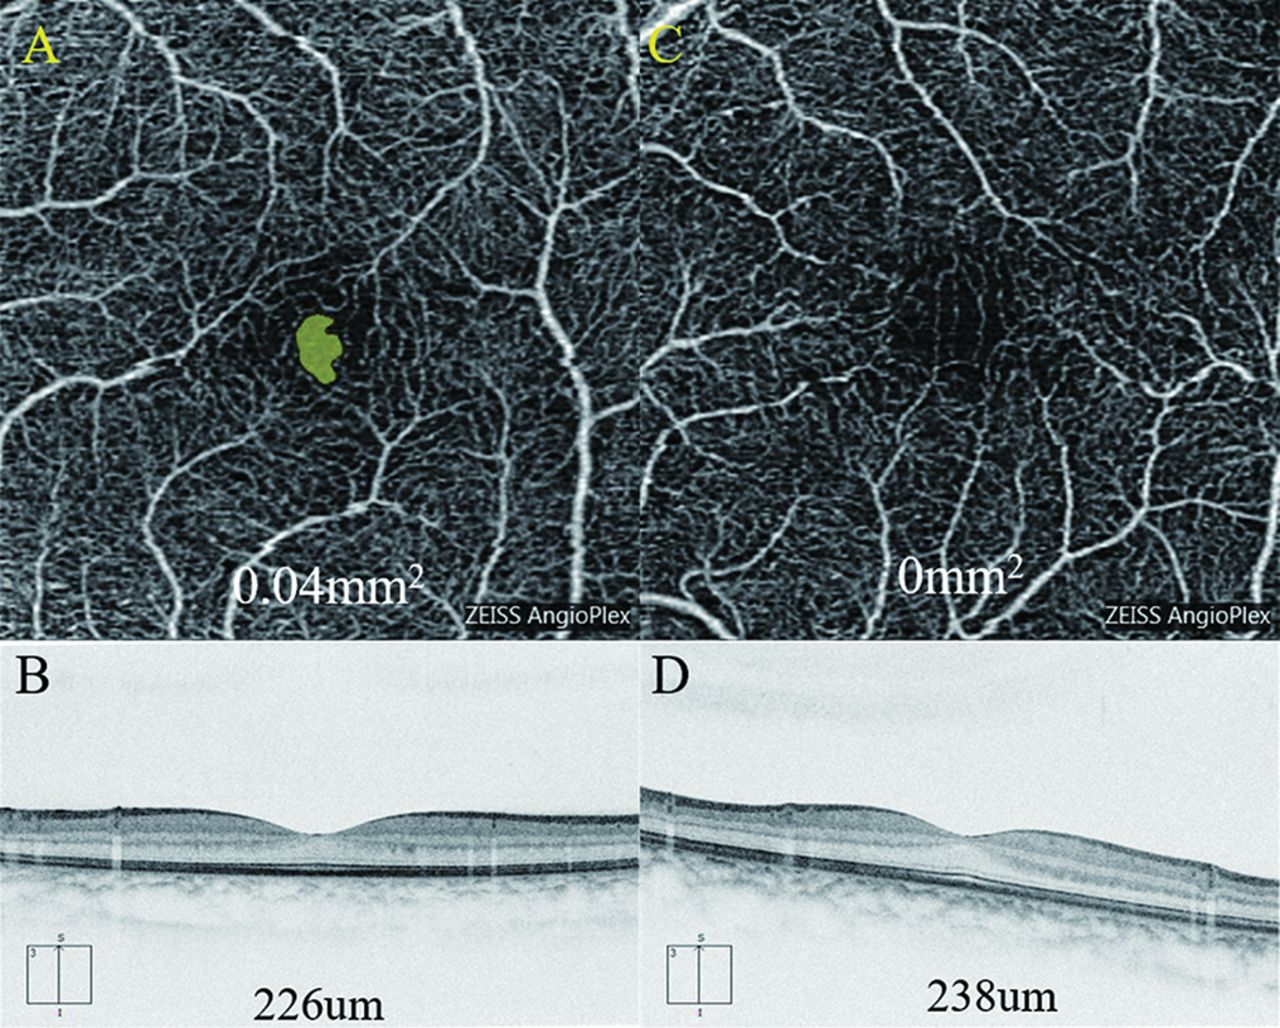
Clinical characteristics of children with IVR or LP. (A, B) are FAZ and CFT of patient underwent IVR; (C, D) are FAZ and CFT of patient underwent LP (the BGA of the two children were both 28W). BGA, born in gestational age; CFT, central foveal thicknesses; FAZ, foveal avascular zone; IVR, intravitreal injection of ranibizumab; LP, laser photocoagulation.
The FAZ area were negatively correlated with central foveal VLD and PD (r=−0.56, p<0.01; r=−0.56, p<0.01). It has no statistical relationship with parafoveal and foveal VLD and PD, CFT, BGA and BW (table 2).
Correlation analysis among foveal structures, baseline information and LogMA (BCVA)
Visual acuity and refraction
The BCVA of children in the IVR group was worse than that in the LP group (t=−2.67, p=0.01) (table 1). However, the two groups for SER showed no significant statistical differences. The BCVA (LogMAR) was negatively correlated with central foveal VLD and PD (r=−0.31, p=0.04; r=−0.34, p=0.02). But it has no statistical relationship with parafoveal and foveal VLD and PD, CFT, BGA and BW (table 2).
Comparison of children with BGA ≤30 and >30
Several researchers considered that the process of foveal pit development starts at 30 weeks to 32 weeks BGA and continues until after birth in human.3 18–21 Accordingly, all children were divided into two groups: group 1: BGA ≤30 weeks; group 2: BGA >30 weeks.
We found no statistical difference between the two groups in many indicators (eg, VLD, PD, BCVA (logMAR) and SER) except for the FAZ area and CFT. The FAZ area is smaller and the CFT is thicker in children whose BGA ≤30. This was statistically significant (t=−3.14, p<0.01; t=3.13, p<0.01) (table 3, figure 3).
Clinical characteristics of children with BGA ≤30 and >30

The FAZ and CFT in representative OCTA images. FAZ is smaller and CFT is thicker with younger BGA (the BGA of the representative children from left to right were 28W, 30W, 32W, 34W and 38W, respectively). BGA, born in gestational age; CFT, central foveal thicknesses; FAZ, foveal avascular zone; OCTA, optical coherence tomography angiography.
Discussion
OCTA requires no-dye examination generating capillary-depth resolved images of the foveal retina in three dimensions.13 Its non-invasive nature makes it an attractive tool to image infants and children. Compared with FFA and OCT, OCTA can measure not only the size of FAZ but also retinal vascular density. OCTA in this study was employed to compare the microvascular structure including FAZ, VLD and PD between premature infants with a history of LP and IVR monotherapy. It is the first article with a relatively larger sample for such comparison.
In this study, we found that in the central fovea, both VLD and PD in the IVR group were significantly lower than the LP group. Previous studies have found that higher levels of VEGF in preterm eyes may promote foveal abnormal vascularisation.22 A reasonable explanation for lower VLD and PD in the IVR group is that IVR decreased VEGF in children, resulting in decreased foveal vascular density. Because VEGF plays an important role in many physiological processes, differences in VEGF expression could explain the differences seen in foveal development.4 Note that, in the parafoveal and foveal area, there was no statistical difference for VLD and PD between the two groups. The variations of VLD and PD in the central foveal are most obvious. In another word, the critical place leading to variations in retinal VLD and PD is the central fovea. This is consistent with the report by Bowl et al22
We found that both VLD and PD increased when FAZ was smaller in the central foveal area (table 1). This is consistent in the previous opinion.3 14 And the central foveal VLD and PD were negatively correlated with FAZ area (r=−0.56, p<0.01; r=−0.56, p<0.01) (table 2). This further proves the close relationship between vascular density and FAZ.
For the formation of the FAZ during macular vascularisation, there are two opposite hypotheses: Henkind et al23 24 considered that the macular area is initially completely vascularised in fetal life, and the subsequent vascular reconstruction (centrifugal movement of the inner retina) leads to the formation of the FAZ. Engerman18 held that the macular region is initially avascular and then vascularise gradually until reaching the foveal centre. Previous researchers have drawn the conclusion that the FAZ of premature children is smaller than that of full-term children.3 11 14 In this study, we also found that premature infants with younger BGA have smaller FAZ (table 3, figure 3). These findings further confirm the first hypotheses and the notion that BGA is the main factor affecting FAZ.
We observed that eyes with LP exhibited smaller FAZ and greater CFT than that with IVR (table 1, figure 2), which is consistent with the previous study.16 Vogel et al4 reported that LP was associated with extrusion of the inner retinal layers. The LP leads to the destruction of the avascular retina which prevents the peripheral migration and reorganisation of inner retinal cells, whereas the inner retinal cells in the IVR-treated eyes continue to migrate.16 This implies that LP contributes to the smaller FAZ area and thicker CFT.
As mentioned above, children treated with LP have thicker CFT. Moreover, we observed that children with younger BGA also exhibited thicker CFT (p<0.01) (table 3, figure 3). This is also consistent with the previous literature.25 The foveal development after birth involved the simultaneous centrifugal displacement of the inner retinal layers and the centripetal displacement of the outer retinal layers.20 26 Preterm birth before 28 weeks of BGA was associated with a failure of the inner retinal layers migrating away from the fovea, thus resulting in the increase in foveal thickness.14 27 In a word, in addition to the LP mentioned above, younger BGA may be another reason for the thicker CFT. Some other factors, including the disorder of retinal neurovascular development and degree of macular developmental arrest, might also result in the abnormal foveal pit.22 28
Previous studies have shown that more shallow foveal pits were associated with impaired visual function.29–31 Some others reported that the abnormality of the macular structure does not significantly affect BCVA.3 11 23 27 32 33 And still others indicated that reduced BCVA in children underwent LP is significantly correlated with lower BGA rather than thicker CFT.33 In this study, children treated with LP have thicker CFT but better BCVA than that with IVR. This is not consistent with the conclusion above. We found that the BCVA has no statistical relationship with the BGA and CFT. These results imply that factors unrelated to foveal architecture may underlie the visual acuity deficits, including delayed and/or altered photoreceptor maturation, abnormalities in optic nerve function or in the visual cortex and choroid thickness.33 34 In this study, we also found that BCVA was negatively correlated with central foveal VLD and PD (r=−0.31, p=0.04; r=−0.34, p=0.02) (table 2). The changes in central foveal vascular density might be an important factor in poor BCVA. Further study with larger sample is needed for more specific conclusions.
Limitations
First, difficulty in imaging the peripheral retina is a limitation of OCTA examination compared with FFA. Second, we focused on only the superficial retinal vasculature, primarily because this was the only automated measurement currently provided by this machine.35 Third, children with a history of various degrees of ROP might have different foveal development. In this study, the ROP severity is not exactly the same between the IVR and LP group, which may lead to bias. Finally, we cannot do this examination for infants before treatment, we cannot determine whether the difference between the two groups are related to the treatment or the disease itself. A prospective study with a larger sample will be necessary to further verify the effectiveness of the conclusion.
In conclusion, OCTA is a non-invasive image modality helping to evaluate the detailed foveal microvasculature in ROP children. The IVR might contribute to microvascular changes in the macular zone, such as reducing the central foveal VLD and PD, while the LP might contribute to microstructural changes, such as smaller FAZ and thicker CFT.
Acknowledgments
The authors would like to thank all the patients who participated in this study and thank Zheng Xizhe, Chen Guozhen and Zhang Rugang for technical and reviewing assistance.
References
Footnotes
Contributors JZ and ZW contributed equally to this work. JZ and ZW contributed to the conception of the study. JZ, ZW and GZ performed the data analyses and wrote the manuscript. WL, JZ and FZ helped perform the analysis with constructive discussions. MY, LC, LZ and JW contributed significantly to analysis and manuscript preparation. All authors approved the final version of the manuscript.
Funding This work was supported by the Basic Discipline Layout Foundation of the Shenzhen Science and Innovation Commission. P.R.China (grant no. JCYJ20170817112542555).
Competing interests None declared.
Patient consent for publication Parental/guardian consent obtained.
Provenance and peer review Not commissioned; externally peer reviewed.
Data availability statement Data are available on reasonable request. We can provide the data of this study.