Article Text

Abstract
Background/ims To compare the retinal vessel diameter measurements obtained from the swept-source optical coherence tomography angiography (OCTA; Plex Elite 9000, Carl Zeiss Meditec, USA) and adaptive optics ophthalmoscope (AOO; RTX1, Imagine Eyes, France).
Methods Fifteen healthy subjects, 67% women, mean age (SD) 30.87 (6.19) years, were imaged using OCTA and AOO by a single experienced operator on the same day. Each eye was scanned using two OCTA protocols (3×3 mm2 and 9×9 mm2) and two to five AOO scans (1.2×1.2 mm2). The OCTA and AOO scans were scaled to the same pixel resolution. Two independent graders measured the vessel diameter at the same location on the region-of-interest in the three coregistered scans. Differences in vessel diameter measurements between the scans were assessed.
Results The inter-rater agreement was excellent for vessel diameter measurement in both OCTA protocols (ICC=0.92) and AOO (ICC=0.98). The measured vessel diameter was widest from the OCTA 3×3 mm2 (55.2±16.3 µm), followed by OCTA 9×9 mm2 (54.7±14.3 µm) and narrowest by the AOO (50.5±15.6 µm; p<0.001). Measurements obtained from both OCTA protocols were significantly wider than the AOO scan (OCTA 3×3 mm2: mean difference Δ=4.7 µm, p<0.001; OCTA 9×9 mm2: Δ=4.2 µm, p<0.001). For vessels >45 µm, it appeared to be larger in OCTA 3×3 mm2 scan than the 9×9 mm2 scan (Δ=1.9 µm; p=0.005), while vessels <45 µm appeared smaller in OCTA 3×3 mm2 scan (Δ=−1.3 µm; p=0.009)
Conclusions The diameter of retinal vessels measured from OCTA scans were generally wider than that obtained from AOO scans. Different OCTA scan protocols may affect the vessel diameter measurements. This needs to be considered when OCTA measures such as vessel density are calculated.
- imaging
- retina
- angiogenesis
This is an open access article distributed in accordance with the Creative Commons Attribution Non Commercial (CC BY-NC 4.0) license, which permits others to distribute, remix, adapt, build upon this work non-commercially, and license their derivative works on different terms, provided the original work is properly cited, appropriate credit is given, any changes made indicated, and the use is non-commercial. See: http://creativecommons.org/licenses/by-nc/4.0/.
Statistics from Altmetric.com
Introduction
Optical coherence tomography angiography (OCTA), a functional extension of OCT, offers a three-dimensional high-resolution visualisation of the retinal vasculature networks via motion contrast from the blood cells.1 Since its approval by FDA in the late 2016, the OCTA has gained immense interest among clinicians for its ability to highlight vascular alterations in retinal conditions.2–4 Despite its potential as a microvasculature imaging tool, it remains unknown whether a retinal vessel imaged by OCTA reflects its actual diameter. Retinal vessel calibre measurements may provide pertinent information on the health status of the eye and the body.5 6 Specifically, vessel calibre measurements have been correlated with worsening of eye diseases such as diabetic retinopathy7 and systemic health status in hypertension,8 diabetic nephropathy9 and cardiovascular disease.10 Therefore, accurate and reliable measurements of the retinal vessel calibre with OCTA may be attractive. Recently, Ghasemi Falavarjani et al11 compared the vessel diameter measurements obtained from OCTA scans and fundus photographs, and reported that the vessels measured from OCTA scans appeared to be nearly 20 µm thicker when compared with fundus photographs. However, absolute vessel diameter measurement obtained from fundus photography can be influenced by various factors such as illumination wavelength and vessel orientation.12 13 In addition, the impact of different OCTA scan protocols on the vessel diameter measurement remains unknown.
Adaptive optics ophthalmoscope (AOO) is a fundus camera system inbuilt with an adaptive optics (AO) to compensate optical aberration induced by the anterior segment of the eye.14 The AO consists of a deformable mirror in the illumination pathway and a wavefront sensor in the detection pathway, working in a feedback loop that corrects optical aberration in real time. Compared with the fundus camera, AOO allows for retinal vessel imaging with higher transverse resolution. It offers distinct delineation of the vessel wall and lumen,15 and may be less susceptible to segmentation error, ultimately allowing for more accurate vessel diameter measurements.
In our study, we compare the vessel diameter measurements using two different OCTA scan protocols with the high-resolution AOO as a reference and investigate if OCTA scan protocols may affect vessel diameter measurement.
Methods
Study participants
A total of 15 healthy volunteers, aged 21 and above, with no history of systemic or ocular diseases, were recruited at the Singapore Eye Research Institute between June 2019 and August 2019. All individuals were screened for suitability before recruitment. Written informed consent was obtained from all participants and all procedures performed were in accordance with the ethical standards of the SingHealth Centralised Institutional Review Board and in accordance with the Declaration of Helsinki.
Ocular examination
Detailed interviewer-administered questionnaire was used to screen for any chronic medical history (eg, diabetes, hypertension, high cholesterol) and ocular history (eg, glaucoma, retinopathies or any surgery or laser treatment).16 Participants were then assessed for their refractive error using an axial (Canon RK-5 Autorefractor Keratometer; Canon Inc., Tokyo, Japan), and intraocular pressure.16 Their pupils were dilated with 1% tropicamide before undergoing the relevant imaging-related tests, including fundus photography, OCT and swept-source OCTA (SS-OCTA). Fundus photographs further documented the absence of any ocular diseases.17 18
Optical coherence tomography angiography imaging
OCTA imaging was performed with a prototype SS-OCT instrument (Plex Elite 9000, Carl Zeiss Meditec, USA), which employs a wavelength swept source and detects the interference signal by a photodetector.4 The light source has a central wavelength at 1050 nm with a scanning rate of 100 000 A-scans per second. The axial and lateral resolutions in tissue are 6.3 µm and 20 µm, respectively. The system is integrated with a line-scan ophthalmoscope eye tracker to compensate the artefacts caused by blinking, bulk motion and involuntary eye motion. All eyes were scanned using two OCTA scan protocols: three 3×3 mm2 scans with the scan density of 300×300 pixels and a uniform pitch of 10 µm/pixel, and one 9×9 mm2 scan with the scan density of 500×500 pixels and a uniform pitch of 18 µm/pixel. Both OCTA protocols used four repeated B-scans to generate en face OCTA images. Among the three 3×3 mm2 scans, one was centred on the macular area, with the other two superior and inferior to the macular region, respectively. The single 9×9 mm2 scan was centred on the macular. The OCTA scans used in this study were generated from the superficial vascular plexus from the inner limiting membrane to the inner plexiform layer by the PLEX Elite Review Software V.1.7.1.31492.
Adaptive optics ophthalmoscope imaging
The AOO (RTX1, Imagine Eyes, France) is essentially an AO fundus camera system that uses wide field (flood) illumination and a two-dimensional camera as detector.14 It employs an AO unit comprised of a deformable mirror and a Shack-Hartmann wavefront sensor. The shape of the deformable mirror is controlled by the feedback from the wavefront sensor, to correct the optical aberration and increase the resolution as well as light throughput. The main advantage of AOO over existing AO scanning laser ophthalmoscopes (AOSLOs) is its higher imaging speed that empowers a stronger resistance to motion artefacts. During acquisition, the AOO captures 40 high-resolution two-dimensional en face image and stabilises the frames using automatic image registration. The total acquisition time is about 2 s. It then generates an averaged image using the stabilised frames. The system has a lateral resolution of 2 µm on the retina, and a field of view of 4°×4°, equivalent to 1.2×1.2 mm2. The digitised image has a uniform pitch of 0.8 µm. The accessible area of AOO is about 9×6 mm2 on the retina centred at the fovea. For each eye, three to five AOO scans were focused on arterioles/venules, with the selection of the region of interest (ROI) guided by the OCTA 9×9 mm2 scan.
Image processing and vessel calibre measurement
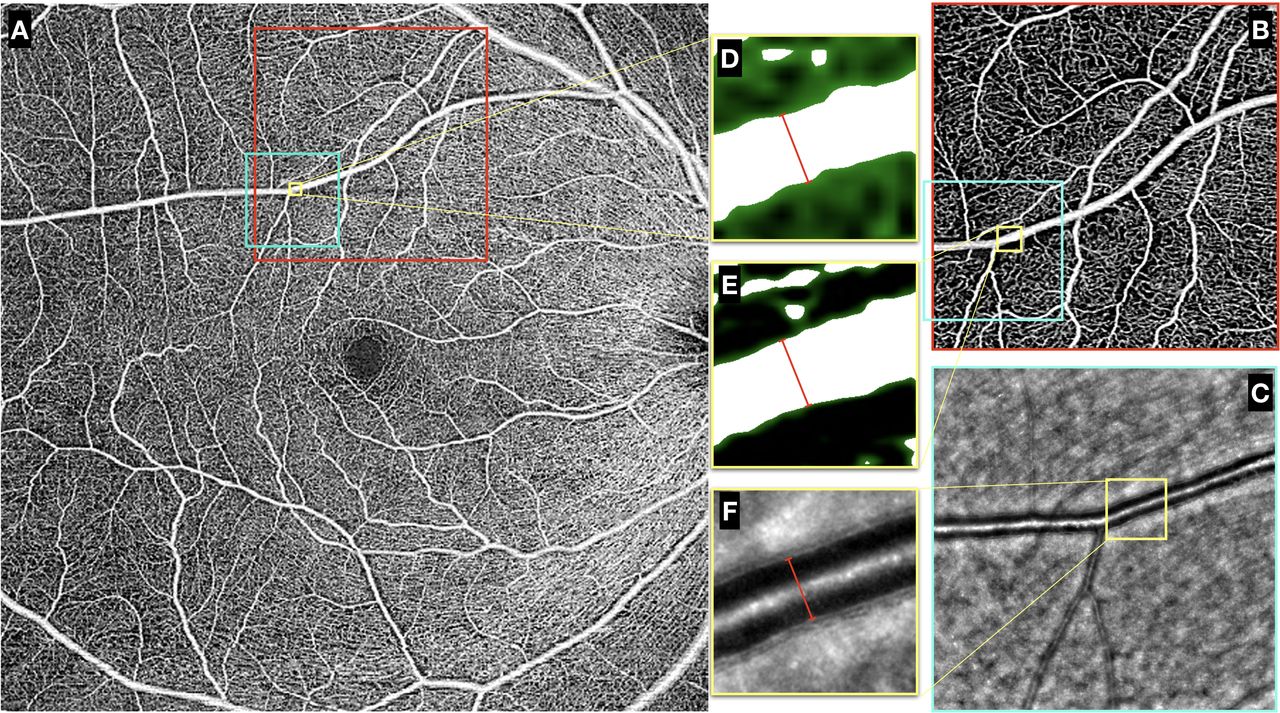
Figure 1 shows the manually registered scans from the two OCTA protocols and one AOO scan of the same eye, and the vessel diameter measurements made from the three coregistered scans. The AO and OCTA scans were directly exported from the instruments, respectively, and analysed in ImageJ (National Institutes of Health, Bethesda, Maryland, USA). The 9×9 mm2 (figure 1A) and 3×3 mm2 (figure 1B) OCTA scans were rescaled to match the pitch size of the AO scan (figure 1C) using bilinear interpolation. Both OCTA scans were then manually registered to the AO scan, and binarised by using Otsu’s global thresholding method.19 For every registered scan set, one ROI (260×260 pixels) was selected on each vessel that was well captured by both instruments (figure 1A–C yellow boxes). Two independent graders (MK, YH) randomly selected one specific location along the vessel within the ROIs of three registered scans and measured the vessel diameter in the ROIs, respectively (figure 1D–F). For the OCTA scans, the vessel borders were determined based on the binarised images, and the vessel diameter was measured perpendicular to the borders (figure 1D). For AOO scans, the borders of the vessel lumen were determined based on the local image contrast, and the vessel lumen diameter was measured to represent the vessel diameter (figure 1F). Each grader made three random measurements along the vessel in the ROI and the averaged vessel diameter was reported for analysis.

Example of the manually registered OCTA 9×9 mm2, 3×3 mm2 and AOO scans on the same eye. (A) The OCTA 9×9 mm2 scan centred at the macular area, marked with the red box representing the corresponding 3×3 mm2 scan displayed in (B) and the light blue box representing the corresponding AOO scan displayed in (C). (D–F) The ROIs for performing vessel diameter measurement indicated by the yellow boxes taken from the (D) OCTA 9×9 mm2, (E) 3×3 mm2 and (F) AOO scans. For the OCTA scans, binarisation masks (green) were imposed on the original images in (D) and (E). Vessel diameter measurements were made perpendicular to the vessel direction, as shown by the red lines. AOO, adaptive optics ophthalmoscope; OCTA, optical coherence tomography angiography; ROIs, regions of interest.
Statistical analysis
The intraclass correlation coefficients (ICCs) and 95% CIs were used to assess the absolute agreement (1) between raters and (2) between the vessel diameter measurements from different types of scans. ICC values <0.5, between 0.5 and 0.75, between 0.75 and 0.90 and >0.90 indicate poor, moderate, good,and excellent agreement, respectively.20 The vessel diameter measurements made by the two graders were averaged for further analysis. Bland-Altman plots were used for visual representation of the 95% limit of agreement between different types of scans, and paired t-test was used for quantitative comparison. A p value <0.05 was considered significant. The statistical software, Stata V.15, was used for statistical analyses.
Results
A total of 27 eyes from 15 patients were included in the study of agreement of vessel diameter measured from two OCTA scan protocols 3×3 mm2 and 9×9 mm2 with AOO. Table 1 shows the demographics and clinical characteristics of these participants where the mean (SD) age was 30.87 (6.19) years, 67% women and 80% Chinese. Their spherical equivalent (SD) was −3.82 (2.79). The OCTA’s signal strength index (SD) of 3×3 mm2 scans was 9.89 out of 10 (0.33), while that of the 9×9 mm2 scans was 9.87 (0.35). The inter-rater agreement level was excellent for vessel diameter measured from either the OCTA protocols (ICC=0.92 for both 3×3 mm2 and 9×9 mm2 scan) or the AOO scans (ICC=0.98).
Clinical and ocular characteristics of participants (n=15)
Table 2 summarises the vessel diameter measurement results obtained from the OCTA 3×3 mm2, OCTA 9×9 mm2 and AOO scans. The mean vessel diameter was widest measured from the OCTA 3×3 mm2 (55.2±16.3 µm), followed by OCTA 9×9 mm2 (54.7±14.3 µm) and narrowest by the AOO (50.5±15.6 µm). The mean vessel diameter derived from either the OCTA 3×3 mm2 or 9×9 mm2 scans were significantly wider than AOO (p<0.001). There were no differences in terms of the vessel diameter measurements between the two OCTA scans (p=0.298).
Vessel diameter measurements in two OCTA protocols and AOO
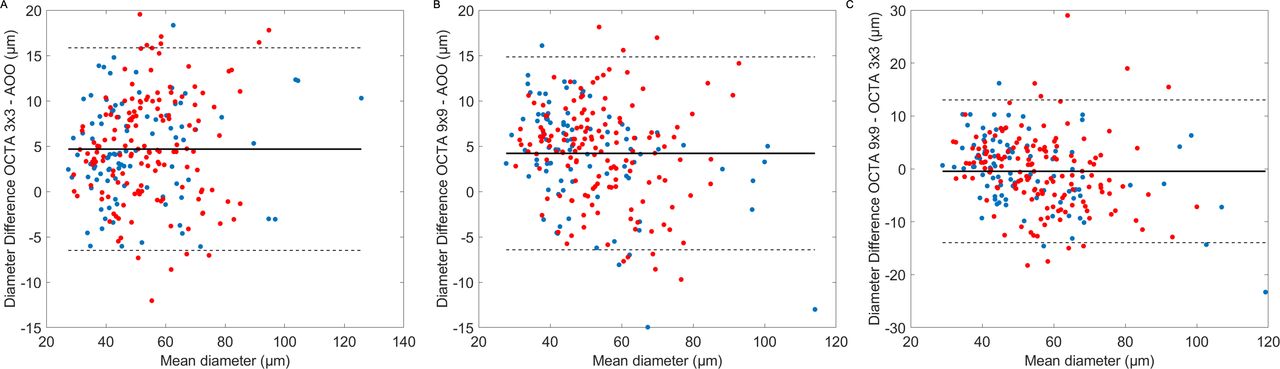
Table 3 summarises the differences in vessel diameter measurements between the different scans as categorised by vessel type and size. On average, the measurements obtained from both the OCTA scans were consistently ~5 µm wider than the AOO measurements regardless of vessel type (arterioles or venules). No significant difference was seen between the OCTA scan protocols (p>0.05). When we examine vessels that were larger than ≥45 µm (AOO: 60.8±13.5 µm), vessels measured from OCTA 3×3 mm2 scan were significantly wider than that measured from the OCTA 9×9 mm2 scan (65.4±14.4 µm vs 63.5±13 µm; p=0.005). However, this effect was reversed for the smaller vessels (AOO: 37.7±5.1 µm), where vessels measured from the OCTA 3×3 mm2 scan were marginally narrower than those from the OCTA 9×9 mm2 scan (42.4±6.7 µm vs 43.7±5.7 µm; p=0.009). Figure 2A–C shows the Bland-Altman plots, comparing the vessel diameter differences measured by different OCTA protocols and AOO.
Comparison of mean difference in vessel diameter (µm) measured from two OCTA protocols and AOO

Bland-Altman plots of vessel diameter measurements from OCTA 9×9 mm2, 3×3 mm2 and AOO scans. Red dots: arterioles. Blue dots: venules. AOO, adaptive optics ophthalmoscope; OCTA, optical coherence tomography angiography.
Discussion
We investigated OCTA-derived vessel diameter measurements by comparing with results from AOO. Our data showed that the mean vessel diameters measured from OCTA were significantly wider than AOO, regardless of scan protocols and vessel type. This finding may seem counterintuitive. One would expect that the vessels in the OCTA scans to appear narrower than the AOO scans because the blood cells proximal to the vessel wall tend to move at a much slower velocity, resulting in the absence of OCTA signals near the vessel wall. Instead, the vessel diameter appears wider when imaged with the OCTA system. There are three possible explanations. First, as explained by Spaide et al,21 OCTA system has a poorer lateral resolution compared with the AOO system, and also exhibits a low saturation threshold for the flow rate. Even when the laser beam spot partially hits on the vessel, the OCTA system can already detect red blood cell moving, resulting in an OCTA pixel above the noise floor that might contribute to the vessel diameter measurement. Second, the oversampling rate of the OCTA system may also play a role in the overestimation of the vessel width. In principle, the denser the sampling is, the more pixels a vessel contributes to the OCTA signal. This is clearly seen for large vessel imaging (D≥45 µm), where the OCTA 9×9 mm2 tended to overestimate the vessel diameter marginally by 2.7 µm, whereas the overestimation is greater (4.6 µm) when using the OCTA 3×3 mm2. The OCTA 3×3 mm2 protocol almost doubles the oversampling rate compared with the 9×9 mm2 protocol. Last but not the least is the effect of binarisation of OCTA images. We graded the vessel width from the binarised OCTA images, whereas we used the raw AOO image for grading. Because the OCTA pixel intensity has gradient, global thresholding will affect the number of pixels masked to be vessels. When the vessel contrast in OCTA is low, the binarisation effect may even counteract the broadening effect of OCTA. Nevertheless, further investigation is needed to fully understand the effect of binarisation on the vessel diameter measurement. Generally speaking, our finding confirms previous reports by other groups11 21 22 that the vessel imaged using an OCTA tended to be larger than fundus photographs, and now the AOO scans.
Another factor that may affect the vessel diameter measurement using OCTA is the presence of the cell free plasma (CFP) layer. Previous studies using microscopy have shown that the width of the CFP layer is strongly correlated to the vessel diameter.23 The relative proportion decreases, however, from approximately 8% in vessels with a diameter of 10 µm to <6% in vessels of with a diameter of 50 µm.24 One would therefore assume that in the present study the relative error in OCTA measurements would be larger in the vessels with a diameter D<45 µm.
Ghasemi Falavarjani et al11 reported that the mean difference in the vessel calibre was 17.6 µm between OCTA images and colour fundus images. We would like to stress that the differences may not be as great. The vessel diameter measured from OCTA images were approximately 4.7 µm thicker than the AO measurements and this difference was marginally greater when using the OCTA 9×9 mm2 on smaller vessels (6.1 µm). The discrepancy might be attributed to the difference in specifications of the OCTA instruments and methods used for vessel diameter measurement in OCTA. On the other hand, Mo et al25 compared the vessel diameter measurements from OCTA and AOSLO and found the difference to be around 5.7 µm, similar to our findings.
It was known that various factors such as the blood velocity, scan density, number of B-scan repetition and scan speed, may affect the signal-to-noise ratio (SNR) of OCTA images, which then influence the outcome of the quantitative OCTA analysis. In a wide variety of studies, retinal vasculature metrics, such as vessel density and perfusion density, were derived from binarised OCTA images and quantitatively analysed for diagnosis as well as prognosis performances.1 4 26–29 Some of the metrics were calculated from skeletonised OCTA maps where vessels were shrunk down to lines with single-pixel width, while others incorporated the pixel area covered by the vessels in OCTA images. In the current study, we have used a prototype OCTA system which does not have built-in software for morphometry. Our goal was to answer a fundamental question, which is related to the reliability of the commonly used OCTA vessel density measurement when using different scan protocols. Since different vendors use different algorithms for calculating vessel density this may have an effect on the absolute numbers of vessel density as well. Some investigators found significant differences in OCTA metrics between different machines and different algorithms,30–32 while others did not.33 We found the scan density of OCTA protocol may affect the accuracy of vessel diameter measurement and therefore influence the calculation of OCTA metrics. To which degree this effect may also add to the poor comparability of data with different instruments34 remains to be investigated. On the contrary, metrics, for example, vessel density, derived from skeletonizsed OCTA images may be less affected by different OCTA protocols or instruments, as suggested by other studies as well.26 27
Conventionally, retinal vessel calibres are extracted from digitalised colour fundus photographs using computer-assisted programmes, and yet different image processing methods may lead to different vessel diameter measurement results.12 13 Moreover, the vessel width as extracted from colour fundus photograph may only partially reflect the actual vessel lumen.35 Previous researchers tried to use the OCT to measure vessel calibre in the axial direction (vertically) that is insensitive to the ocular magnification effect.12 36 However, the accuracy of this approach is dependent on the coherence length of the light source, which is usually above 5 µm in tissue. The transverse resolution of AOO (2 µm) is much better than that of conventional fundus photography as well as OCTA or OCT systems. Even though the AOO system does not correct for ocular magnification effect, the vessel diameter measurements from the AOO images would still be closer to the ground truth. In addition, the acquisition time of AOO is very short (2 s), making it almost impervious to motion artefact. Therefore, using AOO as a reference is more reasonable and most likely induces no relevant error to our conclusions. It should also be noted that the AOO vessel diameter measurement is heavily dependent on proper focusing. To limit the influence of focusing errors the images included in the study passed quality control.
There are also some limitations of this study. The sample size was relatively small, and only healthy subjects were included. As discussed above, the vessel diameter measurement was conducted on binarised OCTA images. Future studies may consider the effect of varying the thresholding method on the vessel diameter measurements. Both AOO and OCTA measurements did not count for the magnification error of the eye, and therefore may still deviate from the vessel diameter in actuality. We only included one SS-OCTA instrument in this study and the result may not be generalised to other OCTA devices. The vessels analysed in our study were mostly arterioles/venules and the results might not be generalised to the smaller vessels such as capillaries, which consists of a major portion during the calculation of vessel density and perfusion density.
In conclusion, we found that vessels measured from OCTA appeared to be thicker than those in AOO and different OCTA protocols may affect the vessel diameter measurement. This needs to be taken into consideration when vessel diameters or metrics, such as vessel density and perfusion density that implicitly incorporate vessel diameters, are extracted from OCTA images.
References
Footnotes
Twitter @XinwenYao
Contributors XY, LS and JC conceived the concept and designed the study. EL collected the data. XY, MK and YH performed the image processing and data analysis. XY drafted the manuscript. DWKW and BT offered administrative or technical support. LS and JC coordinated the project and handled the funding. All contributed to the final manuscript.
Funding The study is funded by National Medical Research Council (grants CG/C010A/2017, OFLCG/004C/2018 and TA/MOH-000249-00/2018) and the Duke-NUS Medical School (Duke-NUS-KP(Coll)/2018/0009A), Singapore.
Disclaimer The sponsor or funding organisation had no role in the design or conduct of this research. The funders had no role in the design and conduct of the study; collection, management, analysis and interpretation of the data; and preparation, review or approval of the manuscript; and decision to submit the manuscript for publication.
Competing interests None declared.
Patient consent for publication Not required.
Provenance and peer review Not commissioned; externally peer reviewed.
Data availability statement Data are available upon reasonable request. All raw data and measurement results are deidentified participant data, and are available upon reasonable request. Please contact Dr Jacqueline Chua: jacqueline.chua.y.m@seri.com.sg if interested.
Linked Articles
- At a glance