Article Text

Abstract
Background/aims To characterise the extension and progression of alteration of neurosensory layers following acute and chronic branch retinal artery occlusion (BRAO) in vivo using spectral-domain optical coherence tomography.
Methods In this observational case series, eight eyes with acute BRAO and nine eyes with chronic BRAO were analysed using a Spectralis Heidelberg Retina Angiograph (HRA)+optical coherence tomography system including eye tracking. Patients with acute BRAO were examined within 36±5 h after primary event and at weekly/monthly intervals thereafter. Segmentation measurements of all individual neurosensory layers were performed on single A-scans at six locations in affected and corresponding non-affected areas. The thickness values of the retinal nerve fibre layer together with the ganglion cell layer (NFL/GCL), inner plexiform layer (IPL), inner nuclear layer together with outer plexiform layer (INL/OPL), outer nuclear layer (ONL), and photoreceptor layers together with the retinal pigment epithelium (PR/RPE) were measured and analysed.
Results Segmentation evaluation revealed a distinct increase in thickness of inner neurosensory layers including the NFL/GCL (35%), IPL (80%), INL/OPL (48%) and mildly the ONL by 21% in acute ischaemia compared with corresponding layers in non-ischaemic areas. Regression of intraretinal oedema was followed by persistent retinal atrophy with loss of differentiation between IPL and INL/OPL at month 2. In contrast, the ONL and subjacent PR/RPE retained their physiological thickness in patients with chronic BRAO.
Conclusion In vivo assessment of retinal layer morphology allows a precise identification of the pathophysiology in retinal ischaemia.
- Branch retinal artery occlusion
- optical coherence tomography
- retina
- imaging
This is an open-access article distributed under the terms of the Creative Commons Attribution Non-commercial License, which permits use, distribution, and reproduction in any medium, provided the original work is properly cited, the use is non commercial and is otherwise in compliance with the license. See: http://creativecommons.org/licenses/by-nc/2.0/ and http://creativecommons.org/licenses/by-nc/2.0/legalcode.
Statistics from Altmetric.com
Introduction
Branch retinal artery occlusion (BRAO) is a common vascular occlusive disorder of the eye, representing 38% of all acute retinal artery obstructions.1 These occlusions are caused by embolisation, coagulopathies, vasospasm or vasculitides, while distinct emboli are visible in up to 68% of cases.2 Hypertension, carotid occlusive disease or atherosclerosis, coronary artery disease and hypercholesteraemia are systemic risk factors predisposing patients to develop BRAO.3 The affected retina typically demonstrates a whitish opacification in the acute phase which peaks at 24 h and resolves thereafter.4 Ischaemic retinal injury results in initial loss of energy-dependent cellular function,5 6 swelling7 and an invariable course of necrosis, pigmentary degeneration and vascular involution.8 BRAO occurs typically at bifurcations and involves the temporal vessels in 98% of cases.9
Visual outcomes have been reported at the level of 20/40 or better for most affected eyes.2 10–12 In the light of the reports of good initial and consecutive visual acuity, aggressive management and treatment are usually not pursued with BRAO compared with events of central retina artery occlusion (CRAO), associated with severe vision loss at first presentation.
Although the obvious clinical changes are well described in BRAO, including swelling and opacification of the affected area, such ophthalmoscopic observations remain unspecific and do not allow any understanding of the pathophysiological effects of severe ischaemia in a complete neurosensory structure. Recently, some investigations used optical coherence tomography (OCT) to image retinal alterations associated with BRAO.13–16 In acute BRAO, increased overall thickness and reflectivity were noted in the inner retina with secondary shadowing and attenuation of subjacent structures supposedly due to intracellular oedema. A report by Asefzadeh17 showed no significant change in OCT findings after the 4-month visit, and this suggests a definition of a BRAO of at least 4 months’ duration as chronic. Cases were characterised by localised retinal atrophy; in particular the inner retina had lost reflectivity and was attenuated.18 However, except for two case reports,16 17 no detailed longitudinal analysis of specific alterations within the different neurosensory layers has been provided as yet.
The natural course of retinal oedema and the development of inner retinal atrophy might be of particular interest with regard to the evaluation of the effects of therapeutic interventions.
Recently, spectral-domain OCT (SD-OCT) technology has been introduced with further improvements in resolution and imaging speed. Moreover, scans are performed in a raster pattern throughout the entire macular area at a resolution of 5 μm in axial and 20 μm in transverse direction.19 Hence, ‘histologic’ layers of the retina may be imaged distinctly in an attempt to identify primary sites of injury and monitor progression or regression of chronic changes. Evaluation of microstructural alterations following BRAO may allow a better understanding of the pathophysiology of retinal ischaemia and corresponding changes in retinal layers after BRAO.
Herein, we systematically investigated the specific morphological alterations of the retinal ultrastructure following BRAO at acute presentation and during follow-up as well as in chronic cases up to 5 years after BRAO using SD-OCT technology.
Materials and methods
This prospective clinical trial was performed at the Department of Ophthalmology, Medical University of Vienna, Austria, and enrolled eight consecutive patients with acute BRAO and nine patients with chronic BRAO. All the research and measurements adhered to the tenets of the Declaration of Helsinki; the study and the study procedures were approved by the local ethics committee at the Medical University of Vienna; and an informed consent was obtained from the subjects after explanation of the nature and possible consequences of the study.
Patient selection
The diagnosis of BRAO was based on the presence of its classical clinical findings including the documented history of sudden onset of visual deterioration in one eye, fluorescein angiography showing absence and/or marked stasis of circulation in the involved branch retinal artery as well as retinal swelling in the dependent area of the occluded branch artery on fundus examination.
Exclusion criteria included diabetes, the presence of other retinal diseases in the study eye, such as age-related macular degeneration, hereditary retinal dystrophies as well as any history of retinal surgery or laser photocoagulation and ocular hypertension or glaucoma.
Patients with acute BRAO (onset of first symptoms ≤48 h) were recruited from the emergency unit of the Department of Ophthalmology of the Medical University of Vienna, and patients with chronic BRAO (onset of symptoms ≥4 months) were recruited from a list of patients with the clinical diagnosis of BRAO at the retina unit.
Ophthalmic evaluation
All patients underwent an ophthalmic examination including measurement of best corrected Snellen visual acuity (BCVA) and intraocular pressure, slit-lamp examination, funduscopy and OCT imaging at each follow-up time as well as fluorescein angiography at initial examination.
Patients with acute BRAO were examined using a Spectralis OCT device (Heidelberg Engineering ©, Software Version 3.2) at monthly intervals until month 3. In addition, three of these patients agreed to weekly follow-up visits during the first month.
Patients with chronic BRAO were examined in a single session.
OCT imaging
All OCT examinations and measurements were performed following a standardised study protocol for data acquisition and analysis. Before examination, the pupil of the study eye was dilated with 1% tropicamide (Mydriaticum ‘Agepha,’ Agepha, Vienna, Austria) and 2.5% phenylephrine hydrochloride eye-drops. A raster scan consisting of 31 B scans was used to image the macular region. The size of the field of view was 30°. For intraindividual follow-up examinations, the TruTrack automatic retinal recognition system was used to place the scans in exactly identical location. For the analysis of separate retinal layer thickness, horizontal scans confining the highest retinal thickening in the area of BRAO (figure 1B) were compared with topographically corresponding sites in the non-involved opposite half of macula (figure 1A). The corresponding non-involved region was identified by its equal distance from the central (foveal) scan (figure 2).
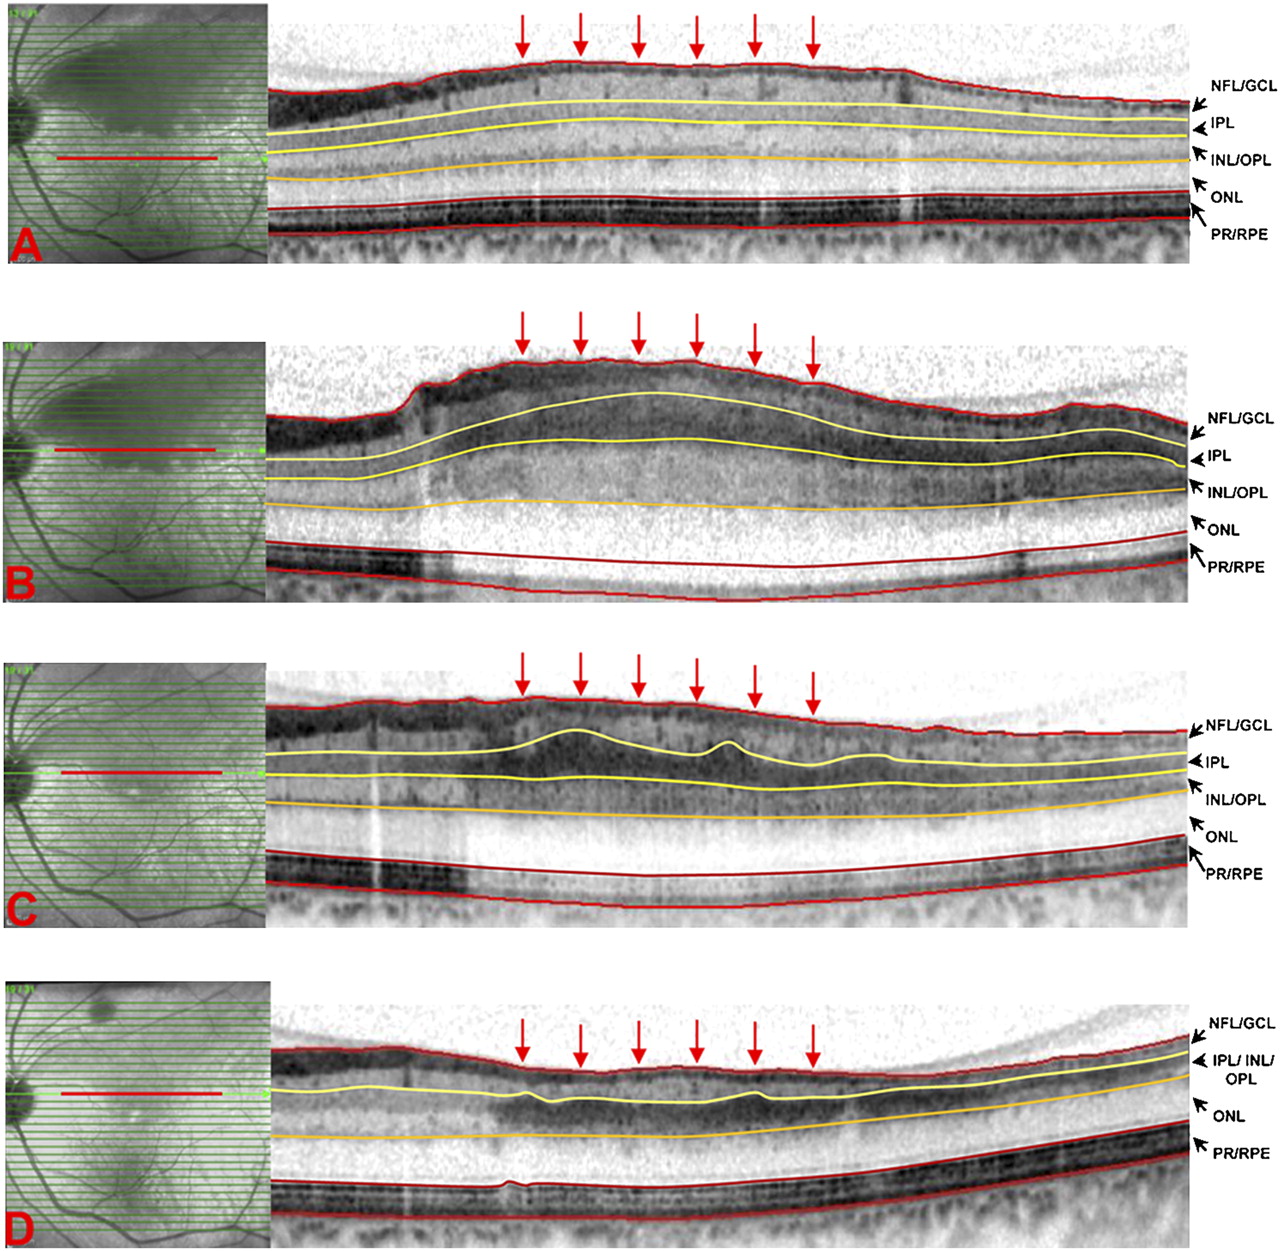
Spectral-domain OCT scans of a case with acute branch retinal artery occlusion (BRAO), 24 h after the first symptoms (A, B) and 2 weeks (C) and 2 months (D) thereafter. For analysis of retinal layers, scans in the area of BRAO (B, C, D) and as a normal counterpart, in the anatomically corresponding area in the non-involved half of macula (A) were selected. Retinal layers were manually segmented as illustrated, and layer thickness was measured at six locations within the selected scans (locations indicated by the six perpendicular arrows). Swelling of the inner retina is most notable in the increased thickness of the inner plexiform layer (IPL) followed by the inner nuclear layer/inner plexiform layer (INL/IPL) and nerve fibre layer/ganglion cell layer (NFL/GCL) (A, B). The IPL could not be distinguished from the INL/IPL at month 2 (D). The outer nuclear layer (ONL) shows a slight increase in thickness in the acute phase (A), and the photoreceptor/retinal pigment epithelium (PR/RPE) complex retained stable thickness values during the entire follow-up (B, C, D).

Infrared fundus images with the 31 superimposed spectral-domain OCT scan lines of the patient shown in figure 1 at acute presentation. The central foveal scan is indicated by the yellow line represented by scan No 16. Scan No 19 showed the highest macular oedema, and as this scan is three scans apart from the central fovea, scan No 13 was selected as the normal counterpart in the non-involved macular region. The selected scans in the normal counterpart (A) and the affected region (B) are indicated with a red line.
Neurosensory layers were segmented using the manual adjustment to the segmentation lines, and layer thickness was measured at six different locations within the selected scans. Segmentation measurements performed at each scan location are illustrated in figure 1. Delineations include thicknesses of the nerve fibre layer/ganglion cell layer (NFL/GCL), inner plexiform layer (IPL), inner nuclear layer/outer plexiform layer (INL/OPL), outer nuclear layer (ONL) and photoreceptor layers together with the retinal pigment epithelium (PR/RPE). In addition, the mean retinal thickness was assessed.
To improve reliability, the segmentation measurements were performed independently by two certified OCT readers (MR and GD) of the Vienna Reading Center, blinded from clinical data regarding the BRAO and the results of the other reader.
Statistical analysis
All calculations were performed using SPSS for Windows Version 17.0. The mean of six measurements per scan was used to calculate the difference between layer thickness in the affected and unaffected areas. Statistical analysis was based on the means of the two independent grading measurements. A two-sided paired t test was used for analysis of changes in total retinal and retinal layer thickness. A p value of ≤0.05 was considered statistically significant after Bonferroni multiple test correction.
Results
Demographics
The study comprised 11 male and six female patients with a mean age of 70±12 years (range: 55–89 years). Temporal branch arteries were involved in all eyes with eight involving the inferior macula and nine the superior macula. Patients with acute BRAO were included within 36±5 h after onset of symptoms with a mean BCVA of 0.7±0.2. The median time interval from onset of symptoms to study examination in chronic BRAO was 19 months (4 months to 5 years) with a mean BCVA of 0.6±0.3.
Course of intraretinal changes in acute BRAO
Table 1 summarises the change in segmentation results of retinal layers in affected areas of acute BRAO compared with topographically corresponding non-affected areas in this group during a 3-month follow-up. The subgroup analyses of measurements at weekly intervals during the first month are shown in table 2. Owing to the small sample size, no statistically analyses of significance level were performed.
Thickness values of different retinal layers in affected areas and in topographically corresponding non-affected areas of eyes with branch retinal artery occlusion (BRAO): monthly follow-up of eight patients with acute BRAO.
Thickness values of different retinal layers in affected areas and in topographically corresponding non-affected areas of eyes with branch retinal artery occlusion (BRAO): weekly follow-up of three patients with acute BRAO during the first month
At initial examination, in the BRAO area, the IPL was increased by 80% (p<0.001) compared with corresponding non-affected areas showing the most pronounced increase in all retinal layers (figures 1 and 3). Moreover, in acute ischaemia, the IPL also presented an enhanced hyper-reflectivity compared with the other layers. A highly significant increase was also measured in the INL/OPL (48% increase, p<0.001) and the NFL/GCL layer (35% increase, p=0.002). The smallest change was found at the level of the ONL with a mean increase of 21% (p=0.003), and the photoreceptor/retinal pigment epithelium (PR/RPE) complex retained stable thickness values. The mean increase in total retinal thickness in ischaemic retina compared with the anatomically corresponding healthy counterpart was 33% (p<0.001). This acute increase in thickness was followed by a continuous regression of total retinal oedema by 30% (p<0.001) at month 1, 17% (p=0.002) at month 2 and 4% at month 3, rendering the delineation of the specific retinal layers of the inner retina more difficult. From month 2, the IPL could not be distinguished from the INL/OPL.

(A–D) Occlusion of the infertior temporal artery in the left eye, showing an oedematous area along the inferior temporal branch and a partially compromised fovea. Serial spectral-domain OCT macular thickness maps and high resolution A scans across the fovea recorded at day 0 (A), month 1 (B), month 2 (C) and month 3 (D). The scans show an increase in retinal thickness in the inferior macula as a result of oedema in the inner retinal layers. The oedema subsequently resolved at month 1 (B) with decreasing macular thickness at month 2 (C). (E, F) Infrared fundus images with the superimposed OCT scan-lines and the selected B-scans for segmentation measurements at baseline. The central foveal scan is indicated by the yellow line, and the selected scans in the normal counterpart (E) and the affected region (F) are indicated with a red line. (G) Fluorescein angiography showing asymetry in vascular filling in the early phase of the examination.
Intraretinal changes in chronic BRAO
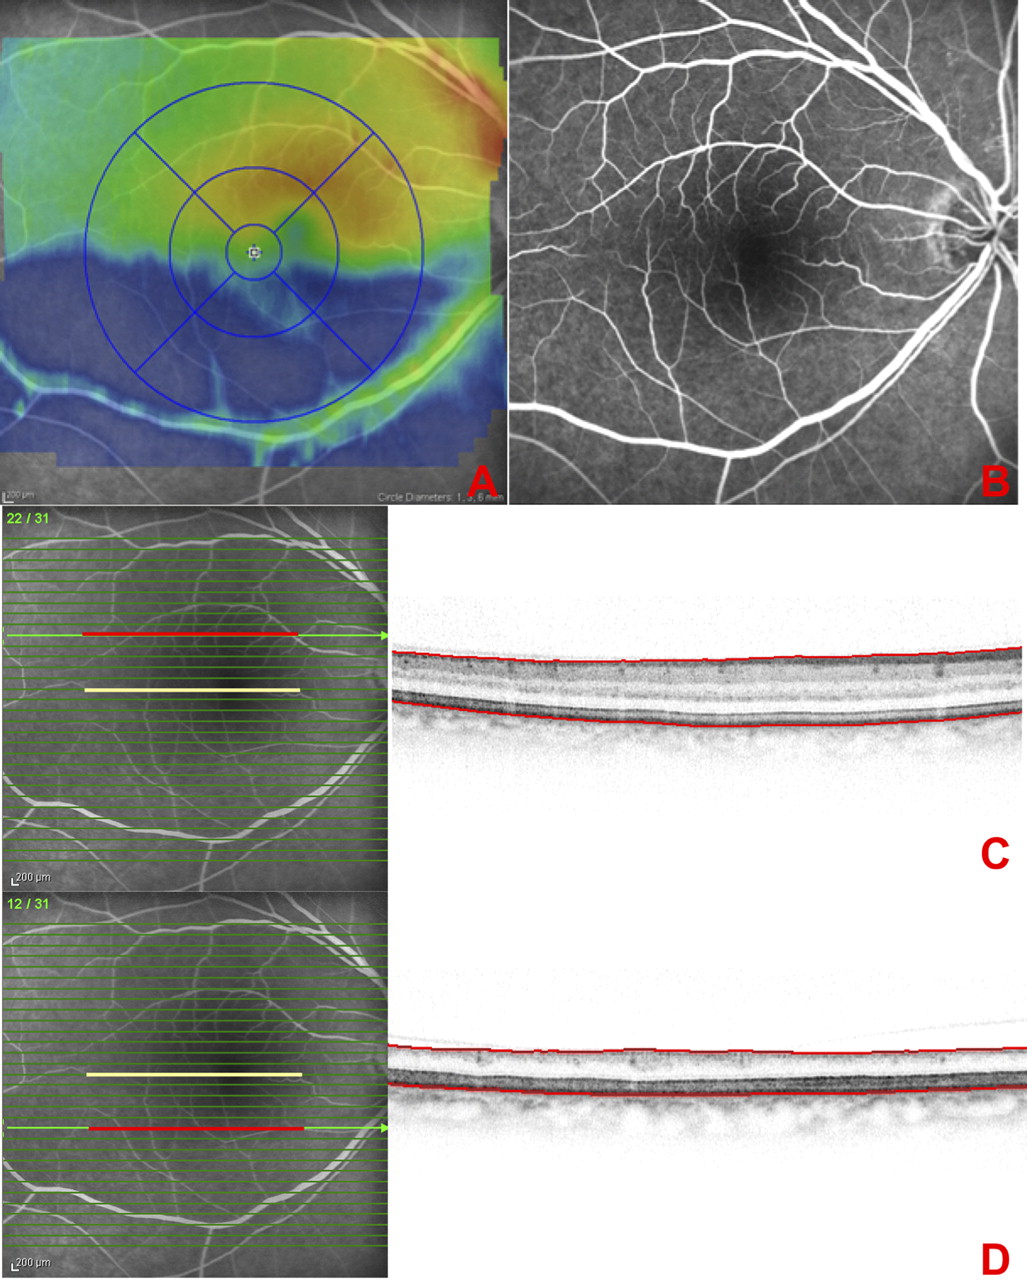
Analysis of the nine patients with chronic BRAO revealed a stable atrophy of inner retinal layers without any differences between patients examined between 4 months and 5 years after the initial event. The mean total retinal thickness of affected areas was 217±7 μm, showing a reduction of 33% (p<0.001) when compared with the corresponding healthy counterpart (326±14 μm). SD-OCT A-scans show an intact ONL and photoreceptor/ retinal pigment epithelium complex even in a patient 5 years after BRAO and an atrophic inner retina without differentiation between separate neurosensory layers (figure 4). Table 3 summarises segmentation results.
(A) SD-OCT thickness map of a patient with right inferior branch retinal artery occlusion (BRAO), 5 years after diagnosis demonstrating inferior macular thinning. (B) Fluorescein angiography showing no asymetry in vascular filling in the early phase of the examination. (C, D) Infrared fundus images with the superimposed OCT scan-lines and the selected B-scans for segmentation measurements. The central foveal scan is indicated by the yellow line, and the selected scans in the normal counterpart (C) and the affected region (D) are indicated with a red line. The selected scan in the BRAO region shows an intact ONL and photoreceptor/retinal pigment epithelium complex, and an atrophic inner retina without possible distinction between the single layers (D).
Thickness values of different retinal layers in affected areas and in topographically corresponding non-affected areas of eyes with branch retinal artery occlusion (BRAO): examination of nine patients with chronic BRAO
Discussion
OCT is a non-invasive imaging technology that allows for serial monitoring of retinal alterations over time. In the literature, there are few studies using OCT for imaging retinal changes following CRAO/BRAO.13–16 These data describe in detail the in vivo changes of retinal layers after BRAO and the longitudinal evaluation of layer thickness based on enhanced visualisation and quantification analyses using SD-OCT. Most importantly, an eye-tracking system was used to allow for point-to-point comparison during intraindividual follow-up.
In the present study, we aimed to compare the BRAO area with the corresponding unaffected area in vivo. Therefore, patients with CRAO were excluded from the study. Owing to a pathological variability in patients' fixation, comparison of CRAO eye with the healthy contralateral eye does not allow reliable results for comparison. In our study, however, patients with BRAO had reliable fixation during OCT imaging.
Structural damage following BRAO in our and previous studies was confined to the inner retina. Interestingly, the IPL showed the highest relative increase compared with the INL/OPL and NFL/GCL, characterised by optical hyper-reflectivity of that region with subsequent shadowing and attenuation of optical reflectivity of the subjacent structures. The distinct thickness increase in the IPL at acute presentation decresed rapidly during follow-up, resulting in loss of differentiation between the IPL and INL/OPL already at month 2. This suggests that these layers are particulary involved in the pathophysiology of BRAO.
However, when interpreting these results it should be considered that in the acute phase of BRAO, the exact boundaries of different layers might be blurred, and the reflectivity changes may not specifically reflect the exact boundaries of retinal layers. This might be a limitation when using solely OCT technology for identification of structural changes in conditions where the optical properties of the retina are probably altered, such as in acute BRAO.
Experimental histopathological studies in rats describe a disruption of the inner blood–retinal barrier in the hypoxic retina with increased permeability of retinal blood vessels.20 The central retinal artery provides the blood supply for the inner retinal layers. The two main capillary networks arising from the arterial branches are located at the level of the GCL and mainly at the junction of IPL and INL. It is therefore conceivable that ischaemia causes swelling of these layers in the acute phase, which is confirmed by changes in OCT reflectivity and thickness in acute BRAO when compared with anatomically corresponding healthy areas in our study. These alterations might not only be related to ischaemia, since it has been shown that a multitude of factors including increased vascular endothelial growth factor and nitric oxide production, free radicals and inflammatory mediators are involved in the structural damage of retinal tissue in such conditions.21 The preservation of the ONL and photoreceptor/retinal pigment epithelium complex in chronic BRAO clearly supports the concept that these layers are supported by the choriocapillary vasculature.
In animal models, it was proposed that the extent of retinal damage is directly related to the duration of the ischaemic impact.22 Massive and irreversible retinal damage was observed in eyes with CRAO of more than 240 min.23 There are several autopsy studies on human eyes with CRAO: Dahrling24 found diffuse oedema of inner retinal layers in one eye 60 h after CRAO as well as a severe reduction in ganglion cells. The increase in retinal thickness was related to intracellular oedema in the INL and IPL, with no evidence of any fluid in the extracellular space originating from retinal capillaries. Deeper layers from the INL outwards were not affected.
In our study, all patients presented at time intervals longer than 240 min after the initial onset of the event, but it is often difficult to determine the duration of arterial occlusion and especially the intensity of residual retinal circulation. As expected, significant microstructural deterioration of retinal layers was observed within 36±5 h, but because of the variability of initial presentation time, earlier intraretinal changes could not be described in this study. A further limitation of the study is the relatively small number of patients included.
In conclusion, this report describes in vivo changes in the ultrastructure of neurosensory layers in BRAO at acute presentation and during follow-up. Segmentation of distinct layers revealed a selective and pronounced swelling of inner retinal layers, from the NFL and GCL down to the INL and IPL, while the deeper layers such as ONL were only discretely or not affected at all such as PR/RPE, which were well preserved even after longstanding ischaemia by month and years. Hence, SD-OCT allowed a detailed in vivo documentation of topographic oxygen dependence and consecutively ischaemia-related localised alteration of the inner portion of neurosensory layers dependent on the supply of the retinal vasculature. The barrier between retinal and choroidal oxygenation is obviously represented by the ONL showing the least morphological response. Regression of total retinal thickness was highest during the first month (30%, p<0.001), less pronounced during the second (17%, p=0.002) and not statistically significant during the third month (4%) (figure 3). These in vivo data may offer an excellent insight into pathophysiology of retinal ischaemia including topography and time-course of neurosensory change.
References
Footnotes
Competing interests None.
Ethics approval Ethics approval was provided by the local ethics committee at the Medical University of Vienna.
Provenance and peer review Not commissioned; externally peer reviewed.
Linked Articles
- At a glance