Article Text

Abstract
Aims To evaluate the choriocapillaris (CC) flow alterations around geographic atrophy (GA) in eyes with dry age-related macular degeneration.
Methods Using a swept-source optical coherence tomography angiography (SS-OCTA) device, two volume 6×6 mm scans were acquired in patients with GA presenting between June and December 2017 at the Doheny-UCLA Eye Centers. The area of GA was delineated on the en face structural OCT fundus images. For each eye, the en face OCTA slabs at the level of the CC from the two acquisitions were averaged and compensated for signal loss using the corresponding structural en face images. The resulting images were binarised and analysed for the percentage of flow voids in the para-atrophy zone (a 500 µm wide ring around the immediate edge of the atrophy) and in the peri-atrophy zone (a 500 µm wide ring around the para-atrophy zone edge), the latter considered as a reference in the comparative analysis.
Results Thirty eyes of 20 patients were enrolled. The percentage of flow voids in the para-atrophy zone was 27.23%±6.29% and was significantly higher than in the surrounding peri-atrophy zone (23.4%±6.01%; p<0.001). There was no significant correlation between the flow void percentage in these regions and age, visual acuity, extent of the atrophic area or central choroidal thickness.
Conclusions A significant impairment of the CC flow is present in the zone immediately surrounding the GA lesions strengthening the hypothesis that CC alterations may be relevant to the progression of GA.
- macula
- retina
- imaging
- geographic atrophy
Statistics from Altmetric.com
Introduction
Geographic atrophy (GA) is a late stage manifestation of dry age-related macular degeneration (AMD). It is defined as any sharply delineated roughly round or oval area of hypopigmentation or depigmentation with increased visibility of the underlying choroidal vessels and of at least 175 µm in diameter on 30 or 35 degrees colour fundus images.1
A more recent optical coherence tomography (OCT)–based classification defines GA as complete retinal pigment epithelium (RPE) and outer retinal atrophy, in the absence of choroidal neovascularisation (CNV) (present or previous), measuring at least 250 µm in diameter.2
GA results from the degeneration of photoreceptors, RPE and choriocapillaris (CC). Nevertheless, while the RPE and outer retinal degeneration are well visualised using OCT, CC disruption is difficult to identify in vivo on structural OCT alone. OCT angiography (OCTA) is a recent technique that allows the visualisation of the retinal vascular networks in a depth-resolved fashion,3 making it possible to visualise the loss of CC flow under the atrophic patches4 in patients with GA. Recently, Sacconi et al,5 using a spectral domain (SD)-OCTA device, demonstrated that the CC flow impairment can be observed in areas around the atrophic lesions even where the RPE appears to be intact.
Whether the RPE or the CC disruption occurs first is still a topic of debate,6–11 and the relatively poor depth penetration of the SD-OCTA may compromise CC assessment, particularly in the presence of overlying deposits or retinal thickening with an intact RPE. Indeed, the 840 nm light wavelength used by most SD-OCT devices is highly scattered by the RPE, limiting light penetration into the choroid.12–14
Swept-source OCTA (SS-OCTA) uses a different light to obtain the en face images of the vascular networks. Using a longer wavelength (1050 nm), the SS-OCTA offers a deeper light penetration and provides higher quality images of the CC meshwork, which may resemble histological images in healthy eyes.15 Furthermore, the quality of the images may be significantly improved with post-acquisition processing methods such as the averaging of multiple images from multiple acquisitions.16 17
In pathological eyes, disease features and lesions may further impact the visualisation of the CC. For example, thick drusenoid deposits can attenuate or scatter the incident light creating a ‘shadowing’ effect on the underlying CC. Although this shadowing effect is less pronounced compared with SD-OCT, these alterations may confound quantitative analysis of the underlying CC. Recently, Zhang et al 18 developed a simple strategy to compensate this signal loss under drusen combining the en face structural images with the respective angiograms.
In this study, we used a combination of averaging and signal compensation on images acquired with a SS-OCTA in order to better study the CC flow around the areas of geographic atrophy, where the RPE appears to still be preserved.
Methods
In this prospective study, we acquired SS-OCTA images of consecutive patients with GA who were evaluated at the Doheny-UCLA Eye Centers by one physician (SRS) between June and December 2017. Eligible patients had GA in at least one eye without evidence of any other pathology involving the macula. Eyes with non-visually significant vitreoretinal interface disease, such as a subtle epiretinal membrane only visible by OCT, were not excluded. Myopia greater than 6 dioptres and presence of significant media opacities that could impact the quality of the OCT images were exclusion criteria for this study.
The study was performed in accordance with the Health Insurance Portability and Accountability Act and adhered to the principles of the Declaration of Helsinki.
All patients underwent a complete ophthalmic examination, including best-corrected visual acuity (BCVA) using ETDRS charts, slit-lamp biomicroscopy, tonometry and SS-OCTA.
Central choroidal thickness (CCT) was assessed by manually measuring at foveal centre from Bruch’s membrane to the sclera-choroidal border. To ensure the repeatability of the method, the measurements were repeated twice by two independent operators.
Imaging
Patients underwent SS-OCTA imaging with the PLEX Elite 9000 device (Carl Zeiss Meditec, Dublin, California, USA), which uses a swept laser source with a central wavelength of 1050 nm (1000–1100 nm full bandwidth) and operates at 100 000 A-scans per second. This instrument employs a full-width at half-maximum axial resolution of approximately 5 µm in tissue and a lateral resolution at the retinal surface estimated at approximately 14 µm. OCTA imaging of the macula was performed using a scan pattern with a 6×6 mm area (500 A-scans×500 B-scans) centred on the fovea. Each eye was repeatedly imaged with pupil dilation to obtain two OCTA volume scan sets with sufficient image quality (Signal Strength Index >7) that fulfilled the acceptance criteria of the Doheny Image Reading Center, as previously reported.17 19
A fully automated retinal layer segmentation algorithm was applied to the three-dimensional structural OCT data in order to segment the CC slab as defined previously (10 µm thick starting 31 µm below the RPE reference).20 This segmentation was then applied to OCTA flow intensity data to obtain vascular images. Maximum projection analyses of the flow intensity were performed to generate the en face images of the CC plexus (1024×1024 pixels). Before exporting all angiograms, projection artefact removal was performed using the automated algorithm of the instrument software.21 22
Post-acquisition image processing
To compensate for CC signal attenuation resulting from the RPE and pathological alterations at RPE/BM complex level (eg, basal laminar deposits), a previously described method was applied.18 Briefly, for each eye, the CC layer was first segmented from the structural OCT and the associated flow slab was then identified from the angiogram. An inverse transformation was applied to the en face structural CC image to enhance the attenuated signal under drusen, where a Gaussian smoothing filter (3×3 pixel kernel) was used to minimise speckle noise. Then, a multiplication between the en face CC flow image and the smoothed, inverted CC structural image was performed. By this approach, the shadowing effect under drusenoid deposits was compensated while the signal in unaffected regions remained unchanged (figure 1).

Images derived from two different acquisitions (A and B) underwent an identical post-acquisition quality enhancement strategy by signal compensation and averaging, in order to obtain the final high quality image of the choriocapillaris flow (C). For each acquisition a 10 µm thick slab between 31 and 41 µm under the RPE reference was segmented to extract an en-face image of the choriocapillaris from the angiogram (D) and the structural OCT (E). After being inverted and blurred (G), the structure image was multiplied with the angiogram (D) in order to compensate the angiogram for regions of signal loss (e.g. under drusen). The resultant compensated angiogram images (F) were then registered and averaged to obtain the final Choriocapillaris en-face angiogram (C).
For each eye, the resulting compensated CC en face images generated from two different OCTA cube scan sets were stacked to create a two-frame video and were registered before multiple image averaging. A central square area of 819×819 pixels was cropped for registration and averaging. Registration was first performed on the two-frame video based on the superficial capillary plexus en face images, as previously reported.17 This same transformation was then applied to the CC layer, as described in detail in a previous publication.23 After registration, the two frames of the CC were compounded into a single image by projecting the average intensity (figure 1).
Quantitative image analysis
The resultant averaged CC en face image was exported and analysed using ImageJ software V.1.50 (National Institutes of Health, Bethesda, Maryland, USA; available at http://rsb.info.nih.gov/ij/index.html)24 and binarised for quantitative image analysis of the signal voids. The Phansalkar method (radius, 15 pixels) was used to binarise the images, as previously described.20 23 25 These images were then processed with the ‘Analyze Particles’ command in order to count the flow voids as a percentage of the area analysed.
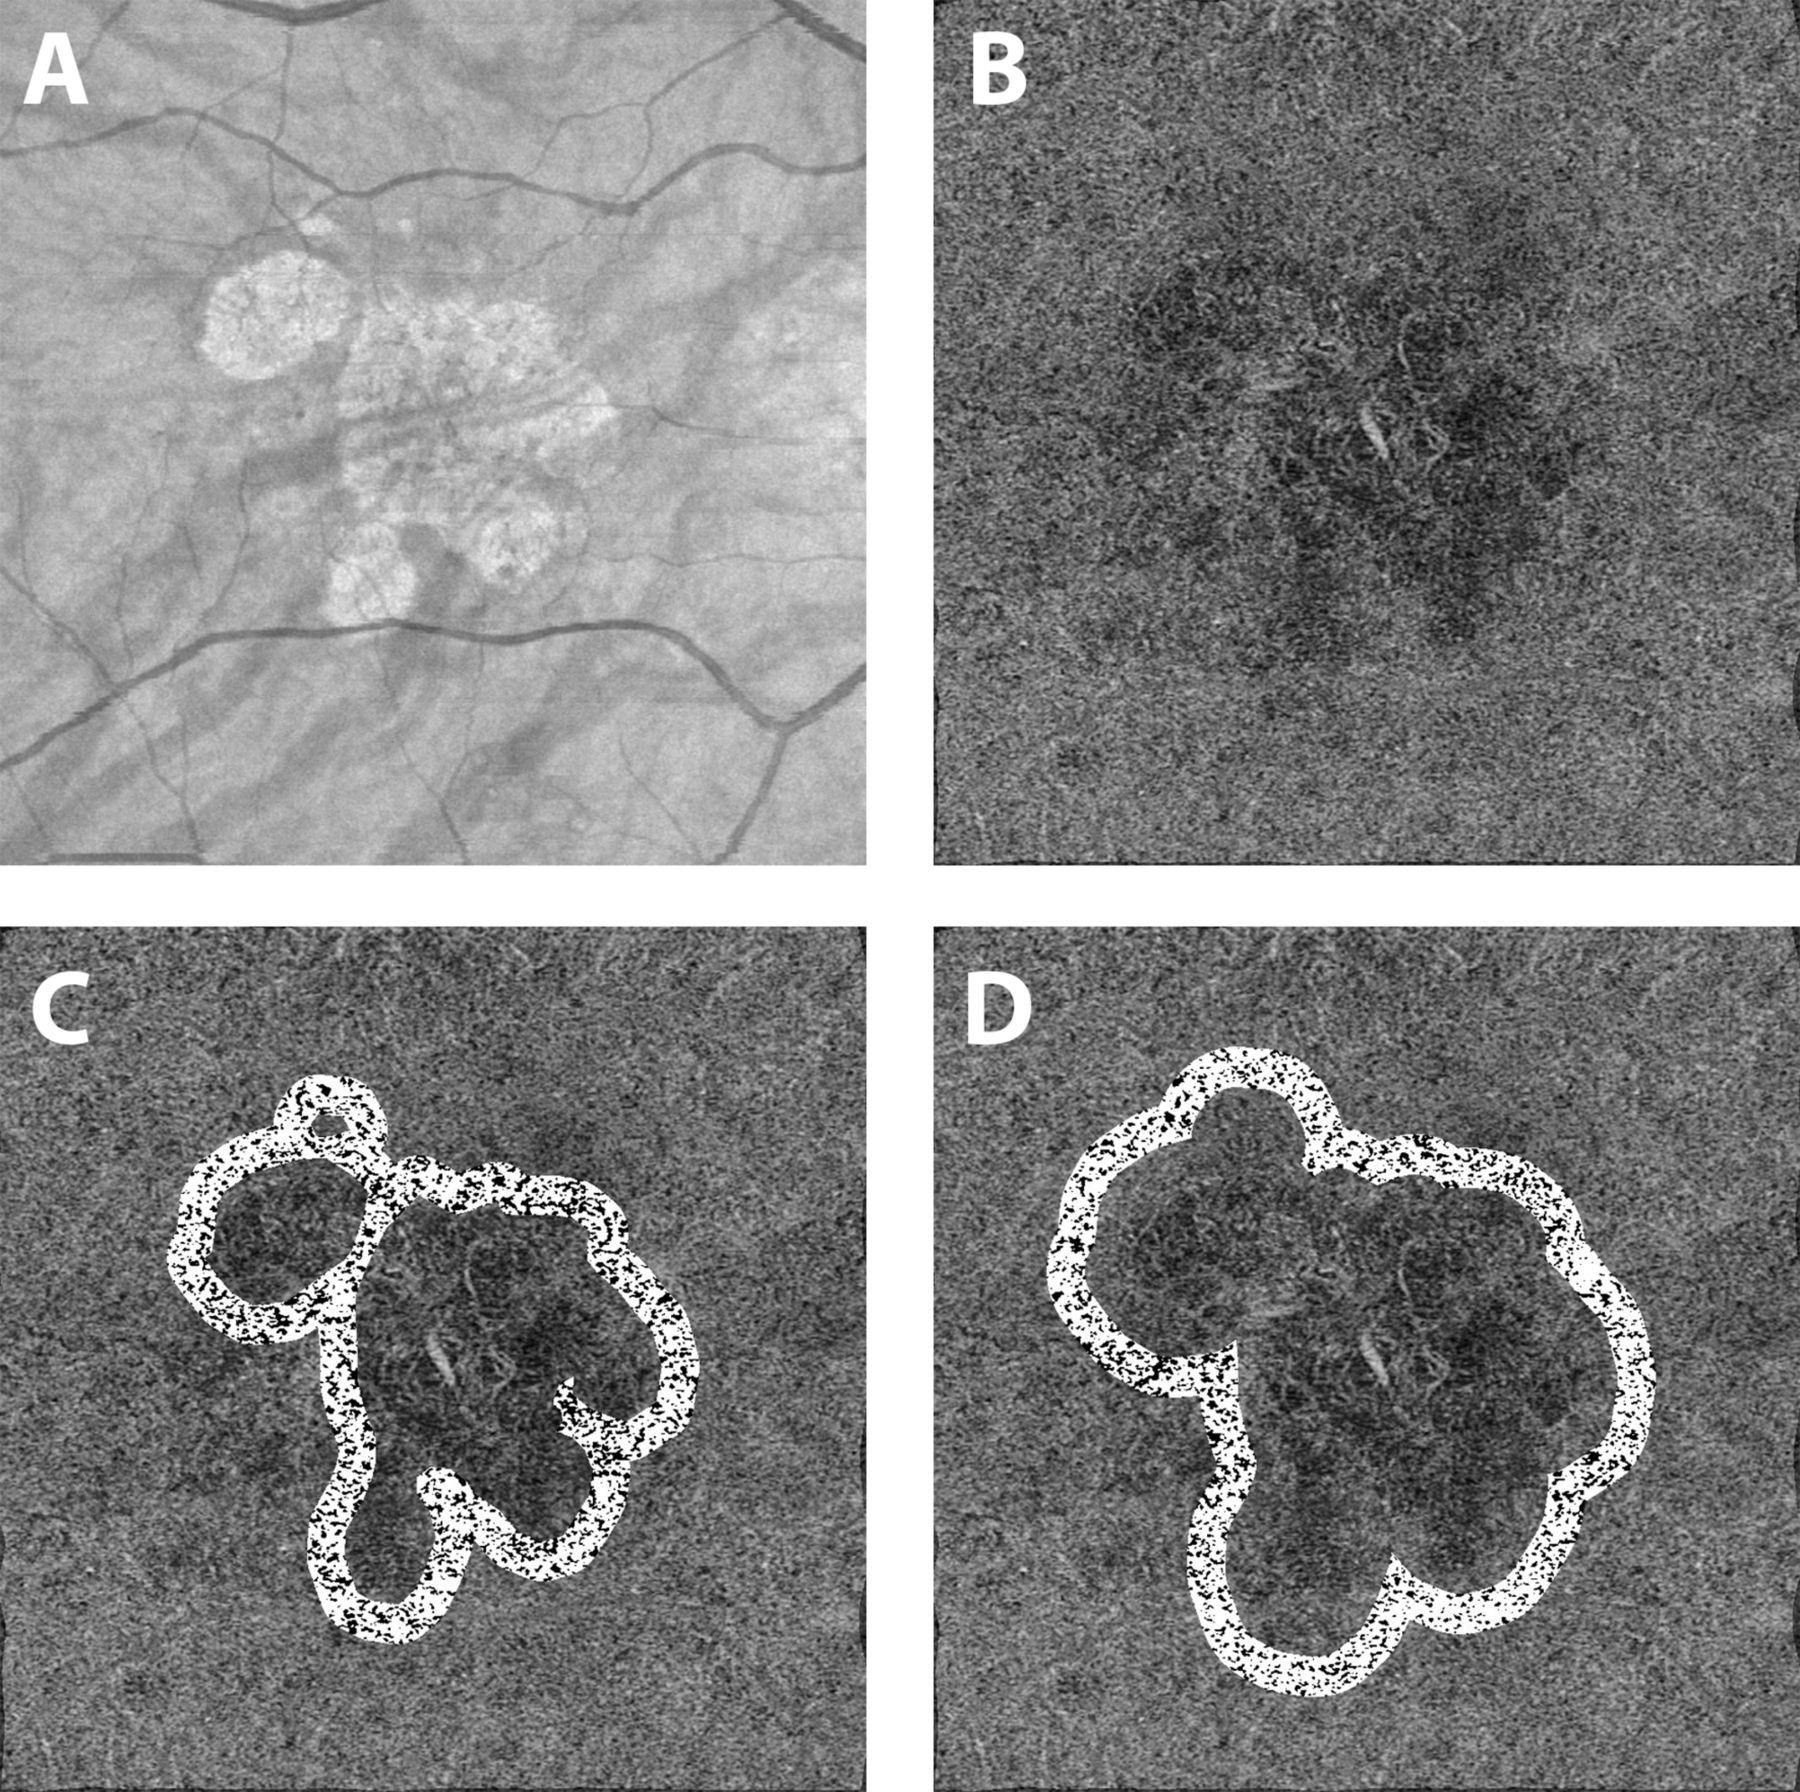
The quantitative analysis was performed over two concentric 500 μm wide rings around the GA lesion edge (following the contour of the GA lesion) to assess the CC surrounding the atrophy (figure 2).

The OCT fundus image (A) was used for the manual delineation of the geographic atrophy (GA) area. The compensated, averaged choriocapillaris angiogram (B) was binarized and analyzed for percentage of flow voids in two concentric 500 µm wide areas around the GA (C and D). The inner ring was defined as the para-atrophy zone (C), while the outer ring was defined as the peri-atrophy zone (D).
The 500 µm cut-off was arbitrarily chosen, in accordance with a previously published study.5 The inner ring was defined as the para-atrophy zone, while the outer ring was defined as the peri-atrophy zone. The peri-atrophy zone was used as a reference to assess the para-atrophic CC.
To isolate the GA region, we used the OCT fundus image as previously described.26 This image is the en face reconstruction of the sum of all the signals coming from each of the A-scans acquired.27 GA appears as a bright area on the image due to the increased penetration of light into the choroid caused by the overlying RPE and outer retina atrophy.27 28 The borders of the GA region were manually segmented and verified using the corresponding structural B-scans to ensure the integrity of the RPE outside the selection.
To obtain the para-atrophy zone, we used the ‘Distance Map’ ImageJ function on the selected GA region. The ‘Distance Map’ function automatically delineates a border 500 µm displaced from the atrophy edge, exactly following the contour of the GA border. Furthermore, in case of multifocal lesions, the ‘Distance Map’ function on the ‘binarized’ image allows us to delimit those areas within 500 µm of the edge of all the atrophy lesions in the image (without any size limit) by excluding areas occupied by adjacent lesions. The peri-atrophy zone was determined by applying the same method; specifically, the ‘distance map’ function was used to delineate a border displaced 500 µm from the para-atrophy zone edge.
As CC flow voids are believed to show a regional dependence (even in normal eyes) with greater flow voids centrally compared with more peripheral regions of the macula, we performed an additional layer of analysis to exclude this potential confounder. Specifically, for each case, we also selected and analysed two 500×500 µm square regions in the para-atrophy and peri-atrophy zones, which were equidistant from the foveal centre. The first square was drawn in the peri-atrophy zone at the innermost point of its inner boundary. The second square had to satisfy the following conditions: (1) location in the para-atrophy zone; (2) the difference between the distances of the centres of mass of the two squares from the fovea should not be more than 10 pixels (figure 3). If these conditions were not satisfied, the subject was excluded from this additional analysis. If more than one square could satisfy these conditions, the closest in distance to the first square was chosen for the analysis.

The OCT fundus image (A) was used for the manual delineation of the geographic atrophy (GA) area while the averaged angiogram of the superficial vascular complex (B) was used as a reference to identify the foveal center. In the compensated, averaged choriocapillaris angiogram (C) a 500x500 µm square area (#) was drawn at the innermost point of the outer boundary of the para-atrophy zone; all possible positions fordrawing a similar square equidistant from the fovea were considered within the peri-atrophy zone (*). Among these positions, the square which was most similar in distance to the foveal center as the peri-fovealsquare was selected for comparative analysis (D).
The entire procedure was repeated by two experienced reading centre OCT graders (MN and WF) in order to investigate the repeatability of all measurements. All values were then averaged for use in the subsequent statistical analysis.
Statistics
Statistical analyses were performed using SPSS Statistics V.20 (IBM). Intraclass correlation coefficients (ICCs) were calculated for atrophy area, CCT and flow voids measurements. A Wilcoxon signed-rank test was performed to test the difference in percentage of flow voids in the para-atrophy zone versus the peri-atrophy zone. Generalised estimating equations (GEEs) were used to compare the means and test the associations between percentage of flow voids and age, BCVA, CCT and atrophy dimension.
Results
Thirty eyes of 20 patients (six men, mean age 85.19±9.25 years) were enrolled in the study. The fellow eyes of 10 patients were excluded for intermediate AMD in three eyes, CNV in five eyes and the inability to acquire scans of sufficient quality scans in two eyes (due to poor fixation).
Mean BCVA was 0.51±0.31 logarithm of the minimum angle of resolution (logMAR) (median 0.5 logMAR; range 0–1) and the mean CCT was 221.16±161.22 µm (median 193.5 µm; range 48–767).
The mean area of the GA lesion was 7.86±6.06 mm2 (median 6.32 mm2; range 0.63–21.33 mm2).
The percentage of flow voids in the entire para-atrophy zone was 27.23%±6.29% and significantly greater than the surrounding entire peri-atrophy zone, where it was 23.4%±6.01% (p=0.008).
The additional, comparative analysis of the equidistant 500×500 µm para-atrophy and peri-atrophy squares could be performed in all 30 eyes. The result of this analysis also demonstrated a significantly higher percentage of flow voids in the para-atrophy zone (29.6%±7.88 %) compared with the peri-atrophy zone (22.8%±5.86 %) with a p value <0.001.
GEE analysis found no significant correlations between the percentage of flow voids in each zone and various other parameters including age, BCVA, extent of the atrophic area and CCT.
Repeatability assessment
GA area measurements obtained from manual delineation of the atrophy lesion between graders had an ICC of 0.997 (95% CI 0.95 to 0.99). CCT measurements had an ICC of 0.939 (95% CI 0.869 to 0.972). The calculation of the flow voids percentage in the peri-atrophy and para-atrophy zone had an ICC of 0.912 (95% CI 0.895 to 0.927) for the entire zones and 0.897 (95% CI 0.875 to 0.923) for the 500×500 µm squares.
Discussion
In this study, we investigated the CC around the GA using SS-OCTA and with compensation analysis to mitigate the impact of signal attenuation caused by disease-related alterations at the level of the outer retina/RPE/BM complex. The image of the CC provided by current OCTA instruments shows a granular appearance with small bright regions interspersed with small dark regions. The known anatomic structure of the choriocapillaris does not appear to explain these dark areas, hence they are probably the result of a relative decreases in local flow signal below the threshold of detection. As such, these small areas are called flow voids.20 21 The analysis of these presumed CC flow voids has been evaluated in many posterior segment diseases and has been inferred to reflect CC impairment relevant to disease pathophysiology.19 25 29–33
Our findings of a greater extent of flow voids in the CC immediately surrounding the GA lesion compared with more remote regions would appear to support the hypothesis that CC loss may precede overt RPE degeneration since the CC appears to be significantly impaired even in regions where the RPE layer appears to be intact structurally.
Our OCTA findings are consistent with previous histological studies. Biesemeier et al examined four postmortem GA eyes using a combination of light and electron microscopy and observed that CC loss occurred in regions underlying intact retina and RPE, and concluded that CC breakdown precedes RPE degeneration in AMD.9
Whereas histological studies provide a direct visualisation of the vascular structure, OCTA findings provide insight into CC blood flow, with the absence of OCTA signal indicating the absence of blood flow above the threshold of detection rather than a complete absence of blood flow.6
Kvanta et al reported that CC flow was reduced outside GA lesions extending beyond the GA margin in a qualitative evaluation of CC using SD-OCTA.11 As previously mentioned, the current commercially available SD-OCT machines using a ~840 nm wavelength may be confounded by signal loss, which can impact assessment of the CC in the setting of pathology such as drusen. Furthermore, SD-OCT systems are affected by a signal roll-off that further degrades the signal with depth. Longer wavelength SS-OCT systems are less affected by RPE attenuation and do not suffer from as steep a signal roll-off, making long wavelength SS-OCT ideal for CC imaging.
Recently, Moult et al performed a qualitative analysis of the CC in eyes with nascent geographic atrophy and drusen-associated geographic atrophy using SS-OCTA, and demonstrated CC flow impairment under the area of the lesions and also throughout the imaged field.7
Our study is the first, however, to report quantitative data on the CC around GA using a SS-OCTA approach with further enhancement of image quality using a combination of averaging and signal loss compensation. In particular, we focused our analysis on the para-atrophy region in order to test our hypothesis that a higher level of impairment would be present in the immediate vicinity of the lesion border where the RPE was still structurally intact. It should be noted, however, that a structurally intact RPE on OCT does not mean a normally functioning RPE.
Sacconi et al attempted to further clarify this point by comparing the CC flow under the regions surrounding the GA, which were rated as hyperautofluorescent on fundus autofluorescence (FAF) images, and compared them to isoautofluorescent regions.5 While CC flow impairment was present in both regions, it was significantly greater in the hyperautofluorescent areas, which are thought to be regions of significant RPE impairment. Based on these findings, they hypothesised that the first injury in GA occurs at the level of the CC.
Despite this finding, we would argue that it is still difficult to exclude the possibility that a combination of both RPE and CC flow impairment are relevant to the initiation of the atrophic process. For example, the earliest dysfunction of the RPE may still be undetectable using traditional FAF. Thus, it is still possible that RPE dysfunction could be the primary step in GA development and progression with secondary alterations to the underlying CC (eg, due to loss of VEGF production by a dysfunctional RPE), leading ultimately to RPE loss and further progression of GA.8 10
Given the important purported role of the CC in the development of GA, this uncertainty hinders our understanding of disease pathophysiology and progression. The development of new tools to probe RPE function and health (eg, fluorescence lifetime imaging ophthalmoscopy) and prospective longitudinal studies investigating the correlation between CC flow impairment and GA progression may provide additional insights into this question.
Flow voids in CC are thought to demonstrate a regional dependence even in normal eyes, with a higher number of flow voids in central portions of the macula compared with more peripheral regions (personal communication, Phil Rosenfeld). This phenomenon is even more remarkable in older subjects (>50 years old). Thus, studies comparing CC flow voids within regions of interest in the macula5 may be confounded by this normal topographical variation in the density of flow voids. To address this potential, we performed an additional analysis comparing the CC within our regions of interest (para-atrophic and peri-atrophic zones), which were equidistant from the foveal centre. We were able to identify such equidistant regions because of irregular and multifocal configurations of our GA lesions. This additional analysis confirmed the apparent higher impairment of CC flow in the region immediately surrounding the GA lesion.
Our study is not without limitations including its cross-sectional nature and small sample size. In addition, as we were not able to perform variable interscan time analysis, we could not distinguish among various levels of severity of CC impairment. Even if such an analysis was employed, however, we would still be limited by the range of flows detectable by current OCTA technology. Also, in our cohort, we included all subjects with GA and did not exclude cases with a pachychoroid GA phenotype.34 In a post hoc review, we could identify three subjects (three eyes) who met criteria for pachychoroid GA, but this small number was insufficient to allow a subanalysis of this cohort. We do not believe, however, that these few pachychoroid GA cases influences the main study finding, and the absence of a correlation between the flow voids and the CCT in this cohort would appear to support this contention. Finally, we used only OCT to detect and outline the borders of the GA lesion. While we now have consensus definitions for OCT on atrophy,2 and measurement of atrophy by OCT are well correlated with measurements from FAF,35 36 FAF and OCT may not be measuring the exact same thing. Even though FAF has been considered the gold standard to identify the areas of atrophy, en face OCT has been shown to be a valuable tool for detecting the lesions (even for earlier lesions such as nascent GA)26 37 38 and for following their progression.39
Our study also has many strengths including its prospective design and the use of SS-OCTA. In addition, we used a signal compensation method as well as image averaging to further enhance image quality and reduce the potentially confounding impact of signal attenuation on OCTA-derived CC measurements. Moreover, we developed a method to cope with the irregular border and multifocal nature of GA lesions to more precisely study the status of the surrounding CC. Finally, we addressed the potential confounding effect of regional variations in CC flow voids by comparing regions equidistant from the foveal centre.
In summary, our study confirms that significant flow impairment of the CC may be present in regions surrounding GA lesions, further highlighting the relevance of the CC to the pathophysiology of GA. Future larger longitudinal studies will be required in order to determine whether the severity of these surrounding regions of CC flow impairment is predictive of GA progression.
References
Footnotes
Contributors MN, MSI and SRS were involved in study design, collection and analysis of the data as well as drafting of the manuscript. YS, WF, EB and AU were involved in study design, data collection and critical review of the manuscript.
Funding The authors have not declared a specific grant for this research from any funding agency in the public, commercial or not-for-profit sectors.
Competing interests MSI: Thrombogenics (C), Omeros (C), Boehringer Ingelheim (C), Genentech (C), Quark (C), Astellas Institute for Regenerative Medicine (C), Allergan (C). SRS: Allergan (C,F), Carl Zeiss Meditec (F), CenterVue (C), Genentech (C,F), Heidelberg Engineering (C), Iconic (C), NightstarX (C), Novartis (C), Optos (C,F), Thrombogenics (C), Topcon (C).
Patient consent Obtained.
Ethics approval Institutional review board (IRB) of the University of California–Los Angeles (UCLA).
Provenance and peer review Not commissioned; externally peer reviewed.
Linked Articles
- At a glance