Article Text

Abstract
Background/aims To estimate 2015 global ophthalmologist data and analyse their relationship to income groups, prevalence rates of blindness and visual impairment and gross domestic product (GDP) per capita.
Methods Online surveys were emailed to presidents/chairpersons of national societies of ophthalmology and Ministry of Health representatives from all 194 countries to capture the number and density (per million population) of ophthalmologists, the number/density performing cataract surgery and refraction, and annual ophthalmologist population growth trends. Correlations between these data and income group, GDP per capita and prevalence rates of blindness and visual impairment were analysed.
Results In 2015, there were an estimated 232 866 ophthalmologists in 194 countries. Income was positively associated with ophthalmologist density (a mean 3.7 per million population in low-income countries vs a mean 76.2 in high-income countries). Most countries reported positive growth (94/156; 60.3%). There was a weak, inverse correlation between the prevalence of blindness and the ophthalmologist density. There were weak, positive correlations between the density of ophthalmologists performing cataract surgery and GDP per capita and the prevalence of blindness, as well as between GDP per capita and the density of ophthalmologists doing refractions.
Conclusions Although the estimated global ophthalmologist workforce appears to be growing, the appropriate distribution of the eye care workforce and the development of comprehensive eye care delivery systems are needed to ensure that eye care needs are universally met.
- epidemiology
- public health
- treatment surgery
This is an open access article distributed in accordance with the Creative Commons Attribution Non Commercial (CC BY-NC 4.0) license, which permits others to distribute, remix, adapt, build upon this work non-commercially, and license their derivative works on different terms, provided the original work is properly cited, appropriate credit is given, any changes made indicated, and the use is non-commercial. See: http://creativecommons.org/licenses/by-nc/4.0/.
Statistics from Altmetric.com
Introduction
Approximately 21% of the global population experiences vision loss and 36 million people have blindness.1 In the Universal eye health: a global action plan 2014– 2019, the WHO recommended that the Ministries of Health (MOHs) annually report the number of eye care professionals, including the cadre of ophthalmologists, to measure the progress of the WHO global action plan at a national level.2
In 2010, the International Council of Ophthalmology (ICO) surveyed 213 national societies of ophthalmology in 193 countries to gather data related to the global demographics of ophthalmologists.3 Despite over 200 000 ophthalmologists worldwide, there was a significant shortfall of ophthalmologists in developing countries, and the ageing population was growing faster than the profession. Recent studies of human resources in eye health in sub-Saharan Africa and Latin America have confirmed these trends of poor distribution and the inability of the cadre to keep up with the population rates.4–7 Amidst technological advances, population demand patterns and evolving models of care, complete data for eye health professionals is an integral component to understanding if we can meet the needs of the global population.
Unfortunately, annual data collection has not been easy, and there are no current targets proposed to interpret the WHO eye health indicator data.2 As demonstrated by a pilot study in Latin American countries, the development of appropriate mechanisms to implement data collection and reporting, and the collaboration between the private sector and the MOHs are considered essential to strengthen the WHO eye health indicator data.8 9 The authors suggested that performing a human resources eye health census every 5–10 years may better demonstrate how the eye health professionals in a country can meet the population’s demands and needs over time. Thus, the ICO aimed to update their ophthalmologist database based primarily on 2010 ophthalmologist data with 2015 data.
The primary objectives of the current study were to determine the total number of ophthalmologists at the national and global level, the ophthalmologist density at a national level, the annual ophthalmologist population growth trends, the number of years of training and the number of ophthalmologists performing cataract surgery, as well as refraction. Secondary objectives were to analyse the relationship of the 2015 data to the country’s income group, gross domestic product (GDP) per capita and prevalence rates of blindness and moderate and severe visual impairment.
Methods
The ICO carried out this survey study. The ICO Advocacy Committee developed a standardised English language, online questionnaire using SurveyMonkey (San Mateo, California, USA) to collect the global data on ophthalmologists for 2015. Ophthalmologists were defined as medical graduates [Medical Doctor (MD)or equivalent degree] who specialise in the eye and visual system.2 10 The survey included a link to the WHO global action plan.2 Respondents were requested to provide their best estimates in response to the following questions:
The number of private and public ophthalmologists in active practice in their country.
The estimated percentage of ophthalmologists routinely performing ≥100 cataract surgeries per year (<25%, 25%–49%, 50%–75% or >75%).
The estimated percentage of ophthalmologists routinely performing refraction (<25%, 25%–49%, 50%–75% or >75%).
Whether the number of practising ophthalmologists is decreasing gradually (<5% annually), decreasing rapidly (>5% annually), staying about the same, increasing gradually (<5% annually), or increasing rapidly (>5% annually).
ICO staff emailed the survey to presidents and chairpersons of ICO member and non-member ophthalmologist societies in May 2016 and asked recipients to respond by July 2016. Reminders were emailed to non-responders every 2 months through mid-2017. If the national society contact did not respond, data were then collected from other key informants, including MOH contacts, national prevention of blindness coordinators and acquaintances of the ICO officers and staff.
Survey results were converted into a Microsoft Excel spreadsheet for analysis. National data from 2010 and 2015 were checked for inconsistencies; wherever a ≥20% difference was observed, data were verified by contacting additional informants. The primary endpoints were:
The number of ophthalmologists at a global and national level.
Ophthalmologist density, defined as the number of active ophthalmologists per million population,2 based on the United Nations World Population Prospects 2015 data.11
Annual ophthalmologist population growth trends, at the national and global level.
The number of years of training at a national level.
The density of ophthalmologists performing cataract surgery, defined as the number of active ophthalmologists performing cataract surgery per million population.
The density of ophthalmologists performing refraction, defined as the number of active ophthalmologists performing refraction per million population.
The secondary endpoints were:
Ophthalmologist density disaggregated by the World Bank income groups [low-income countries (LICs), lower-middle income countries (LMICs), upper-middle income countries (UMICs) and high-income countries (HICs)].12
The relationship of ophthalmologist density to the prevalence rate of blindness, based on 2015 prevalence estimates published by the Vision Loss Expert Group.1
Annual ophthalmologist population growth trends disaggregated by income group.
The relationship between annual ophthalmologist population growth trends and GDP per capita, based on World Bank data.12
The relationship between the number of years of training and the prevalence rate of blindness.1
The number of ophthalmologists performing cataract surgery disaggregated by income groups.
The relationship between the number of ophthalmologists performing cataract surgery and the prevalence of blindness.
The relationship between the number of ophthalmologists performing cataract surgery and GDP per capita.
The number of ophthalmologists performing refraction disaggregated by income group.
The relationship between the number of ophthalmologists performing refraction and GDP per capita.
The relationship between the number of ophthalmologists performing refraction and the prevalence of moderate and severe visual impairment.
The correlations were analysed among data related to density and continuous variables (GDP per capita and prevalence rates) using logistic regression in an Excel database. Correlations of R2<0.09 were considered weak.
Results
National societies of 160 countries responded to the survey, providing data that covered 94% of the global population. For the remaining 34 countries, MOHs provided data for 24 countries, and key informants provided data for the last 10 countries. Online supplementary table 1 details country-specific data.
Supplemental material
The estimated global number of ophthalmologists was 232 866 in 2015 (online supplementary table 1). The number of ophthalmologists by country ranged from 0 in some small Pacific Island countries (Cook Islands, Micronesia, Nauru, Niue and Tuvalu) to 36 342 in China. Approximately 17% of the global population in 132 countries have access to less than 5% of the global ophthalmologist population. Two-thirds of the global ophthalmologist population were located in 13 countries (China, USA, India, Japan, Brazil, Russia, Germany, Italy, Egypt, France, Mexico, Spain and Poland).
The global estimated mean for ophthalmologist density was 31.7 per million population (ranging from <1 ophthalmologist per million population to 182). Fourteen countries had <1 ophthalmologist per million population; 31 countries had 1–3; 47 countries had 4–24; 88 countries had 25–99 and 13 countries had >100 ophthalmologists per million population (online supplementary table 1, figure 1).

Global distribution of the ophthalmologist density (the number of ophthalmologists per million) population.
A higher national income was associated with a higher ophthalmologist density, ranging from a mean 3.7 per million population in LICs to a mean 76.2 in HICs, an 18-fold difference. There was a low correlation between the number of ophthalmologists per million population and GDP per capita (online supplementary figure 1). The lowest mean number of ophthalmologists per million population was observed in Sub-Saharan Africa (2.5 per million population) and was particularly critical for Portuguese-speaking countries (mean 1.2 ophthalmologists per million population) compared with English-speaking and French-speaking countries (means 2.8 and 2.2 ophthalmologists per million population, respectively). In addition, the data showed that within each income group, the ophthalmologist density varied dramatically. In LICs, the ophthalmologist density ranged from 0.4 in Somalia and South Sudan to 49 in North Korea; in LMICs, density ranged from 0 in Tuvalu and Micronesia to 99 in Armenia. In UMICs, the ophthalmologist density ranged from 0 in the low-population countries of Cook Islands, Nauru and Niue to 165 in Cuba. In HICs, it ranged from 14 in the United Arab Emirates to 183 in Greece.
Supplemental material
The prevalence of blindness was overall lower in countries where the ophthalmologist density was higher (figure 2). However, this correlation was weak.
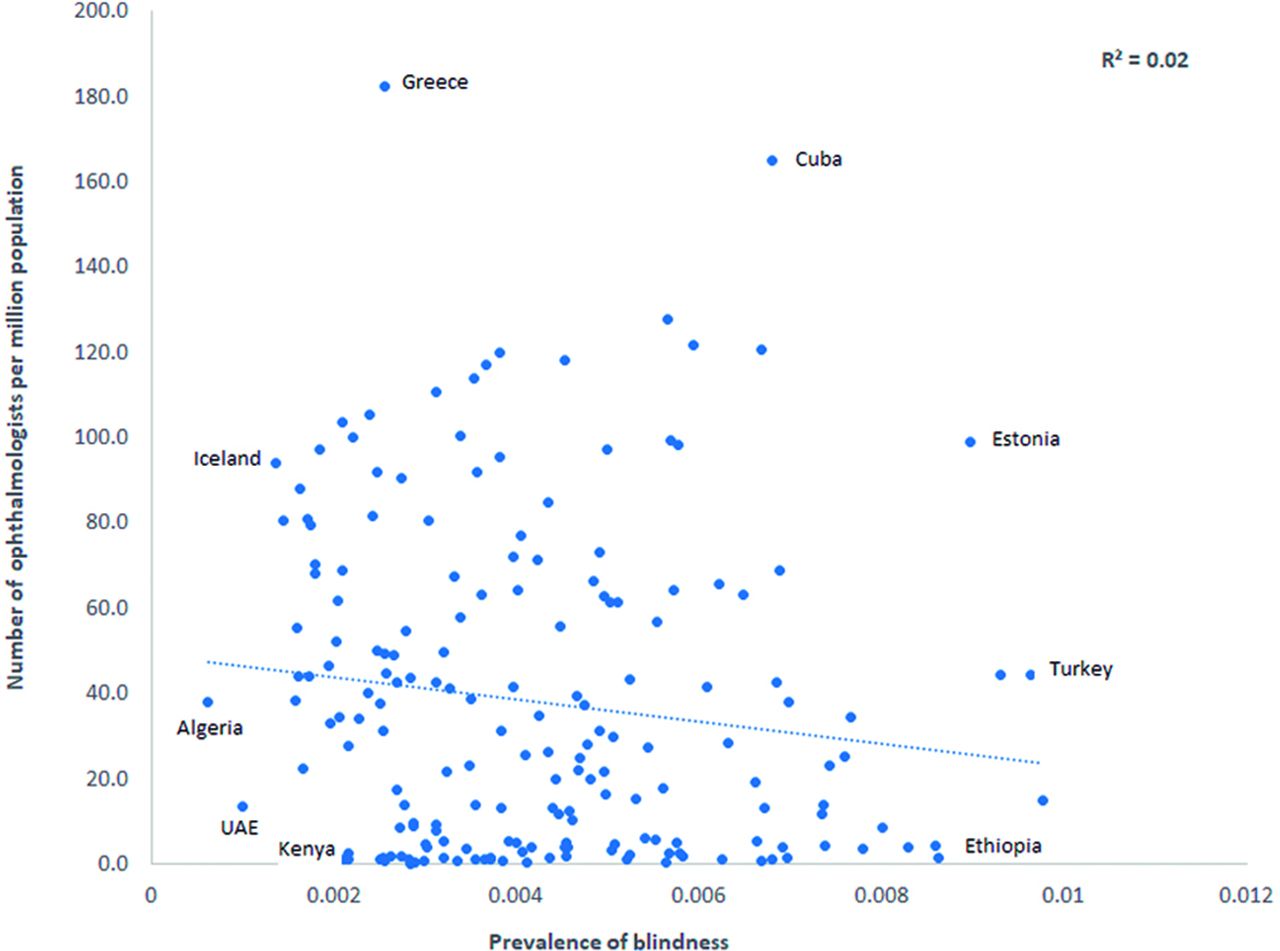
The relationship between the ophthalmologist density (the number of ophthalmologists per million population) and the prevalence of blindness. UAE, the United Arab Emirates.
Data on ophthalmologist population growth were provided from 156 countries, representing 94% of the global population.11 Most countries (n=94; 60.3%) reported growth. The estimated, absolute number of ophthalmologists was decreasing rapidly in 3 countries, decreasing gradually in 10 countries, staying about the same in 49 countries, increasing gradually in 70 countries and increasing rapidly in 24 countries.
The ophthalmologist population was gradually increasing in all income groups. The highest growth was observed in HICs (16% of the countries) and in LICs (12%). LMICs and UMICs had the highest proportion of countries reporting an increasing ophthalmologist population (72% and 67% of those countries, respectively).
Representatives from 114 countries (58.8%) provided data on the number of years of training residents underwent to become ophthalmologists. The global mean number of years of training was 4 years (range 2–8 years), with 4 years being the most frequent length of programme in 41 countries (21.1%). There was a very weak correlation between the number of years of training and the prevalence rate of blindness (online supplementary figure 2).
Supplemental material
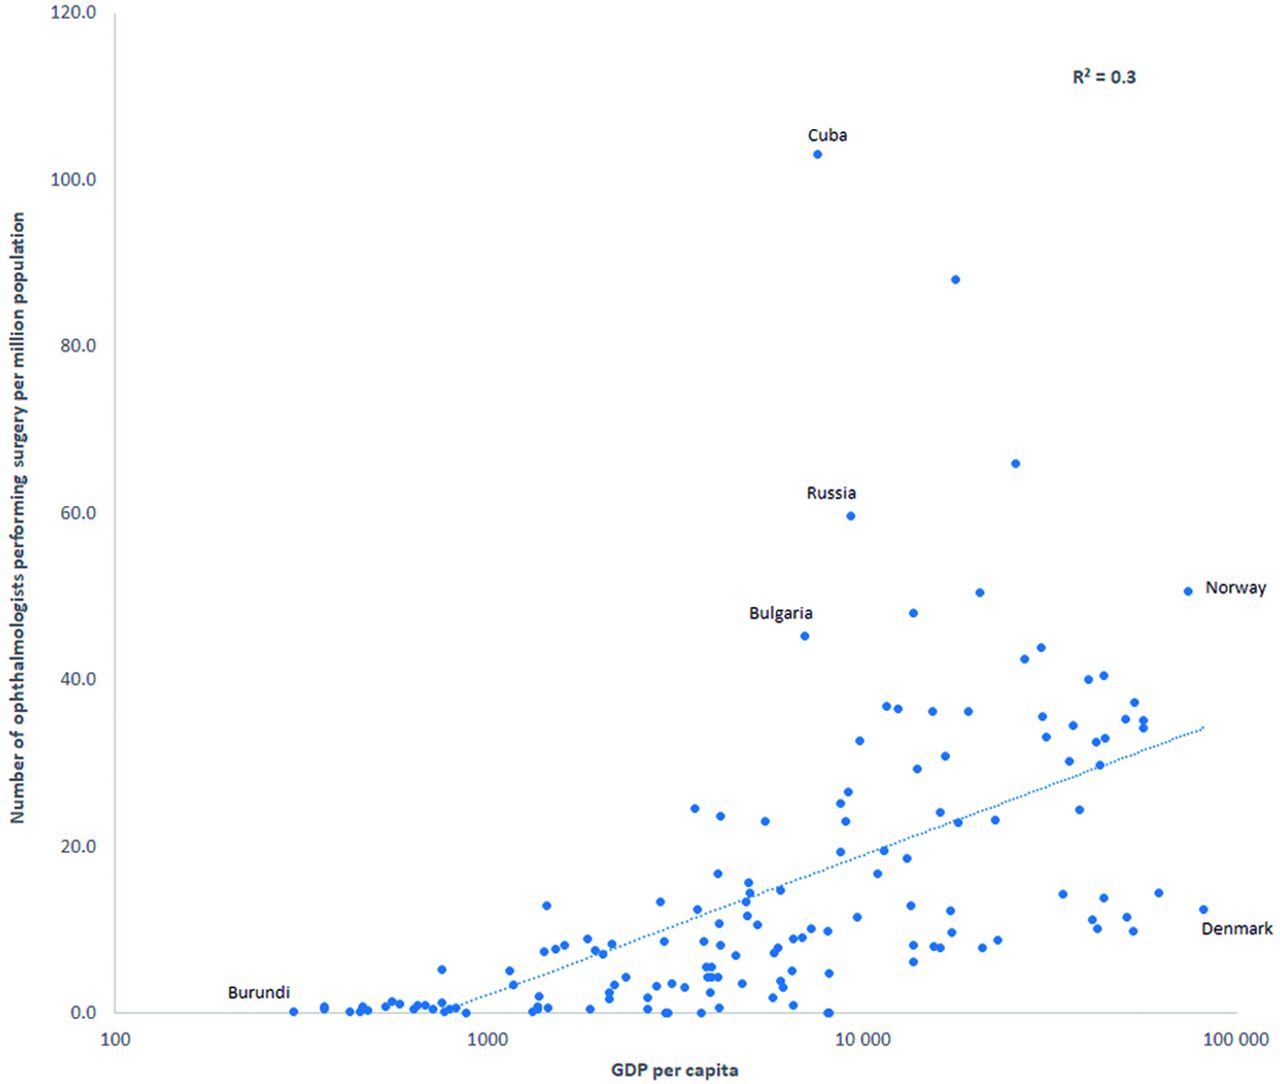
Data on the proportion of ophthalmologists performing cataract surgery were reported from 147 countries, representing 92% of the global population.11 Globally, a mean 14.1 ophthalmologists performed cataract surgery per million population (n=95 601), with a mean 32.2 in HICs; 15.8 in UMICs; 7.4 in LMICs and 0.9 in LICs (online supplementary table 1). The correlation between the number of ophthalmologists performing cataract surgery per million population and GDP per capita was relatively weak (figure 3).

The relationship between the number of ophthalmologists performing cataract surgery per million population and gross domestic product (GDP) per capita.
The density of ophthalmologists performing cataract surgery was very weakly correlated with the prevalence of blindness, which is mainly driven by cataract. There were some countries with a high density of ophthalmologists performing cataract surgery, where the prevalence of blindness was also high. Conversely, there were countries where the density of ophthalmologists performing cataract surgery was low and the prevalence of blindness was also low (figure 4).

The relationship between the number of ophthalmologists performing cataract surgery per million population and the prevalence of blindness.
Across all income groups, there was no correlation or an inverse correlation between the density of ophthalmologists performing cataract surgery and the prevalence of blindness. In Sub-Saharan Africa, a higher density of ophthalmologists performing cataract surgery was associated with a higher prevalence of blindness (online supplementary figure 3).
Supplemental material
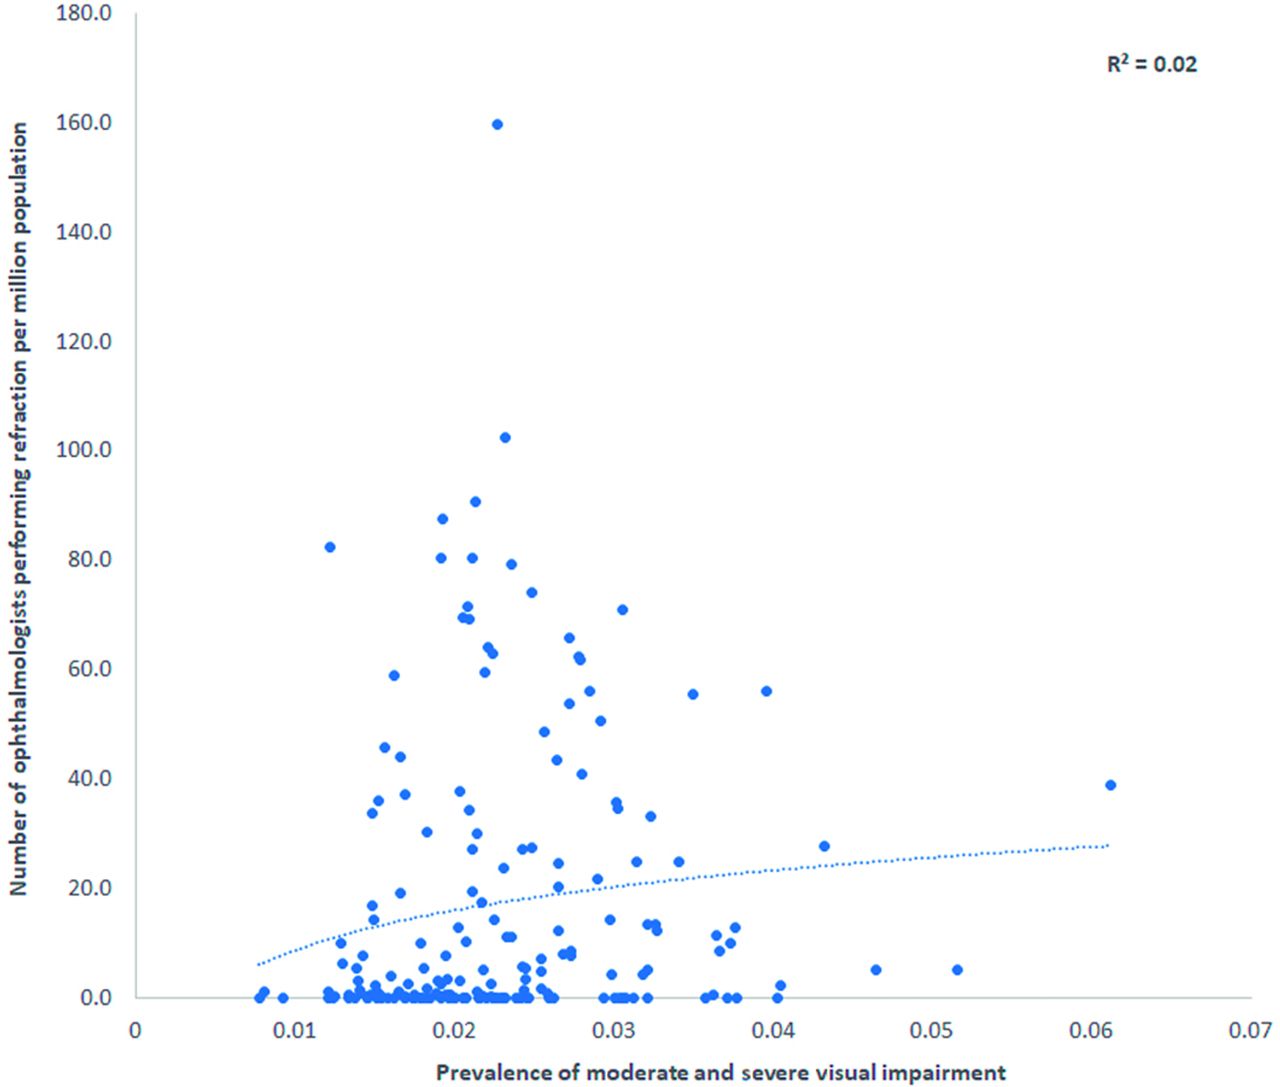
Data on the proportion of ophthalmologists routinely performing refraction per million population were reported from 139 countries, representing 91% of the global population.11 On average, globally, there were 19 ophthalmologists performing refraction per million population. The mean number of ophthalmologists performing refraction per million population was 43 in HICs, 21 in UMICs, 11 in LMICs and 1 in LICs (online supplementary table 1).
The relationship between the number of ophthalmologists performing refraction per million population and GDP per capita was weak, with significant variability across countries. Generally, the lower the GDP per capita of the country, the lower the density of ophthalmologists doing refraction. A high GDP per capita, however, was not necessarily associated with a higher density of ophthalmologists performing refraction.
Data also demonstrated that a high density of ophthalmologists performing refraction was not associated with a low prevalence of moderate and severe visual impairment, which is mainly driven by uncorrected refractive errors (figure 5).

The relationship between the number of ophthalmologists performing refraction per million population and the prevalence of moderate and severe visual impairment.
Discussion
On the basis of our survey, the global ophthalmologist cadre has increased 14% since 2010 and appears to be growing at a faster rate of approximately 2.6% each year (compared with the 1.2% growth estimate in 2010),3 but this workforce rate remains behind the annual, global ageing population growth rate of 2.9%.11 Furthermore, in 12% of LICs, which have the lowest ophthalmologist density and highest population growth rates, our data suggest that the number of ophthalmologists is, unfortunately, decreasing (online supplementary table 1). A substantive gap remains in the estimated ophthalmologist workforce in LICs versus the estimated workforce in HICs.
The weak correlation between the ophthalmologist density and the prevalence of blindness was surprising, because it has been generally understood that higher density was critical to coverage. This indicator monitors service capacity and access to universal eye health coverage and is essential to human resources in eye health planning.2 13 This weak correlation resulted from all possible combinations existing. For example, there were countries with a low ophthalmologist density that had a low prevalence of blindness, as well as countries with a high ophthalmologist density and a high prevalence of blindness (figure 2). The population age structure is likely an additional factor influencing the relationship between the ophthalmologist density and the prevalence of blindness. Some countries have a surge in younger populations (<40 years),11 whose eye care needs will be different than a predominantly ageing population. Thus, ophthalmologist density alone is not a good indicator, because it does not inform on whether appropriate service and coverage are provided at a national level to meet population-based needs.
The weak correlations between the prevalence rates and the number of ophthalmologists performing cataract surgery and refraction are probably due to the fact that the national-level density does not reflect the in-country distribution of ophthalmologists, who are typically concentrated in urban areas.7 9 Ophthalmologists who provide preventive surgery to more affluent patients in urban areas bear little impact on the national prevalence of blindness rate. It is also important to stress that ophthalmologists are not only working as cataract surgeons and/or refractionists. They also manage many patients with chronic conditions, such as diabetic retinopathy, glaucoma and age-related macular degeneration. The weak correlations in this study stress that target ratios of ophthalmologist density at a national level are not useful, because they mask inequalities in distribution and do not reflect their scope of work or quality of care. Increasing the number of ophthalmologists is not going to be enough to meet the global populations’ needs. Neither this indicator, nor the number of years of training and nor the general definition of ophthalmologists used in this study inform on their competencies and skillset,2 10 which vary dramatically among and within countries.
While it has long been known that not all ophthalmologists perform cataract surgery, the estimated global mean number of ophthalmologists performing refraction per million population was considerably less than the estimated global mean density of ophthalmologists (19 per million vs 31.7) (online supplementary table 1). Traditionally, all ophthalmologists performed refraction as part of the comprehensive eye exam, but this is now changing, with task-shifting to optometrists, ophthalmic technicians/technologists and nurses in some countries.9 Focusing on the appropriate distribution of the eye care workforce and developing comprehensive eye care delivery systems may be a way to address population needs. The WHO defines comprehensive eye care as the provision of a continuum of health promotion, prevention, treatment and rehabilitation services that address the full spectrum of eye conditions to meet the patient’s needs throughout their life course, while ensuring an integrated service delivery approach within and beyond the health sector.14 The comprehensive eye care team, comprised of ophthalmologists, optometrists and allied ophthalmic personnel, is essential to delivering comprehensive eye care.2 9 15 16
The International Agency for the Prevention of Blindness Vision Atlas publishes the WHO eye health indicators data online17; as of October 2018, 221 216 ophthalmologists from 190 countries were reported. However, the reporting years varied tremendously from 2010 to 2017, and 49.4% of the data was from the ICO online database, which is primarily based on the 2010 data set, but includes data from some countries through 2014.3 18 Thus, we believe that the updated ICO data reported herein are the more complete data set. The ICO will update the online database with the 2015 data and allow for the national societies of ophthalmology to continue to periodically report their updated data.
There are many limitations to this study beyond what have already been mentioned. The survey design and the use of only one data source per country are important limitations, but we followed the WHO guidelines for collecting indicator data.2 Estimates of ophthalmologists’ growth are difficult to verify, but for 2020 data collection, we will collect data from at least two sources per country for validation purposes.
Although representatives from all 194 countries responded to the survey, only 82.5% of them (representing 94% of the global population) responded to every question. However, the 2015 data are probably more reliable than the 2010 data. For example, the response rate for ophthalmologists performing cataract surgery was much higher in 2015 than in 2010 (75.8% vs 34.5%). Given the lower response rate, the data on the number of years of training are not as reliable as the other 2015 data and are not representative of the whole world.
Another important limitation was that the multivariate analysis was not performed, so the correlation findings are limited by the possibility of confounding. Furthermore, the relationships analysed between the prevalence rate and the survey data are limited by the large CIs that many prevalence rates have. We did not collect data on cataract surgical volume, or the age structure of the patients operated on, so our interpretation of the data related to the number of ophthalmologists performing cataract surgery, in addition to the relationship associated with the prevalence of blindness, is limited. We also do not know if the ophthalmologists were working full-time or part-time, whether they worked in multiple places and/or provided outreach to remote areas, or the capacity of their work environment (ie, access to appropriate equipment and consumables). The lack of reliable global data on the number and distribution of optometrists and other allied ophthalmic personnel prevents us from fully interpreting the significance and impact of the ophthalmologist density.17 These cadres are responsible for performing a large proportion of refraction and other eye care services in many countries. Finally, we did not consider alternative models of refraction that may utilise technology.
The estimated global ophthalmologist workforce appears to be growing annually by 2%–3%, although historical comparisons cannot be precise. Importantly, the prevalence of blindness at a national level is not related to the ophthalmologist density. Thus, these data alone do not indicate access to or quality of eye care, and eye care services cannot be measured by a single number, for example, of ophthalmologists. Although training more ophthalmologists is important, our findings suggest that other regional factors may also play a significant role. A focus on the appropriate distribution of ophthalmologists may ensure equity of services, in terms of equal access to care and coverage for vulnerable populations, so that eye care needs are universally met.
Footnotes
Contributors All the authors contributed to the study concept/design, data collection, analysis and writing of this manuscript, and approved it for submission.
Funding The authors have not declared a specific grant for this research from any funding agency in the public, commercial or not-for-profit sectors.
Competing interests KE was a paid consultant of VCL to this study.
Patient consent for publication Not required.
Ethics approval The study was approved by the Instituto Mexicano de Oftalmología Ethics Committee (Queretaro, Mexico).
Provenance and peer review Not commissioned; externally peer reviewed.
Data availability statement Data are available on request.
Linked Articles
- At a glance