Article Text

Abstract
Purpose To develop age-specific and gender-specific reference percentile charts for axial length (AL) and AL/corneal radius of curvature (AL/CR) and, to use percentiles to determine probability of myopia and estimate refractive error (RE).
Methods Analysis of AL, cycloplegic RE and CR of 14 127 Chinese participants aged 4–18 years from 3 studies. AL and AL/CR percentiles estimated using Lambda-Mu-Sigma method and compared for agreement using intraclass correlation (ICC). Logistic regression was used to model risk of myopia based on age, gender, AL and AL/CR percentiles. Accuracy of AL progression and RE estimated using percentiles was validated using an independent sample of 5742 eyes of children aged 7–10 years.
Results Age-specific and gender-specific AL and AL/CR (3rd, 5th, 10th, 25th, 50th, 75th, 90th and 95th) percentiles are presented. Concordance between AL and AL/CR percentiles improved with age (0.13 at 4 years to >0.75 from 13 years) and a year-to-year change was observed for all except <10th percentile from 15 years. Increasing age, AL and AL/CR was associated with a more myopic RE (r2=0.45,0.70 and 0.83, respectively). The sensitivity and specificity of the model to estimate probability of myopia was 86.0% and 84.5%, respectively. Estimation of 1-year change in AL using percentiles correlated highly with actual AL (ICC=0.98). Concordance of estimated to actual RE was high (ICC=0.80) and within ±0.50D and ±1.0D of actual RE for 47.4% and 78.9% of eyes, respectively.
Conclusion Age-specific and gender-specific AL and AL/CR percentiles provide reference data, aid in identifying and monitoring individuals at risk of myopia and have utility in screening for myopia. AL/CR percentiles were more accurate in estimating probability of myopia in younger children.
- epidemiology
- optics and refraction
- public health
- embryology and development
- diagnostic tests/investigation
Data availability statement
Data are available on reasonable request. The data that support the findings of this study are available from Prof Xun Xu drxuxun@sjtu.edu.cn but restrictions apply to the availability of these data, which were used under licence for the current study, and so are not publicly available.
This is an open access article distributed in accordance with the Creative Commons Attribution Non Commercial (CC BY-NC 4.0) license, which permits others to distribute, remix, adapt, build upon this work non-commercially, and license their derivative works on different terms, provided the original work is properly cited, appropriate credit is given, any changes made indicated, and the use is non-commercial. See: http://creativecommons.org/licenses/by-nc/4.0/.
Statistics from Altmetric.com
- epidemiology
- optics and refraction
- public health
- embryology and development
- diagnostic tests/investigation
Introduction
Myopia or short-sightedness is the most common cause of distance vision impairment and is estimated to affect nearly half of the world’s population by the year 2050.1 The presence of any myopia indicates that the eye length has extended beyond ‘the eye length resulting in emmetropia’ causing a mismatch between the optical components of the eye, such as the cornea and the eye length and therefore, resulting in blurred distance vision. Although vision is easily restored with corrective strategies such as spectacles or contact lenses, the axial elongation often continues well into teenage years and in few, into adulthood leading to further progression of myopia. Any level of myopia imposes an economic and health burden,2 and importantly, progression to higher levels may lead to uncorrectable vision impairment as well as sight-threatening complications such as myopic macular degeneration.3 4 Although myopia is detected commonly in school-aged children, evidence indicates that myopia is linked to education.5 For example, an early onset of myopia is observed in regions where schooling commences early,6 7 and is also detected in high school and university graduates coinciding with periods of academic demand.8 9 An early onset of myopia is likely to result in more number of years in the progression mode and therefore resulting in a higher net myopia.10
Although, there are several risk factors associated with myopia such as age, parental myopia, education, urban living environment with reduced time outdoors, etc,5 11 the aforementioned risk factors alone have not been sufficient to accurately determine the risk of onset and progression. A refractive error assessment is commonly used to categorise an eye as myopic and monitor progression, and a low hyperopic refractive error in young children is considered predictive of future myopia.12 However, when the refractive error assessment does not involve cycloplegia, errors due to overaccommodation are common.13 Also, the accuracy and repeatability of refractive error measurements including subjective refraction are within ±0.50D.14–16 In this regard, modern technology for axial length (AL) measurements using partial coherence interferometry and swept-source techniques is more accurate; measurement errors and variability between instruments are limited to few microns.17 18 Additionally, techniques to measure AL are rapid, non-invasive and can be easy for both the practitioner and the young child. Thus, utilising AL measures either alone or in combination with other ocular measurements (eg, corneal curvature) to differentiate normal from excessive ocular growth provides clinicians with a powerful tool to identify at risk children. Indeed, it has been reported that although AL is the main determinant of excessive eye length underlying myopia, AL/corneal radius of curvature (AL/CR) is a more robust measure of the refractive status of the eye; the AL/CR ratio correlates more strongly with the spherical equivalent (SE) refractive error compared with AL alone.19 20 Furthermore, as an increase in myopia is primarily due to axial elongation, estimating and monitoring AL change is advantageous.
Therefore, we sought to develop and validate AL and AL/CR percentile curves from a large data set of measurements obtained from Chinese children. The purpose was to (1) develop percentile charts for AL and AL/CR with consideration to the influence of age and gender and (2) to determine if the percentile charts can be used to determine the probability of myopia and estimate refractive error.
Methods
Patient population
A retrospective analysis of participant data on AL, cycloplegic SE and corneal curvature collected from 14 127 participants aged 4–18 years from baseline data of three individual studies (referred to as development dataset, table 1). Details of the design and methodology of two of the three studies were previously published.13 21 The third study included data from 1817 young adults aged mostly 17–18 years from Shanghai region. To validate the data, the follow-up data (12–24 months) of 5742 children (7–10 years) of 1 of the 3 studies from development dataset was considered (table 1).21
Details of study cohort (development data set)
Data
Prior to enrolment in respective studies, informed consent for each participant was obtained from parent/carer or the participant (in the case of the young adult). The data sets of all studies did not include data of participants with any systemic or ocular pathology, strabismus or amblyopia or those that had used any myopia control treatments.
Each participant from the development dataset had undergone an eye examination that included an objective cycloplegic refraction (two drops of 1% cyclopentolate eye-drops preceded by 0.5% proparacaine eye-drops) with refractive error measured with an autorefractor (KR-8900, Topcon, Tokyo, Japan). Eye length was measured using an IOL Master (V.5.02, Carl Zeiss, Jena, Germany). Only the baseline measurements were considered for the analysis. The corneal curvature data were obtained from the IOL Master and included the radii of curvature of steep and flat meridians.
Similarly, the validation dataset included a cycloplegic refractive error assessment collected using autorefractor (KR-8900, Topcon, Tokyo, Japan) and an AL and corneal curvature measurement using IOL Master (version 5.02, Carl Zeiss, Jena, Germany). Cycloplegia was obtained using two drops of 1% cyclopentolate eye-drops.
Statistical analysis
The development data set was skewed to younger ages and therefore age specific sample weights were used to standardise the sample to the estimated population distribution for ages 4–18 years.22 Data of both eyes were considered. AL/CR ratio was computed as a ratio of the AL (mm) by the average of the radii of curvature of the flat and steep meridians of the cornea (mm). SE was computed as sphere plus half cylinder in dioptres. Myopia was defined as SE ≤−0.50D. The baseline ocular characteristics, that is, AL, corneal curvature, AL/CR and SE of the study population was summarised by age and gender as mean ±SD and with boxplots.
Percentile curves based on age were developed using the LMS (lambda-mu-sigma) method,23 which summarises the changing distribution of ocular parameters across age by estimating three parameters as a function of age. These three parameters are L (lambda, skewness) expressed as a Box-Cox power, M (mu, median) and S (sigma, coefficient of variation). Penalised likelihood was used to curve fit as cubic splines the three parameters as a function of age using non-linear regression. Smoothening was achieved by adjusting the equivalent df. A model that minimised deviance restricting the df to a maximum of 5 was chosen as the final model and the resulting values of L, M and S as a function of age was exported to plot percentile curves. The nth percentile of an ocular parameter such as AL at an age y was then computed as:
My x (1 + (Ly x Sy x Zn) ˆ (1/Ly)
Where Zn is the standard normal variate at the nth percentile with mean of 0 and SD of 1 and Ly, My, and Sy are the parameters at age y.
AL and AL/CR percentiles were compared for agreement at each age group using intraclass correlation (ICC).
AL and AL/CR percentiles along with age and gender were used in a binary logistic model and the model equation was used to predict the individual probability of myopia and therefore myopia prevalence for specific ages and for both genders. Log likelihood and area under ROC (receiver operating characteristic) curve (AUROC) were used to summarise fit and predictability of the model.
Additionally, the weighted study sample was used to develop a model to estimate SE. Non-linear regression that included main effects, interaction and quadratic terms was used to develop the model and included age, gender, AL and AL/CR, a quadratic term of age and the interaction terms of age and gender with AL/CR.(32.5 +(1.1*Age)+(−0.52*AL)+(−7.26*AL/CR)+−0.30*Age*ALCR)+(−0.008*Age2) + (1.2*AL/CR) −3.13 for males and 32.5 + (1.1*Age)+(−0.52*AL)+(−7.26*AL/CR)+(−0.30*Age*AL/CR)+(−0.008*Age2) for females). The SE of the model was used to determine the prediction interval, given as 1.96× SE of the regression estimate.
The percentiles and SE model were validated using the validation data set. For the analysis, the 12-month and 24-month visits of the validation set were considered as baseline and 1-year follow-up visit, respectively. Age-specific and gender-specific AL and AL/CR percentiles were estimated for each participant of the validation data set. These percentiles were then used to predict the AL and AL/CR at the 1-year follow -up visit. The predicted AL and AL/CR were then compared with the actual AL ad AL/CR at the 1-year follow-up visit using ICC and the difference between predicted and actual computed and categorised into groups:±0.15 mm,±0.2 mm etc. The equation of the SE model was applied to the 1-year follow-up of the validation sample using percentile-based predictions of AL and AL/CR to further predict SE for each eye. The difference between the estimated and actual SE was computed and categorised into groups:±0.5D, ±1D, etc. The correlation of estimated and the actual SE was computed with an accuracy level of ≥75% considered acceptable.
Results
Demographic data
The agewise distribution of the 14 127 participants is presented in table 1. The average refractive error was myopic, with a weighted mean average SE of −0.76±2.53D (+9.00 to −13.00D), AL of 23.7±1.4 mm (18.3–30.4 mm), corneal curvature of 7.85±0.25 mm (7.05–9.48 mm) and AL/CR ratio of 3.03±0.17 (2.49–3.88). As expected, with increasing age, there was an increase in AL and a myopic shift in refractive error, whereas the corneal curvature was found to be relatively stable with little variation between ages (table 2, figure 1). The AL/CR values also increased with age. The population was on an average myopic at age 10 and myopia prevalence increased substantially thereafter.
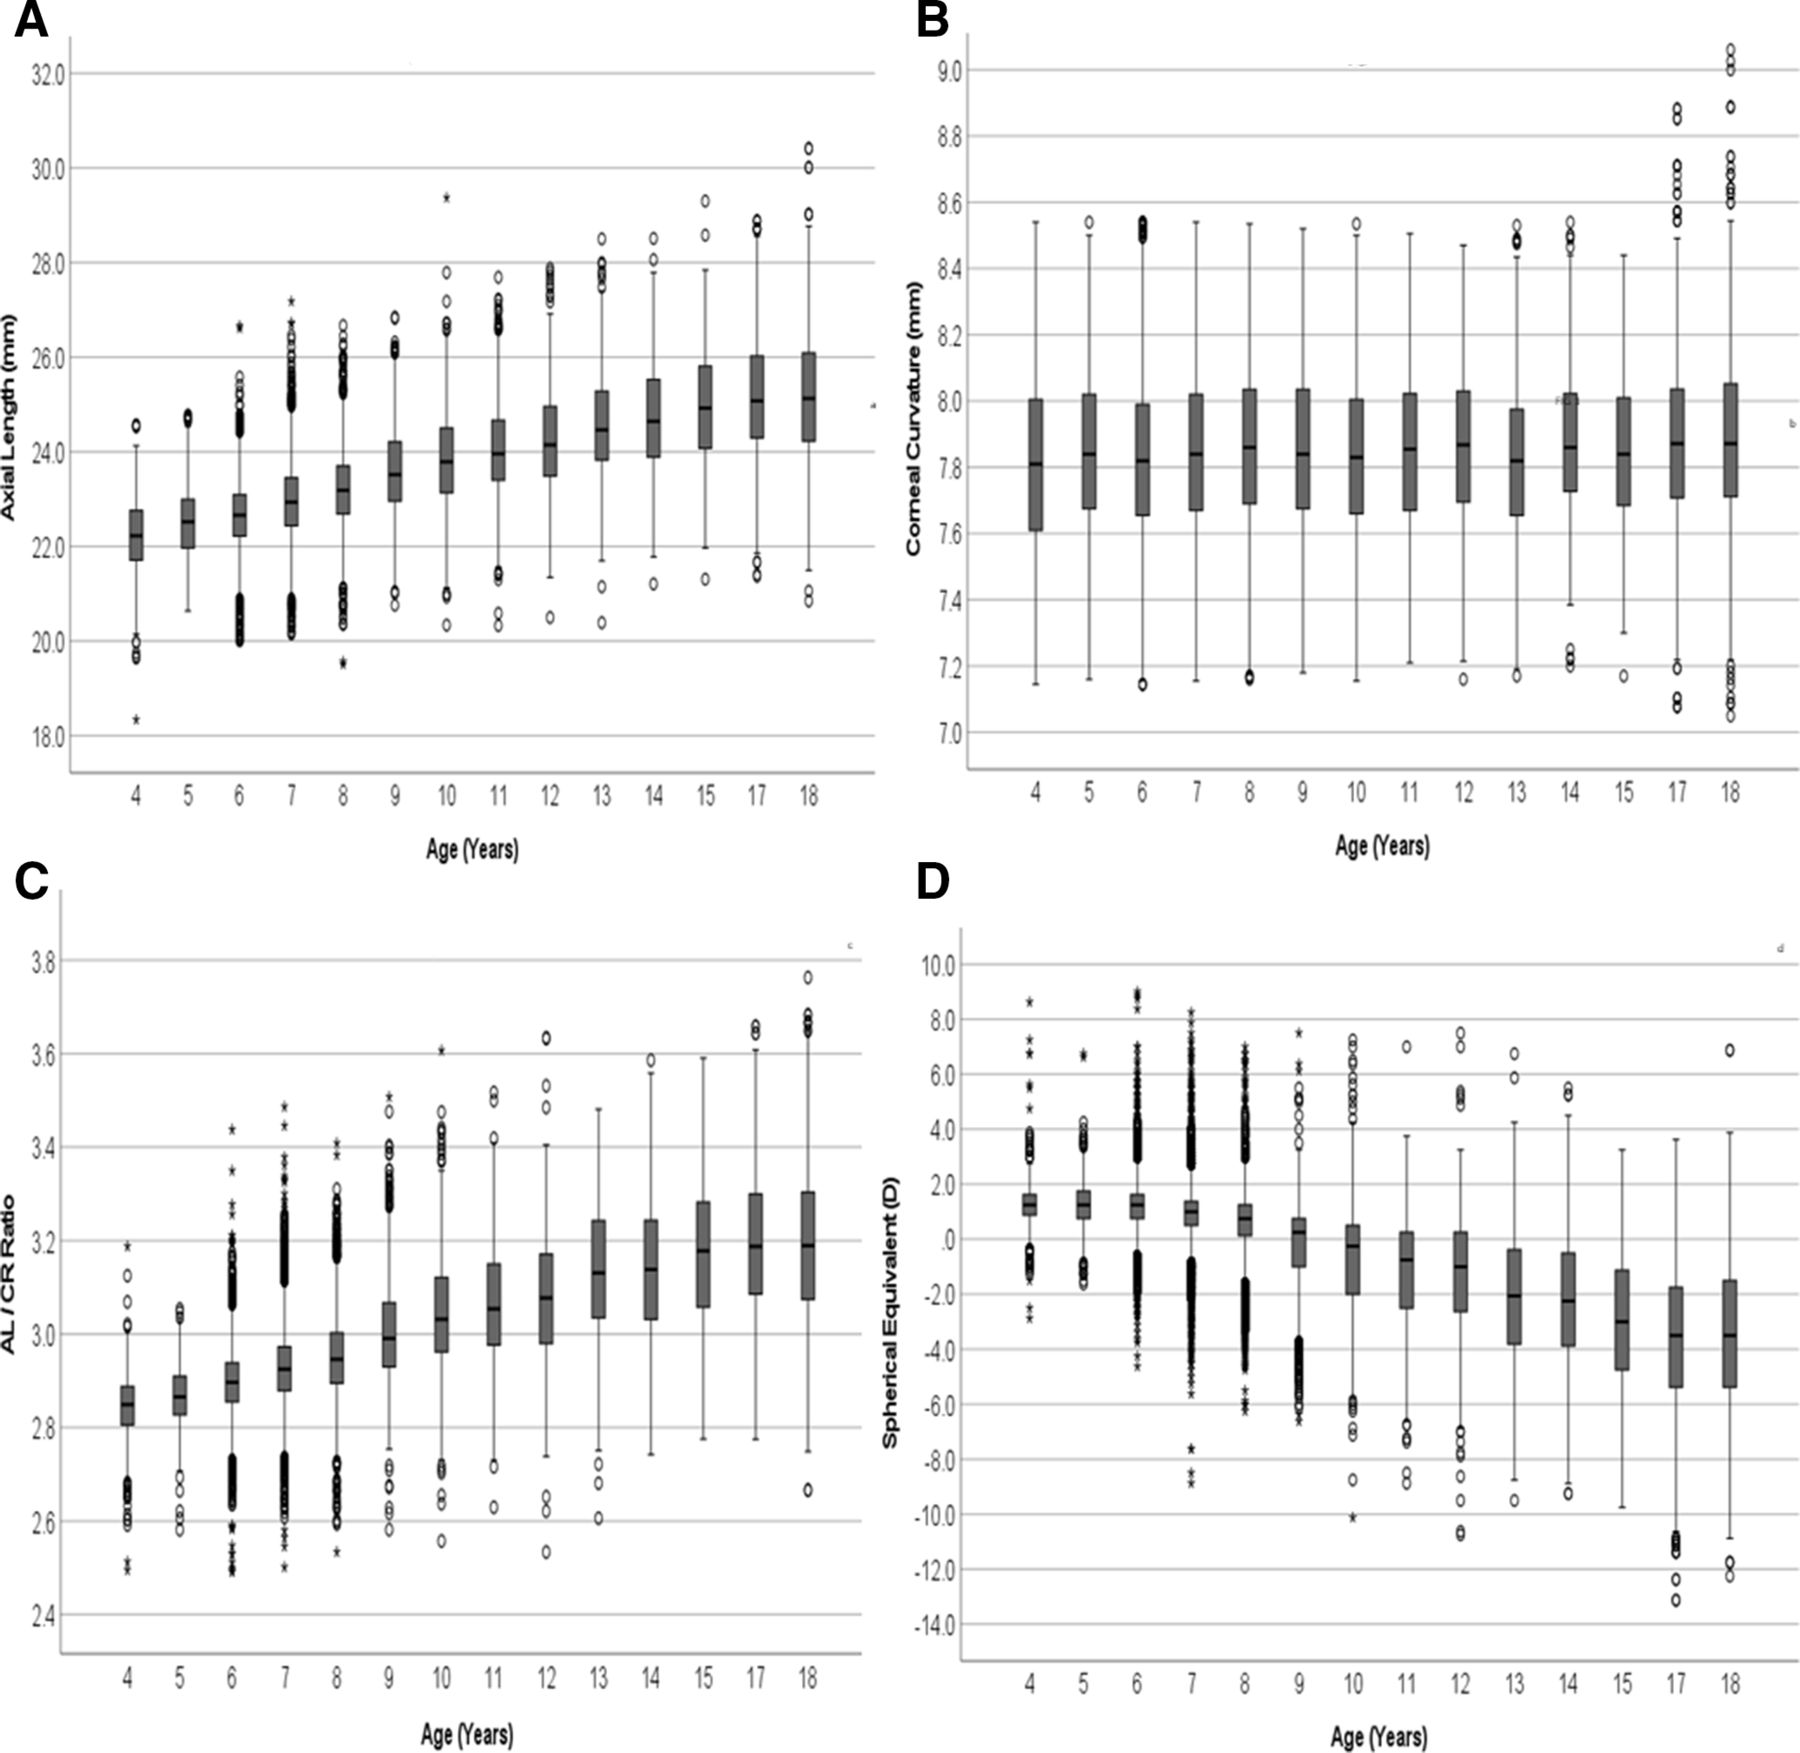
Distribution of ocular parameters by age. (A) axial length, (B) corneal curvature, (C) axial length/corneal curvature and (D) spherical equivalent refractive error. AL, axial length; CR, corneal radius. The "*" used in the box plots refer to outliers as do the "o".
Age gender distribution
There were gender differences (table 3) with females having a shorter AL, a steeper corneal curvature, a slightly lower AL/CR ratio and a more myopic refractive error (p<0.001). Figure 2 presents the weighted mean AL and AL/CR and shows that for a given AL and AL/CR value, females had a more myopic refractive error. For example, in females vs males, at an AL of 24 mms, the SE was −1.47±1.48D vs −0.26±1.24D and for an AL/CR value of 3.0, the mean SE was −0.13±0.97D vs 0.15±0.89D, respectively. As observed from figure 2, the differences were more apparent from the onset of myopia.

Gender-specific weighted means of axial length (AL) (A) and AL/corneal radius (CR) curvature (B) versus cycloplegic spherical equivalent.
Ocular biometry by age and gender
The validation sample comprised 5742 eyes of 5742 participants aged 8.4±0.6 years (7–10 years) a mean SE of 0.54±1.24D (+8.38 to −9.00D) and mean AL of 23.2±0.82 mm (19.97–26.37 mm). The prevalence of myopia in the validation data set was slightly less than the prevalence observed in development data set for similar ages (16% vs 19.7% for validation sample vs development data set respectively, p<0.05).
Percentile curves
Tables 4 and 5 (figure 3) provide AL and AL/CR age and gender specific 3rd, 5th, 10th, 25th, 50th, 75th, 90th and 95th percentiles. Both AL and AL/CR percentiles demonstrate that for a given age, the distribution or spread of AL and AL/CR was narrow at younger ages and increased with age. For example, at 4 years of age, the AL range between the 3rd and 95th percentile was 2.07 mm and 1.92 mm for males and females, respectively, whereas at 18 years of age, the range was 4.82 mm and 4.47 mm for males and females, respectively.

Age-specific and gender-specific percentile curves for axial length (AL) and AL/corneal radius (CR) curvature.
Percentile curves for axial length
Percentile curves for axial length (AL)/corneal radius (CR) curvature
Both AL and AL/CR increased with age across all percentiles; a year-to-year change was observed for all percentiles except for percentiles <10 which plateaued from 15 years of age with little variation thereafter (<0.1 mm for AL and ≤0.01 for AL/CR). The year-to-year change was greater at the higher compared with the lower percentiles; for example, at the 25th percentile, the year-to-year difference in AL at the younger ages was approximately 0.25 mm compared with approximately 0.4 mm at 95th percentile.
The ICC between AL and AL/CR percentiles showed a difference with age; concordance was low at the younger ages (0.13, 4 years; 0.18, 5 years; 0.27, 6 years; 0.35, 7 years) but steadily improved with age to ≥0.70 from 10 years and >0.75 from 13 years (0.77, 13 years; 0.80, 14 years; 0.79, 15 years, 0.78 at 17 and 18 years of age) (figure 4).
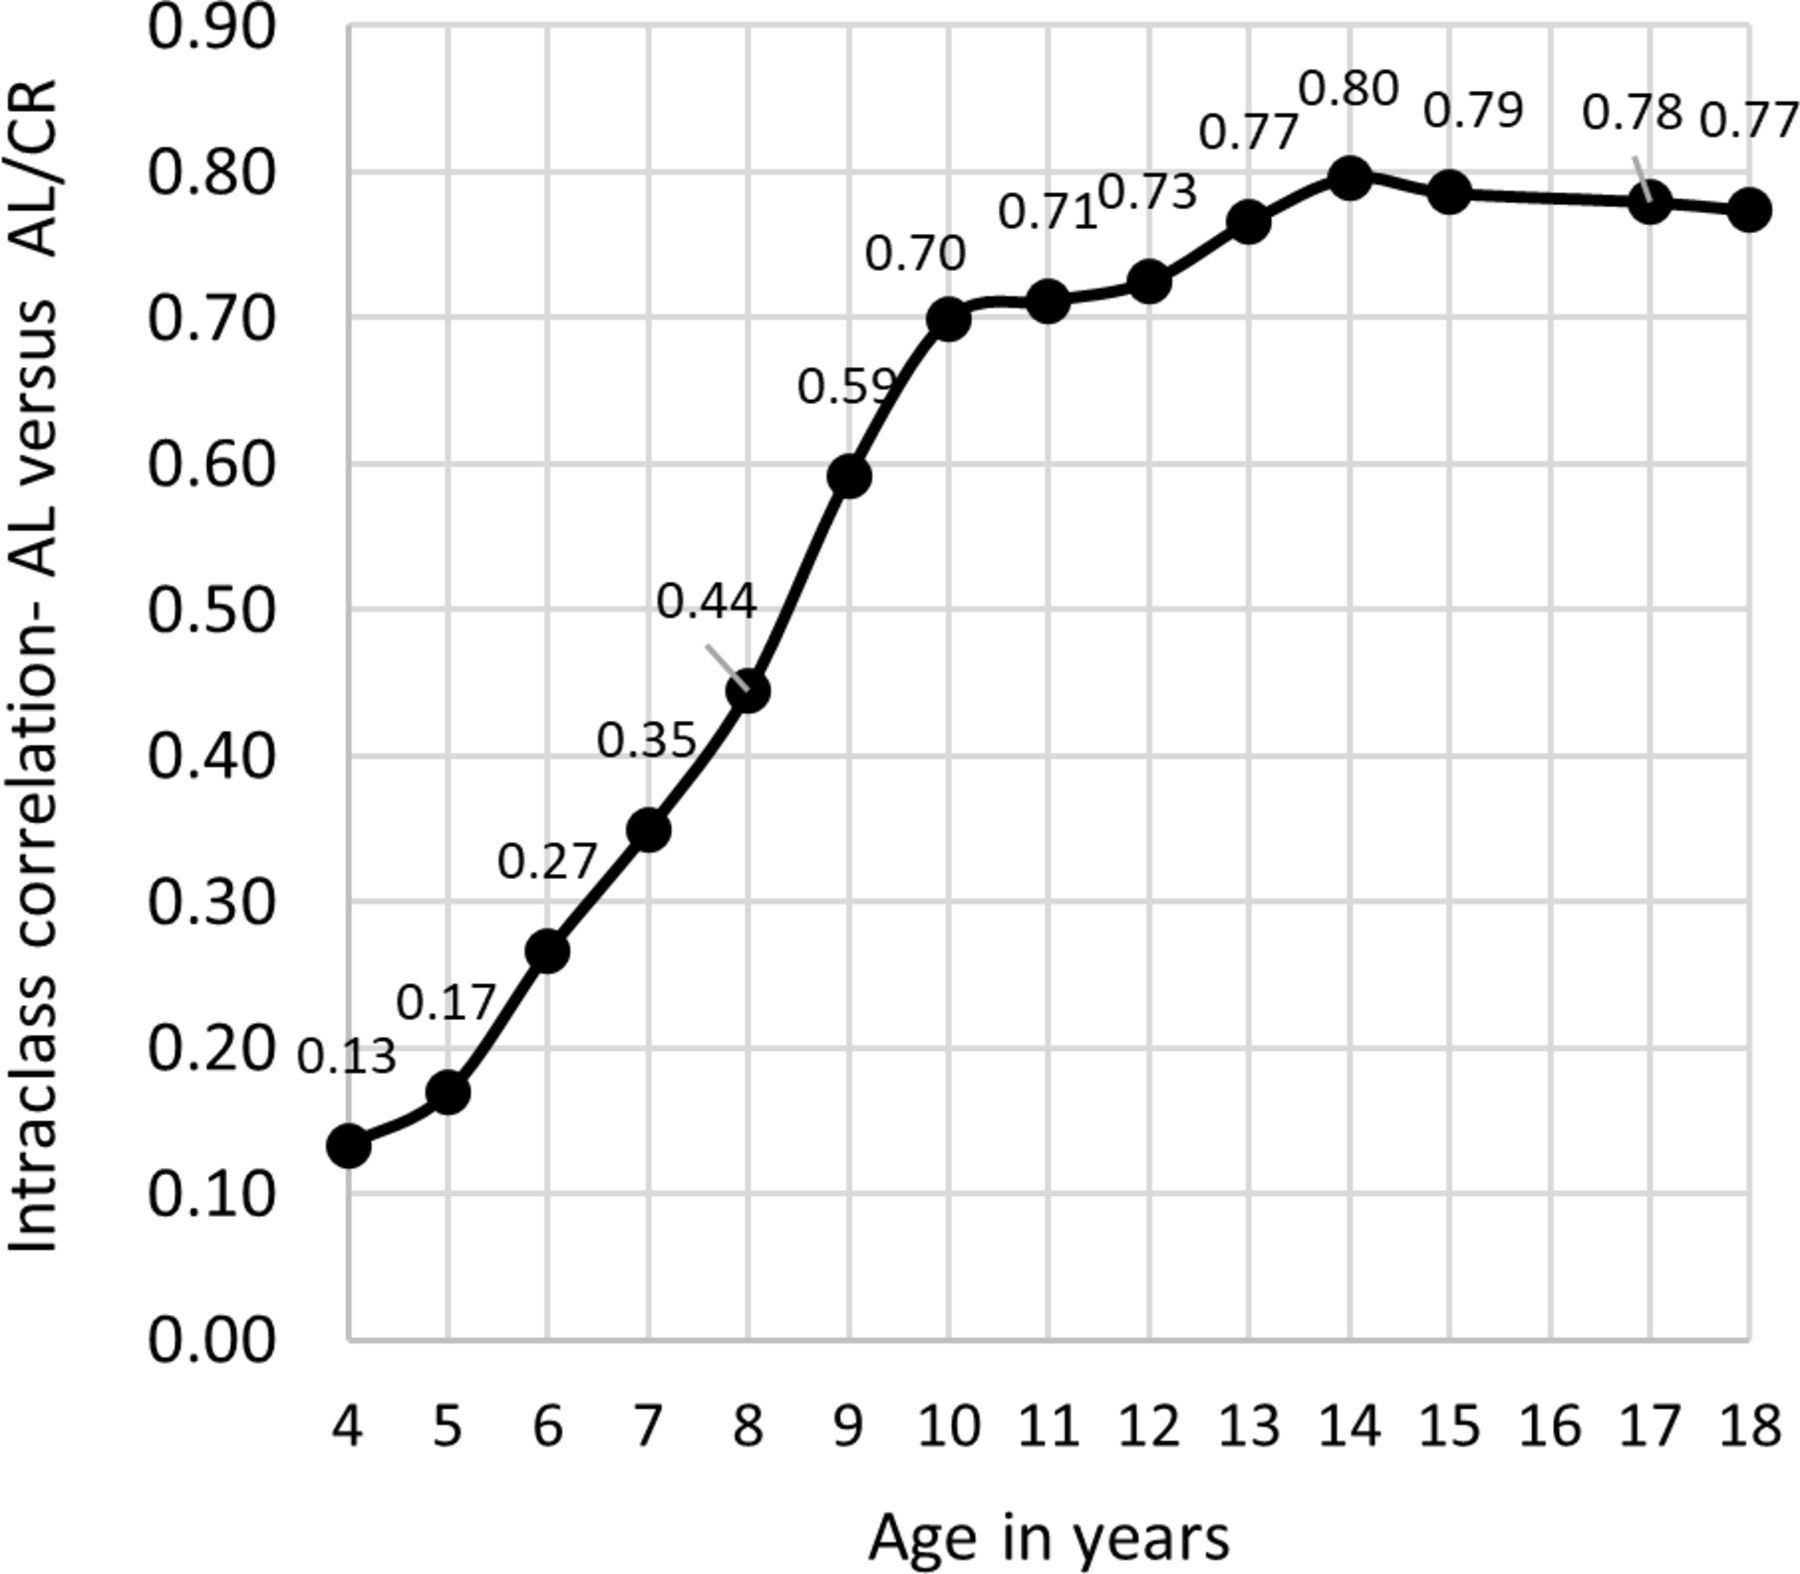
Intraclass correlation for axial length (AL) versus AL/corneal radius (CR) curvature by age.
Age-specific and gender-specific percentiles for AL and AL/CR were computed for each of the participants in the validation data set and used to predict each participant’s AL and AL/CR at the 1-year follow-up visit. Compared with actual AL, predicted AL was within 0.15, 0.20, 0.25 and 0.30 mm for 70%, 79%, 86% and 90% of the eyes, respectively. Similarly, predicted AL/CR was within 0.02, 0.025 and 0.03 of the actual AL/CR for 65%, 73%, and 80% of the eyes, respectively. The ICC for predicted versus actual was 0.98 for AL and 0.96 for AL/CR. The ICC for predicted vs actual was 0.98 for AL and 0.96 for AL/CR.
Using percentiles to estimate probability of myopia and SE
Increasing age, increasing AL and AL/CR was associated with a more myopic refractive error (r2=0.45, 0.70 and 0.83 for age, AL, and AL/CR, respectively). For all ages, logistic model indicated that AL/CR percentiles had a higher diagnostic accuracy for myopia than AL percentiles (AUROC 0.967, 95% CI: 0.965 to 0.969 vs 0.940, 95% CI: 0.937 to 0.943). However, a model that considered both AL and AL/CR showed a statistically significant increase in determining myopia probability (AUROC 0.975, likelihood ratio test p<0.001). In examining the data further, for ages <10 years, a bigger difference was observed between AL/CR and AL models (AUROC 0.937, 95% CI: 0.931 to 0.942 vs 0.869, 95% CI: 0.861 to 0.877) than for ages ≥10 years (AUROC 0.934 95% CI: 0.928 to 0.940 vs0.889, 95% CI: 0.881 to 0.897). The AUROC curve to predict myopia using AL percentiles was significantly lower for ages<10 compared with those ≥10 years (p=0.001) but was not different using ALCR percentiles (p=0.581).
At age 10, the median AL was 23.99 mm and 23.51 mm and AL/CR was 3.03 and 3.02 for males and females, respectively, and the mean SE was low myopia (figure 2); therefore, an increased probability that an eye may be myopic.
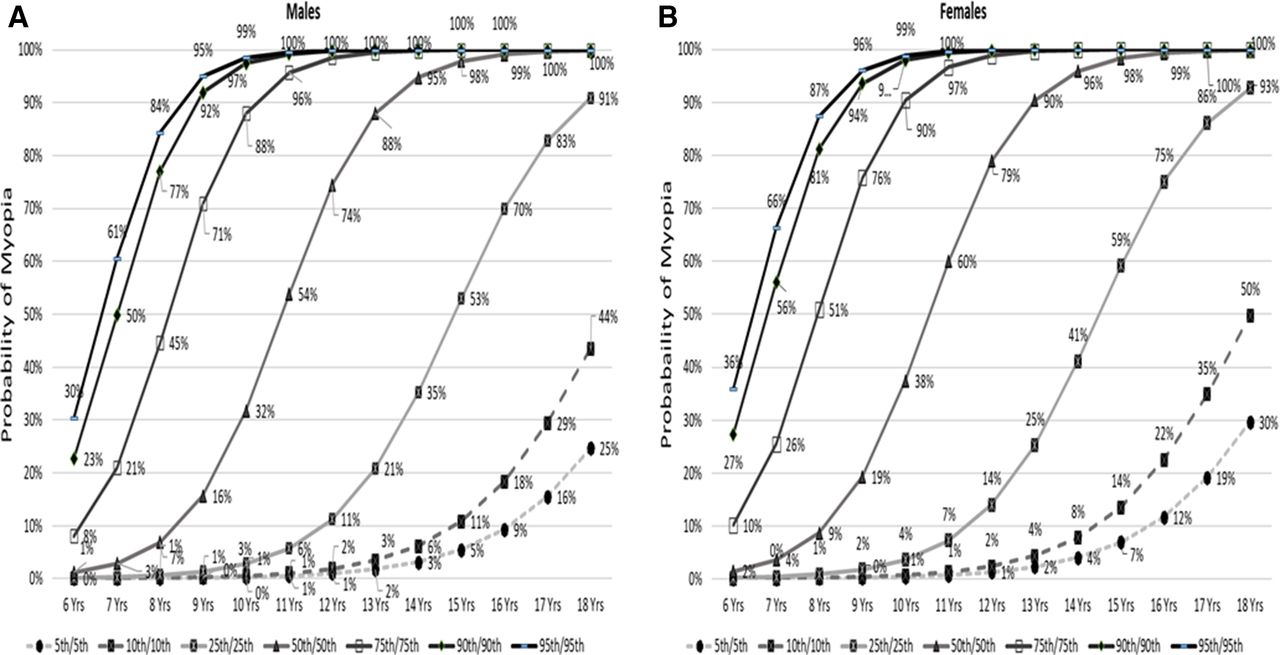
As seen from figure 5, at age 10, at the 50th percentile (both AL and AL/CR) the probability of myopia prevalence was 31.8% and 37.5% whereas at the 75th percentile the prevalence was 88.0% and 90.5% (male and female, respectively). In older children, for example, at age 12, the probability of myopia prevalence was higher even at the 50th percentile (74.5% and 79% for males and females, respectively).
Probability of myopia prevalence by age and both axial length/axial length/corneal curvature percentiles in (A) males and (B) females.
With respect to estimating probability of myopia, the overall sensitivity and specificity of the model was 86% and 84.5%, respectively (sensitivity/specificity was 84.4/38.9 at 4 years; 84.2/95.8 at 5 years, 84.9/92.1 at 8 years, 90.2/82.4 at 11 years, 96.4/86.5 at 14 years and 84.0/86.5 at 18 years, respectively). Specificity was high for all years excepting for 4 years old and considering only those aged 5–18 years, sensitivity and specificity was 87.4% and 88.2%, respectively.
With regard to estimating SE, the R2 of the multivariate model was 0.87 with a SE of the regression estimate of 0.91D, indicating that the 95% CI for any individual estimation of SE would be within ±1.78D. The accuracy of the SE model was estimated using the independent validation sample. The concordance of the estimated to the actual SE values was high (ICC=0.80), with estimated SE within ±0.5D and, ±1D of actual SE for 47% and 79% of the eyes and, within the model’s limit of ±1.78D for 96% of eyes.
Discussion
The results from this cross-sectional data set of AL and AL/CR for Chinese children aged 4–18 years indicate age and gender dependency. Compared with males, females have a shorter AL, a steeper corneal curvature and a slightly more myopic refractive error. The data are strikingly similar to reported data for schoolchildren from Wuhan, China.24 Comparing AL to European and other ethnic counterparts, longer AL was observed in Chinese children at all ages; the difference increased with age.25–29 For example, at 6, 9 and 15 years of age, differences in AL for males from current study to those reported by Tideman et al was 0.32 mm, 0.47 mm and 1.84 mm, respectively. Methodological differences between the studies may account for some of this variation; however, it is more likely to be reflective of varying environmental influences across the different ethnic groups. Education and time outdoors have been identified as two major causal risk factors for myopia.5 In Chinese children from the Shanghai region, myopia prevalence markedly increased from 6 years of age,6 with increased educational workload cited as an important risk factor for the high prevalence.5
Interestingly, for a given AL/CR ratio; female eyes tended to have more myopia than their male counterparts with the difference manifesting especially at the onset of myopia. An AL/CR cut-off criterion of >3.0 still applies for detection of myopia across both genders,19 but at AL/CR values of ≥3.0, the female eye is more myopic. Although the relatively steeper corneas in females result in a more myopic refractive error, the smaller AL would in theory compensate for this myopic shift. Therefore, the more myopic error may be indicative of an AL that has elongated past the length required for emmetropia or other optical components such as the crystalline lens might be playing a role. There are reports of higher crystalline lens power in females.26 27
Previously reported AL percentiles were for children from 6 to 15 years.24 We present both AL and AL/CR percentiles for an extended age range from 4 to 18 years. The ICC between the AL and AL/CR percentile curves was lower at the younger ages and likely reflects the greater contribution from the corneal curvature at these ages; even small changes in curvature result in significant changes in AL/CR. This also indicates that AL length alone may not be sufficient to reliably estimate eye growth and refractive state patterns at young ages.
At younger ages, that is, at 4 years, the range/spread of AL and AL/CR across the population was narrow but progressively expanded with age. Influence of environmental risk factors would be minimal at younger ages; the expanding range of AL and AL/CR may suggest greater influence of environmental risk factors at older ages. Indeed, the high prevalence of myopia in many East Asian countries including China has been linked to an intensive education system with limited time outdoors.30 Furthermore, the rate of change in AL and AL/CR varied between the lower and higher percentiles. The overall changes from 4 to 18 years for males/females at the 25th percentile was 2.51/2.78 mm for AL and 0.29/0.32 for AL/CR whereas at the 95thpercentile, it was 4.41/4.59 mm and 0.58/0.60 for AL and AL/CR, respectively. Probably, the higher percentiles include eyes with greater exposure to environmental risk factors or eyes with syndromic associations, pathological myopia (genetic variant), parental myopia or a combination of factors. From 15 years of age, only <10th percentile plateaued (≤0.1 mm s variation in AL) whereas other percentiles continued to change. Considering other data from China, in a population from Wuhan, AL appeared to stabilise only for those in the first quartile beyond 12 years of age,24 whereas in a cohort from Guangzhou, both SE and AL continued to change from childhood to adulthood, was greater in those with parental myopia and stabilised around adulthood (20 years).31 This indicates that for most of the Chinese children, eye length is increasing even at 17 years of age. In comparison, in European children, change in AL was observed only for percentiles above 50%, was at a much slower pace and the increase in AL from 5 years to adulthood only 1.28 mm/ 2.5 mm for males/females .28 The rate of change in Chinese children from the current study was approximately 2.5× greater and has implications for risk of high myopia.
The percentiles could be used to determine the probability of myopia and therefore screen/identify those at risk of myopia. The probability of myopia increased significantly from age 10 for both genders (AL/CR >3.0; AL >23.5 mm), however, at higher percentiles there was a greater risk of myopia even at younger ages. Using AL, AL/CR and age in the model, myopia probability for 10-year-old males/females at 50th percentile was 31.8/37.5% but increased to >95% for both genders at 15 years of age. The sensitivity/ specificity of the model in estimating myopia probability was 84.5/86.0 (4–18 years) and increased to 87.4/88.2 on excluding 4 years old. Placing these results in context of screening methods employed to detect myopia, the sensitivity/specificity of (1) non-cycloplegic refraction alone and (2) non-cycloplegic refraction with uncorrected VA in detecting myopia in Chinese children aged 6–12 years from Shanghai region was estimated at 85.57/87.4 and 85.1/88.6, respectively,32 and are comparable to the sensitivity/specificity of the current model using AL, AL/CR and age. From a public health perspective, these results hold significance; AL and AL/CR values obtained using modern biometers are rapid, objective, require less time and resources and are less prone to errors compared with VA or non-cycloplegic assessments (eg, VA assessment is prone to variations in the type of charts, examination site); therefore, the method can be utilised for large scale screening in countries with high prevalence.
In the European population, AL percentiles above the median were at >50% risk of myopia in adulthood,28 33 whereas the current data indicates that Chinese children at ≥50th percentiles (for both AL and AL/CR) had a >95% probability of myopia by age 15. A similarly high probability of myopia prevalence (>50% for above median AL percentiles at age 15) was reported for the study from Wuhan.24 The various cut-offs for estimating future myopia risk reinforce the need for ethnicity and region-specific percentiles; more importantly, they indicate the need for closer monitoring and appropriate interventions for those that fall at or exceed the cut-off criteria. Although the percentile charts can be used to estimate myopia probability as well as monitor future changes in AL, the results suggest that it is difficult to estimate the refractive error of an individual eye with accuracy.
The large data set with a wide age range, stratification by gender and utilisation of cycloplegic autorefraction are some of the key strengths of this analysis; however, the non-homogeneity of the sample across specific ages and the lack of data for 16 years old was a limitation. Importantly, the use of percentiles rather than use of absolute values does not allow for comparison between eyes/individuals from different populations or different environments. Other limitations are the cross-sectional data with a single assessment per individual; the lack of longitudinal data is an inherent risk for projections underlying future risk of myopia. Additionally, although the ICC was high, the actual to predicted AL and AL/CR varied and was ±0.3 mm for 90% of the eyes. The reasons for variability are not entirely clear but may be related to measurement variability or the use of cross-sectional data in the development of the percentile curves. Another potential limitation of the AL and AL/CR percentiles derived from urban Chinese children is that they are unable to be used across other groups that are not similar in distribution. The AL of children and their year-to-year growth pattern varies between ethnicities and requires development of percentile curves that are representative of that population. Additionally, even within a given ethnic population, variability in exposure to risk factors (eg, differences between rural vs urban areas) may influence eye growth patterns and thus limit the applicability of the percentiles.30 Finally, these percentiles are only applicable to children on simple corrective strategies for myopia.
In summary, age-specific and sex-specific AL and AL/CR percentile charts are useful for monitoring changes in AL and AL/CR over time and to estimate the probability of myopia. Importantly, myopia probability estimates using AL, AL/CR and age are comparable to screening techniques utilising non cycloplegic refraction and uncorrected VA but have a higher net benefit as the biometry technique is rapid, accurate, objective and less resource intensive.
Data availability statement
Data are available on reasonable request. The data that support the findings of this study are available from Prof Xun Xu drxuxun@sjtu.edu.cn but restrictions apply to the availability of these data, which were used under licence for the current study, and so are not publicly available.
Ethics statements
Patient consent for publication
Acknowledgments
The authors would like to express their sincere gratitude to the various study teams involved in the studies.
References
Footnotes
Contributors XH: conceptualisation, investigation, methodology, validation, analysis, writing, final approval; PS: conceptualisation, investigation, methodology, analysis, validation, writing, final approval; TN: conceptualisation, investigation, methodology, analysis, validation, writing, final approval; JW: investigation, methodology, writing, final approval; SX: investigation, methodology, analysis, writing, final approval; RW: methodology, writing, final approval; LD: investigation, methodology, analysis, writing, final approval; JC: investigation, methodology, analysis, writing, final approval; HZ: conceptualisation, investigation, methodology, resources, writing, final approval; XX: conceptualisation, investigation, methodology, interpretation, writing, final approval.
Funding (A) Excellent Discipline Leader Cultivation Program of Shanghai Three Year Action Plan on Strengthening Public Health System Construction(GWV-10.2-XD09) (B) 3-year Action Program of Public Health (2020-2022) (No.GWV-9.1) (C) National Key R&D Program (No.2019YFC0840607) (D) National Science and Technology Major Project of China (No.2017ZX09304010) and (E) Brien Holden Vision Institute. The studies were supported by Shanghai Eye Disease Prevention and Treatment Center, Shanghai, China. The publication is supported in part by Oculus, Germany.
Disclaimer The funders had no role in the design or conduct of this research.
Competing interests XH: Employee of Shanghai Eye Disease Prevention and Treatment Center (SEDPTC); PS: Employee of Brien Holden Vision Institute (BHVI), TN: Employee of BHVI; JW: None, SX: None; RW: Employee of BHVI; LD: None, JC: None, HZ- None, XX: Employee of SEDPTC. BHVI and Oculus, Wetzlar, Germany have a commercial relation. BHVI and SEDPTC have a collaboration agreement.
Provenance and peer review Not commissioned; externally peer reviewed.
Linked Articles
- Highlights from this issue