Article Text

Abstract
Aim To investigate the association between visual field defects and blood vessel network (BVN) formation in optic disc melanocytomas (ODMs) using optical coherence tomography angiography (OCTA).
Methods Single-centre, retrospective case series of 32 eyes of 32 patients with ODM, in which eyes were divided into two groups based on complete and incomplete BVN formations.
Results OCTA revealed incomplete BVN formation in 16 of 32 ODMs. The location of BVN absence corresponded to the location of hypofluorescence from fluorescein angiography (FA) in 12 (75%) and to the location of visual field defect in 13 (81%) ODMs in the incomplete BVN group. Perimetric indices were significantly worse in the incomplete BVN group than in the complete BVN group. Linear regression of mean deviation (MD) and Visual Field Index (VFI) on the area of BVN absence were statistically significant (p=0.01 and p=0.003, respectively), whereas linear regressions of MD and VFI on the tumour area were not statistically significant (both p=0.09) in the incomplete BVN group.
Conclusion The location of BVN absence within ODMs corresponded to the location of visual field defect and the location of FA hypofluorescence. Visual field defect was more severe in the incomplete BVN group than in the complete BVN group. Visual field defect was more significantly associated with the area of BVN absence than the tumour area.
- imaging
- optic nerve
- retina
Data availability statement
Data are available upon reasonable request. Data are available from the corresponding author upon reasonable request.
This is an open access article distributed in accordance with the Creative Commons Attribution Non Commercial (CC BY-NC 4.0) license, which permits others to distribute, remix, adapt, build upon this work non-commercially, and license their derivative works on different terms, provided the original work is properly cited, appropriate credit is given, any changes made indicated, and the use is non-commercial. See: http://creativecommons.org/licenses/by-nc/4.0/.
Statistics from Altmetric.com
Introduction
Optic disc melanocytoma (ODM) is a benign pigmented tumour of the optic disc. ODM is typically asymptomatic but has a 1%–2% probability of malignant transformation to melanoma.1–3 Subtle tumour growth was reported to occur in 10%–19% over several years after ODM diagnosis, reaching 32% in a 10-year follow-up.2 4 5 Despite its slow growth rate, ODM can lead to deterioration of vision and visual field defects, although the underlying pathological mechanisms remain largely unknown.2 6 As early as 1979, researchers investigated visual field defects in patients with ODM using Goldmann perimetry and fluorescein angiography (FA), and proposed several potential mechanisms of visual field loss in those patients, including pressure atrophy due to compression of nerve fibres, disc compression, axonal loss due to disturbance of retinal microcirculation, central retinal vein obstruction, tumour necrosis, choroidal neovascularisation and malignant transformation.7–12 In those studies, the only way to evaluate the structure of retinal blood vessels was by FA. However, FA has many disadvantages, including its invasive nature and blockage of fluorescence due to dense pigmentation of the tumour.13
Optical coherence tomography angiography (OCTA) is a noninvasive, dyeless, three-dimensional imaging technique that allows investigators to study the vascular structure within ODM with greater detail than what is possible with FA. Previous studies of ODM using OCTA were either case reports or studies with a very small sample size.7 14–16 In this study, we gathered OCTA images from 32 patients with ODM to determine how OCTA findings correlate with visual field defects in patients with ODM. We divided the eyes into two groups based on the degree of blood vessel network (BVN) formation and investigated the difference between ocular findings, association with tumour size and the effect of BVN absence on visual field defects between the two groups. We believe that the results of this study would contribute to the knowledge regarding the pathogenesis of ODMs and may lead to the development of new treatment strategies for patients with ODM with severe visual field defect.
Methods
We performed a retrospective review of medical records and image studies of 32 eyes of 32 patients who were diagnosed with ODM in the Department of Ophthalmology, Yonsei University College of Medicine, between May 2018 and September 2020.
Demographic information (age, gender and presence of systemic medical conditions) and ophthalmological features (visual acuity, intraocular pressure and laterality) were obtained from the patients’ medical records. None of the patients had a history of glaucoma or any other ocular disease in either eyes that could impair visual acuity. Colour fundus images were available for all 32 patients. We reviewed the fundus images, FA images and medical records of tumour-specific features (size, colour, location within the optic disc and associated ocular findings). FA results were not available in five patients. Tumour area was measured manually from the en face plane of optical coherence tomography (OCT) image (Spectralis OCT; Heidelberg Engineering, Heidelberg, Germany) using Heidelberg Eye Explorer software. Tumour thickness was determined as the maximum height of the tumour in OCT. Visual field defects were determined using a Humphrey Field Analyzer (Carl Zeiss Meditec, Dublin, California, USA).
OCTA measurements were obtained by Spectralis OCTA (Heidelberg Engineering) with analysis of each layer on manual segmentation. The retinal layers between the internal limiting membrane and the retinal fibre layer of the tumour were segmented and examined in order to include the tumour tissue (figure 1A).7 The area of BVN absence was defined and measured as the area of avascular region in an en face plane image of the OCTA, which was constructed from all of the OCTA signals in the retinal layer using OCTA using Heidelberg Eye Explorer software (figure 1B). Complete BVN tumour was defined as a tumour without any regions of vascular discontinuity. Incomplete BVN tumour was defined as a tumour with at least one region of vascular discontinuity or absence of vascularity. For correlation of BVN absence area with respect to the location of visual field defect, the location of neuroretinal rim of the optic disc that was compromised by the development of ODM was analysed using fundus photography, infrared image from OCT and OCTA image, and was compared with the respective visual field data. Visual field was classified accordingly: enlarged blind spot only, nasal step, early arcuate-like defect, advanced arcuate-like defect, total, and non-specific scotoma.17 18

(A) Tumour tissues were segmented corresponding to the retinal layers between the internal limiting membrane and the retinal nerve fibre layer as shown in the B-scan of OCTA. (B) Area of blood vessel network absence was determined as the area of avascular region in an en face plane image of the OCTA with Heidelberg Eye Explorer software. OCTA, optical coherence angiography.
We performed all statistical analyses using SPSS software V.22. Fisher’s exact test was used to determine the association between the presence of BVN absence and whether specific ocular finding was present. The median and IQR (25%–75%) of each tumour area were calculated. Mann-Whitney U test was used to evaluate the significance of difference in the tumour area between complete and incomplete BVN groups, as well as the difference in visual field parameters between the two groups. Student’s t-test was used to determine the significance of difference in tumour thickness between complete and incomplete BVN groups. Wilcoxon signed rank test was used to determine the significance of difference in change in area of BVN absence over 1 year. Linear regression models were constructed to evaluate the relationship between area of BVN absence and tumour area, as well as those areas with perimetric indices. P values of <0.05 were considered statistically significant.
Results
Table 1 summarises the clinical profiles of the patients. The median age at diagnosis was 51.5 years (range: 18–65 years). Eighteen (56%) of the patients were female. All cases of ODM were unilateral, with 17 (53%) cases in the right eye and 15 (47%) cases in the left eye. Sixteen patients (50%) had initial visual acuity of 20/20. The rest of the 16 patients (50%) had visual acuity from 20/40 to below 20/20. In each eye with ODM, the tumour appeared as a pigmented mass located on the optic disc. OCTA revealed complete BVN formation in 16 (50%) of the tumours. Regarding the associated ocular findings, optic disc oedema was detected in four (25%) eyes in the complete BVN group and seven (44%) eyes in the incomplete BVN group (p=0.458, Fisher’s exact test). Peripapillary subretinal fluid (SRF) was not detected in the complete BVN group but was detected in three (19%) eyes of the incomplete group (p=0.226, Fisher’s exact test). Exudates were detected in three (19%) eyes in the complete BVN group and five (31%) eyes in the incomplete BVN group (p=0.685, Fisher’s exact test). Neither group showed retinal vein obstruction. Hypofluorescence was observed in 3 (19%) eyes in the complete BVN group and in 12 (75%) eyes in the incomplete BVN group (p=0.004, Fisher’s exact test). Dye leakage on FA was observed in five eyes (31%) in the complete BVN group and in eight eyes (50%) in the incomplete BVN group (p=0.280, Fisher’s exact test). The mean tumour thickness of 32 patients was 1187.75±465.43 µm. The mean tumour thickness between the complete and incomplete BVN groups was significantly different (939.38±376.71 and 1436.13±417.33, p=0.001; Student’s t-test).
Clinical features of 32 patients with optic disc melanocytoma
The combined tumour area among all 32 patients was 3.70 mm2 (IQR 2.19‒6.88). The tumours with complete BVN formation were smaller than those with incomplete BVN formation (2.58 mm2, IQR 1.55‒4.86, and 6.01 mm2, IQR 2.92‒10.11, respectively; p=0.005, Mann-Whitney U test). The linear regression of the area of BVN absence on the tumour area had a slope of 0.36 and an R2 of 0.31 (p=0.02, figure 2).

Linear regression model of the tumour area and the area of BVN absence on optical coherence tomography angiography. The slope and R2 were 0.36 and 0.31, respectively (y=0.36x+0.46, R2=0.31, p=0.02). BVN, blood vessel network.
Three out of 16 eyes (19%) with complete BVN formation showed hypofluorescence throughout the FA examination. Twelve out of 16 eyes (75%) with incomplete BVN formation showed hypofluorescence throughout the FA examination. FA results were missing for three patients who had complete BVN formation and two patients who had incomplete BVN formation. In all of the patients with incomplete BVN formation who showed FA hypofluorescence, the location of hypofluorescence matched the location of BVN absence on OCTA (figure 3A–D). In addition, the location of BVN absence on OCTA corresponded to the location of visual field defect revealed by the perimetry data in 13 of 16 patients (81%) (figure 3E).

Fundus photography, FA, ICGA and OCTA images of one patient with ODM. (A) Fundus photography showing pigmented lesion at superonasal side of the optic disc. (B) OCTA image showing absence of blood vessel network in the superior region of optic disc. (C) FA showing hypofluorescence in the area of ODM. (D) ICGA showing no vessels or leakage in the area of ODM. (E) Visual field data showing inferior visual field defect; the superonasal field defect noted in pattern deviation probability map is attributed to inferotemporal capillary dropout within peripapillary atrophy (arrowheads, B). FA, fluorescein angiography; ICGA, indocyanine green angiography; OCTA, optical coherence tomography angiography; ODM, optic disc melanocytoma.
Table 2 shows visual fields of 32 cases. In the complete BVN group, seven cases (44%) did not show any visual field defect. In this group, the numbers of cases with nasal step, enlarged blind spot, non-specific scotoma and early arcuate-like defect were four (25%), two (13%), two (13%) and one (6%), respectively. In the incomplete BVN group, the most frequent visual field defects were early arcuate-like defect (five cases, 31%) and advanced arcuate-like defect (five cases, 31%), followed by enlarged blind spot only (two cases, 13%), nasal step (two cases, 13%), non-specific scotoma (one case, 6%) and total defect (one case, 6%). There was no case in the incomplete BVN group without any visual field defect.
Visual fields of 32 patients with optic disc melanocytoma
In patients with complete BVN formation, the mean deviation (MD), pattern SD (PSD), and Visual Field Index (VFI) were −2.67 dB (IQR −3.23 to −0.22), 1.79 dB (IQR 1.44‒3.54) and 98.50% (IQR 96.25‒99.75), respectively. The overall MD, PSD and VFI values in the patients with incomplete BVN formation were −5.50 dB (IQR −12.35 to −1.95), 5.06 dB (IQR 2.435‒12.41) and 92.00% (IQR 71.00‒96.00), respectively. The overall MD, PSD and VFI values were significantly different between the patients with complete BVN formation and the patients with incomplete BVN formation (p=0.006, 0.005 and 0.001, respectively; Mann-Whitney U test).
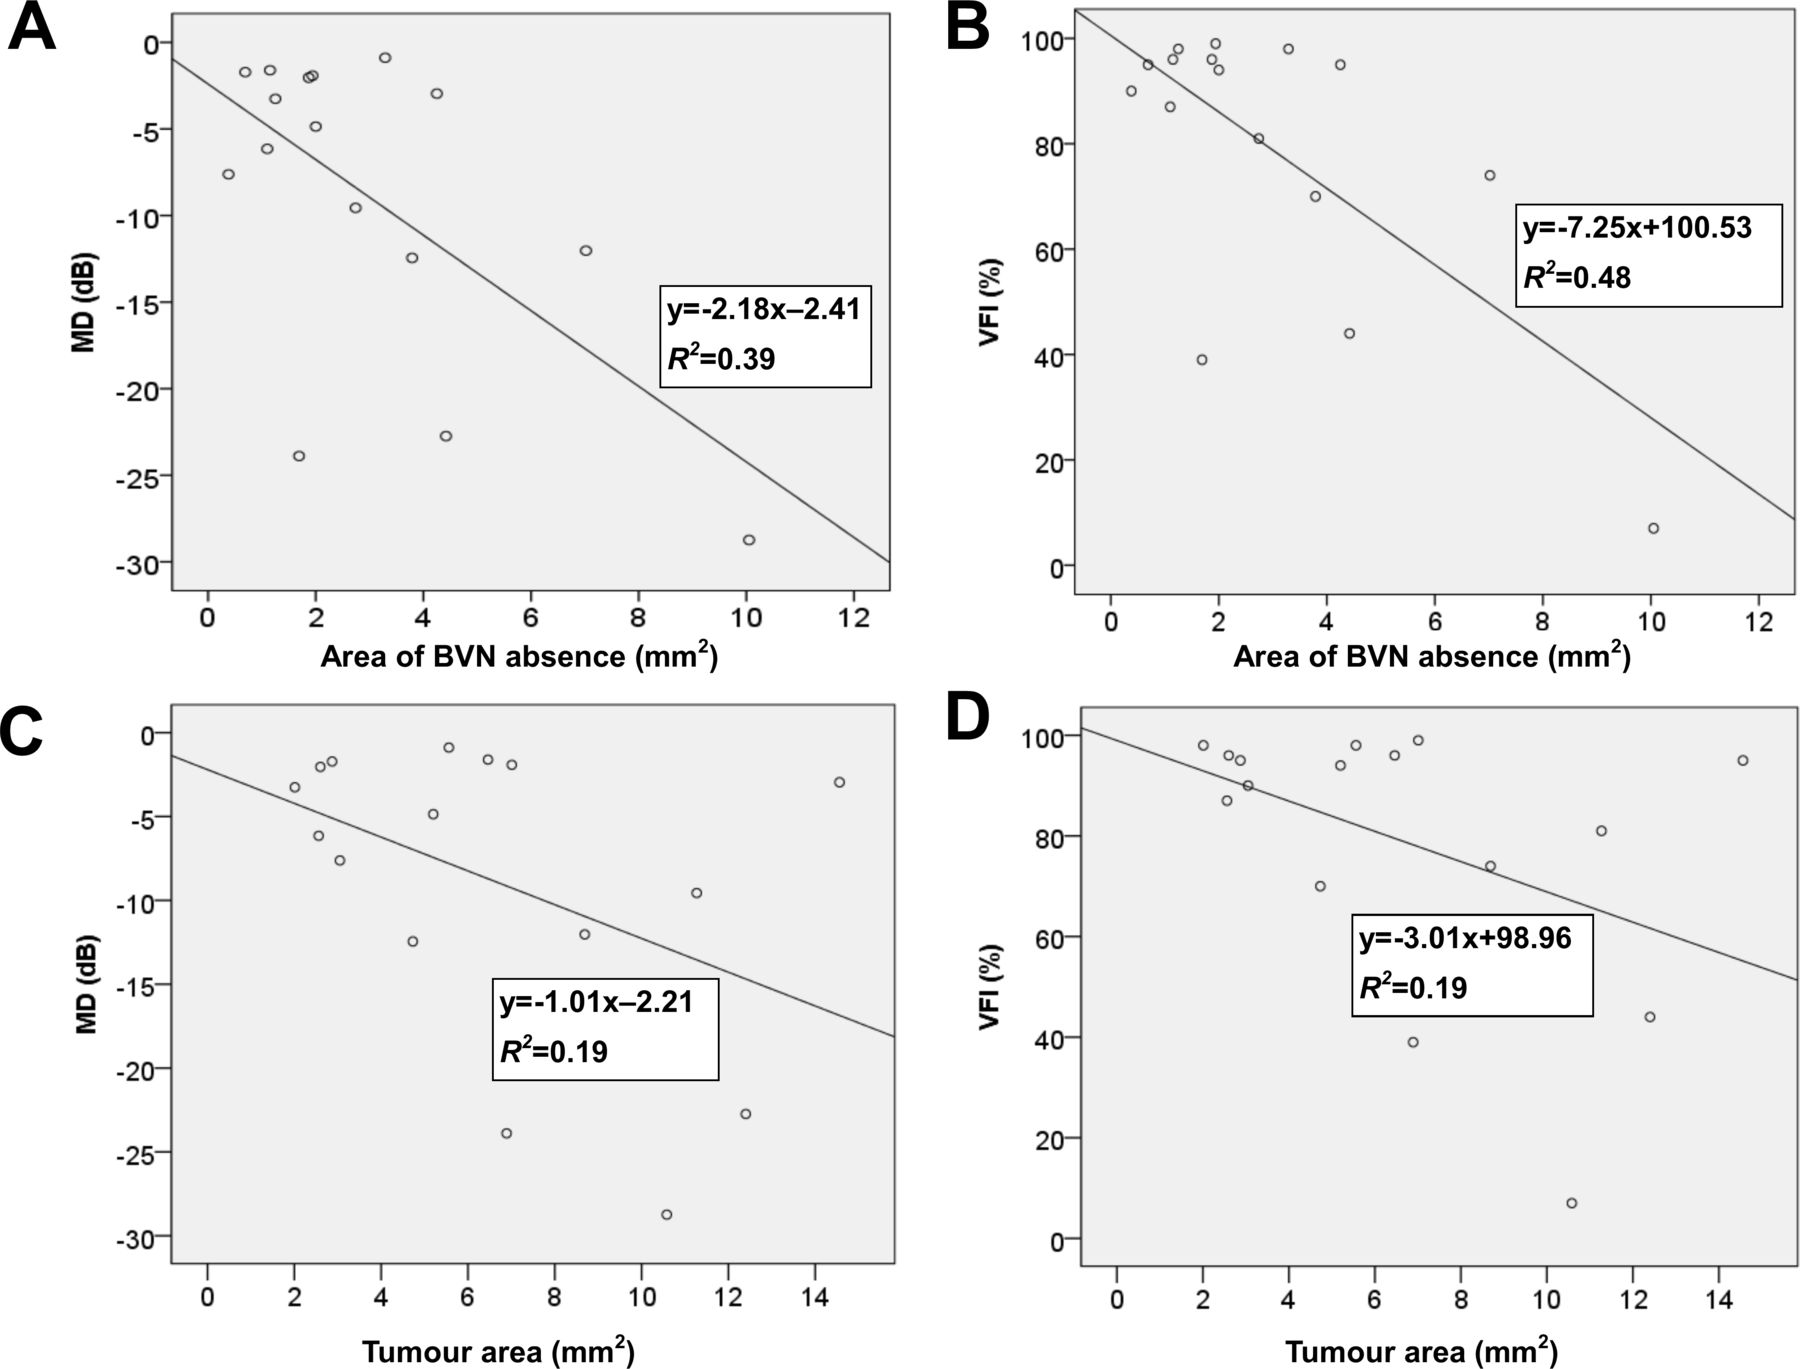
Among the patients with incomplete BVN formation, the linear regression of MD on the area of BVN absence had a slope of −2.18 and an R2 of 0.39 (p=0.01, figure 4A). The linear regression of VFI on the area of BVN absence had a slope of −7.25 and an R2 of 0.48 (p=0.003, figure 4B). Among the patients with incomplete BVN formation, the linear regression models showed non-significant relationships between the tumour area and MD or VFI (p=0.09 for both; figure 4C,D). The linear regression of PSD on the area of BVN absence as well as the tumour area was not significant.

(A) Linear regression model of the area of BVN absence and the MD. The slope and R2 were −2.18 and 0.39, respectively (y=−2.18x−2.41, R2=0.39; p=0.01). (B) Linear regression model of the area of BVN absence and the VFI. The slope and R2 were −7.25 and 0.48, respectively (y=−7.25x+100.53, R2=0.48; p=0.003). (C) Linear regression model of the tumour area and MD in patients with incomplete BVN formation. The slope and R2 were −1.01 and 0.19, respectively (y=−1.01x−2.21, R2=0.19; p=0.09). (D) Linear regression model of the tumour area and VFI in patients with incomplete BVN formation. The slope and R2 were −3.01 and 0.19, respectively (y=−3.01x+98.96, R2=0.19; p=0.09). BVN, blood vessel network; MD, mean deviation; VFI, Visual Field Index.
Discussion
We evaluated how the degree of BVN absence, detected by OCTA, affected the degree of visual field defect in patients with ODM. We used the OCTA results to group the patients with ODM into two groups with complete and incomplete tumour BVN formations, respectively. The incidence of findings such as optic disc oedema, peripapillary SRF, exudates and hypofluorescence in FA was higher in the incomplete BVN group, but it was not significantly different between the two groups except for the incidence of hypofluorescence in FA. Seventy-five per cent of the tumours with incomplete BVN formation showed hypofluorescence on FA at the same location where OCTA indicated that BVN was absent. In contrast, only 19% of tumours with complete BVN formation showed hypofluorescence within the tumour on FA. The tumours with incomplete BVN formation were larger and thicker on average than those with complete BVN. Moreover, linear regression showed a positive relationship between the area of BVN absence and the tumour area.
Classification of visual fields showed that there were statistically different visual field defects between complete and incomplete BVN groups (table 2). In the complete BVN group, 7 cases (44%) did not feature any visual field defect, whereas all 16 cases in the incomplete BVN group had some form of visual field defect (p=0.007, Fisher’s exact test). In the incomplete BVN group, both early arcuate-like and advanced arcuate-like visual field defects were detected in five cases (31%), respectively. Advanced arcuate-like visual field defect was not detected in any of complete BVN cases (p=0.043, Fisher’s exact test), whereas early arcuate-like visual field defect was detected in one complete BVN case (p=0.172, Fisher’s exact test). In sum, there was a general tendency for the incomplete BVN group to present greater visual field defect than the complete BVN group.
A number of studies reported types of visual field defects detected in patients with ODM. One previous study of 20 patients with ODM who underwent Goldmann perimetry showed that 10% had normal visual fields. Abnormal visual fields (90%) included enlarged blind spot only (40%), nasal step (10%), relative nerve fibre bundle defects (20%) and absolute arcuate defect (20%).8 In another study of 10 patients with ODM who underwent Goldmann perimetry, visual fields consisted of normal (10%), enlarged blind spot only (20%) and other forms of visual field defect (70%).9 In our study, visual fields of entire 32 cases consisted of no visual field defect (22%), enlarged blind spot only (13%), nasal step (19%), early arcuate-like defect (19%), advanced arcuate-like defect (16%), non-specific scotoma (9%) and total defect (3%). These data showed that 78%–90% of ODM cases feature some form of visual field defect. In addition, our study showed a similar general pattern of visual field defects with one study.8 However, some disparities may arise from different methods of perimetry (Humphrey vs Goldmann perimetry) as well as difference in the number of cases enrolled.
The location of BVN absence, as shown by OCTA, corresponded to the location of visual field defect in 81% of the patients with incomplete BVN formation. A previous study examined the relationship between severe visual field defects and BVNs in five patients with ODM and reported associations among the area of visual field defect, the position of the tumour and the absence of BVN.7 The authors of that study used laser speckle flowgraphy to show that even a patient with marginal visual field impairment had circulation disorder in the optic disc tissue. Our OCTA data showed that impaired BVN formation was associated with visual field defects in patients with ODM. Due to the low incidence of ODM, many previous ODM studies were either case reports or studies with a small number of cases. We believe this study enrolled the largest number of cases for evaluating ODMs using OCTA. The relatively large dataset in our study made it possible to show that the degree of impairment of intratumoural BVN development was positively associated with the degree of visual field defect. Regarding the location of BVN absence within tumour, our data showed that 6 of 16 cases (38%) showed BVN absence for the entire tumour area, and 4 of 16 cases (25%) showed BVN absence in the centre of the tumour. The rest of the cases (six cases, 38%) showed the heterogeneous location of BVN within the tumour. In addition, we were not able to find statistical significance on the association between the location of the tumour within the optic disc and the presence of BVN absence (online supplemental table 1).
Supplemental material
When we compared the visual fields, represented by MD, PSD, and VFI values, between patients with complete and incomplete BVN formations, the patients with incomplete BVN formation showed a greater degree of visual field defect. Linear regression analyses showed that MD and VFI were significantly associated with the area of BVN absence but not with the tumour area. PSD was not significantly associated with either the area of BVN absence or the tumour area. We attribute this difference to the property of PSD, which is a metric to detect localised loss. PSD is known to increase in the early stages of visual field defect, but after reaching a certain point where there is severe damage, the PSD once again starts decreasing.19–21 We included one outlier (box plot not shown) in our data, which was the data point with the largest area of BVN absence shown in figure 4A,C. Excluding this data point would lead to loss of statistical significance in linear regression analyses between MD and VFI data with respect to the area of BVN absence. However, the eye that corresponded to this data point showed the most extensive BVN absence among 32 eyes. Since it is not common to find such extensive tumour in rare tumours, such as ODMs, we believe that including this data point in the analysis provides important insight on how extensively ODMs can affect the patient’s visual field. Optic disc oedema is known to be associated with blind spots.22 23 Although blind spot enlargement was noted in all of our cases with optic disc oedema (four cases in the complete BVN group and seven cases in the incomplete BVN group), there was no significant linear correlation between the area of optic disc oedema and all of the three visual field parameters in both incomplete and complete BVN formation groups (all p>0.05).
Though the size and location of BVN on OCTA are associated with visual field defect in ODM, precise mechanism of visual field defect is not completely understood. Previous studies investigated the meaning of incomplete BVN on OCTA as well as the mechanism of visual field defect in patients with ODM. A number of studies reported that location of visual field defects in ODM corresponded to the region of retinal nerve fibre layer (RNFL) thinning.16 24 25 These studies attributed RNFL damage to ischaemic and compressive axonal loss from compression by ODM. In another study, extension of pigmented tumour beyond the boundary of the disc approximated the enlargement of the blind spot.8 Although no case of retinal vein or artery occlusion or signs of ischaemic optic neuropathy (visual loss and optic disc oedema with hyperemia or peripapillary splinter haemorrhage) were observed in our study, studies show that ischaemic processes such as central retinal vein occlusion, central retinal artery occlusion and ischaemic optic neuropathies can occur secondary to ODM.5 26–28 Previously, compression of nerve fibres and disturbance of microcirculation in the optic disc head caused by the tumour were suggested as underlying mechanisms of visual field defects.9 29 Jain et al attributed attenuated signals on OCTA to vessel absence or very densely packed cells.14 Correlation study between OCT features and pathology showed that ODMs can exert compression on the optic nerve and infiltrate into the optic nerve, the retina, as well as the choroid.29 Our data suggest that BVN disturbance following tumour compression on optic nerve or infiltration to adjacent tissue is another important source of visual field defects. Obscuration of vessels may signify absence of vasculature or very densely packed cells, as well as posterior extent of the tumour.14 Accordingly, we believe absence of BVN on OCTA is a useful indicator of impairment in tumour vascularity, which potentially resulted from ischaemic necrosis in the tumour or vascular compression by the tumour.5 Decrease in perfusion from impaired vasculature may lead to RNFL thinning, ischaemic change in the optic nerve and eventually to visual field defect as was demonstrated in ODM as well as other disease related to the optic nerve.7 16 24 25 30 In a few of our cases, relatively large tumours showed complete or nearly complete BVN formation and caused little or no visual field impairment (figure 5A–E and online supplemental figure 1). These cases did not show extensive visual field defect corresponding to the location of ODM as in figure 3E, except nasal step in the superonasal visual field in figure 5E, which corresponded to the area of damaged axon at the inferotemporal region of the optic disc most likely from the compression of the tumour. Such data suggest that the degree of BVN formation might be more relevant than the tumour area to visual field defects in patients with ODM. Further longitudinal study with quantification of RNFL thinning and ganglion cell damage with respect to the degree of BVN absence may provide additional insight into whether BVN absence is associated with peripapillary RNFL thinning and ganglion cell damage. In addition, pathological data comparing BVN and tissue structure between incomplete and complete BVN tumours would provide further insight into the mechanism of BVN impairment and visual field defect in patients with ODM.
Supplemental material

Fundus photography, FA, ICGA and OCTA images of one patient with ODM. (A) Fundus photography showing pigmented lesion at the inferonasal side of the optic disc. (B) OCTA image showing complete blood vessel network formation in the area of the ODM. (C) FA showing hypofluorescence in most of the area of the ODM, which is located in the inferior region of the optic disc. (D) ICGA showing some retinal vessels in the area of the ODM. (E) Visual field data showing a VFI of 96% and an MD of −2.89 dB. Nasal step in the superonasal field is attributed to the area of damaged axon at the inferotemporal region of the optic disc, most likely from the compression of the tumour. FA, fluorescein angiography; ICGA, indocyanine green angiography; MD, mean deviation; OCTA, optical coherence tomography angiography; ODM, optic disc melanocytoma; VFI, Visual Field Index.
Previous studies comparing OCTA and FA data from ODM showed that OCTA was superior to FA in visualising vascular structure.7 14 16 Unlike FA, in which pigments block fluorescence signal, OCTA is able to detect movement of erythrocytes within blood vessels of ODM.16 Our study showed that the incomplete BVN group showed more cases with hypofluorescence on FA (p=0.004) than the complete BVN group, indicating that the former group had greater region of dense pigmentation. Penetration of OCTA can be limited by the thickness of the tumour, and such limitation could result in artefacts.31 According to one previous study, OCTA operating at 840 nm wavelength could visualise the full thickness of pigmented ODM in the range of 0.72–2.13 mm.32 However, all of the tumours in this study were evaluated with OCTA operating at 870 nm wavelength and showed thickness within the above range except for only one case, which showed a thickness of 2.21 mm. Therefore, most of the tumour vasculature included in this study was well visualised by OCTA.
Regarding the nature of BVN on OCTA, few studies suggested that the BVN on ODM consisted of abnormal vasculature.15 16 32 One study reported that tumour growth was correlated with surface tumour vasculature from FA.4 Although the BVN of ODM is distinct from normal capillaries of the peripapillary retina, BVN without dye leakage on FA may indicate tumour blood vessels with tight adhesion of pericytes and vascular endothelial cells.7 In our study, the incomplete BVN group showed more cases with dye leakage than the complete BVN group without significance (p=0.280). Whether the presence of dye leakage with respect to complete or incomplete tumour BVN is associated with tumour growth and malignant change is a topic of future research.
In patients with incomplete BVN, five eyes had OCTA data for 1 year after the initial visit. Four of five eyes showed increase in the area of BVN absence over 1 year without statistical significance (p=0.08). However, one eye with the largest increase in area of BVN absence (25%) over 1 year showed largest increase in tumour area (14%). This case showed the possibility that a rapidly growing tumour may accompany faster enlargement of area of BVN absence.
The limitations of this study include small sample size, the retrospective design and limited number of follow-up data. Additionally, some visual field defects cannot entirely be explained by the location of BVN absence or tumour. We attribute superonasal field defect noted in pattern deviation probability map (figure 3E) to inferotemporal capillary dropout within peripapillary atrophy (figure 3B).16 Although no case was previously diagnosed with glaucoma or any other diseases that could affect the visual field, whether these visual field defects originate from ODM need further investigation. In the future, longitudinal studies with larger sample sizes may provide further evidence to explain the change in the visual field with respect to the change in the area of BVN absence in ODM. In addition, studies on the genetic composition of ODMs with respect to BVN formation might shed light on how genetic differences can lead to differences in intratumoural vascular development.
This study presented a novel, non-invasive method of evaluating the effect of BVN absence on the visual field of patients with ODM using OCTA. For the first time, we divided ODMs into two groups according to the absence of BVN and showed that the degree of visual field defect can change significantly in association with the area of BVN absence. The location of BVN absence within the tumours corresponded to the location of hypofluorescence on FA as well as the location of the visual field defect. Visual field defects were more severe in patients with incomplete BVN formation than in those with complete BVN formation. Our data provide evidence that the circulation within ODM detected by OCTA, rather than the gross tumour area, is more closely associated with visual field defect in patients with ODM. The area of BVN absence may be more useful than the tumour area as an indicator of the degree of visual field defect in patients with ODM.
Data availability statement
Data are available upon reasonable request. Data are available from the corresponding author upon reasonable request.
Ethics statements
Patient consent for publication
Ethics approval
The study was approved by the institutional review board (IRB) of Yonsei University Medical Center before data review began, and the requirement to obtain informed consent from the subjects was waived by the IRB (IRB number: 4-2020-1116). This study adhered to the tenets of the Declaration of Helsinki.
References
Supplementary materials
Supplementary Data
This web only file has been produced by the BMJ Publishing Group from an electronic file supplied by the author(s) and has not been edited for content.
Supplementary Data
This web only file has been produced by the BMJ Publishing Group from an electronic file supplied by the author(s) and has not been edited for content.
Footnotes
Presented at Part of this study was presented as a poster at the 2020 Annual Meeting of the Korean Ophthalmological Society, 30 October–1 November 2020 in Seoul, Korea.
Contributors All authors have given final approval of this version to be published. JJK, SCL and CSL designed this study. SCL and CSL conducted this study. JJK and DHL managed the data. JJK and DHL analysed the data. JJK and CSL interpreted the data. JJK prepared the manuscript. JJK and CSL did the overall coordination.
Funding This research was supported by the Basic Science Research Program through the National Research Foundation of Korea under 2019R1A2C2002393. The funding organisation had no role in the design or conduct of this research.
Competing interests None declared.
Provenance and peer review Not commissioned; externally peer reviewed.
Supplemental material This content has been supplied by the author(s). It has not been vetted by BMJ Publishing Group Limited (BMJ) and may not have been peer-reviewed. Any opinions or recommendations discussed are solely those of the author(s) and are not endorsed by BMJ. BMJ disclaims all liability and responsibility arising from any reliance placed on the content. Where the content includes any translated material, BMJ does not warrant the accuracy and reliability of the translations (including but not limited to local regulations, clinical guidelines, terminology, drug names and drug dosages), and is not responsible for any error and/or omissions arising from translation and adaptation or otherwise.
Linked Articles
- Highlights from this issue