Article Text

Abstract
BACKGROUND/AIMS Vascular insufficiency due to abnormal autoregulation has been proposed as a major factor in the development of glaucoma. The anterior optic nerve is primarily perfused by the short posterior ciliary arteries. The autoregulatory capacity of these vessels in response to acutely elevated intraocular pressure (IOP) was examined in normal human subjects.
METHODS Colour Doppler imaging was performed on the short posterior ciliary arteries of 10 normal subjects at baseline and during four incremental IOP elevations. Using a scleral suction cup placed temporally, IOP was elevated to approximately 25, 30, 40, and 50 mm Hg. Additional measurements were performed immediately after pressure release. Systolic and diastolic flow velocities were measured and Pourcelot’s resistivity index was calculated.
RESULTS Systolic and diastolic flow velocities decreased linearly with each incremental increase in IOP (p<0.001). Pourcelot’s resistivity index increased linearly with each incremental increase in IOP (p<0.001). Changes in end diastolic velocity, peak systolic velocity, and Pourcelot’s resistivity index were linearly related to changes in IOP.
CONCLUSION The normal healthy eye is not able to autoregulate to maintain PCA blood flow velocities in response to acute large elevations in IOP.
- blood flow
- colour Doppler imaging
- posterior ciliary artery
- retrobulbar haemodynamics
Statistics from Altmetric.com
The pathogenesis of glaucomatous optic neuropathy remains incompletely understood. While elevated intraocular pressure (IOP) is a clear risk factor, vascular insufficiency and abnormal autoregulation of the optic nerve circulation have been hypothesised to play a significant role in the development and progression of glaucoma.1-4 It is possible that mechanical and vascular factors have a synergistic interaction. Experimentally, elevated IOPs have produced delayed circulation times, most notably in the peripapillary choroid.5 6 Similar findings have been described in glaucoma patients.7 8 Using colour Doppler imaging (CDI), abnormal blood flow velocities in the retrobulbar vessels of primary open angle and normal tension glaucoma patients have been measured.9-15 An increase in mean and end diastolic velocity and a decrease in resistance index have been noted in the central retinal and short posterior ciliary arteries of glaucoma patients after trabeculectomy.16 A recent CDI study of patients with non-ischaemic optic atrophy failed to demonstrate a significant change in retrobulbar haemodynamics suggesting that optic atrophy itself does not alter orbital haemodynamics to the extent noted in glaucoma patients.17 These findings and the possible association of normal tension glaucoma with vasospastic angina, migraine headache, and Raynaud’s disease18-20 add further support to a vascular contribution to glaucomatous optic nerve damage. Colour Doppler imaging has recently been used to demonstrate the highly dependent relation between central retinal artery haemodynamics and acute changes in IOP.21 Acute incremental elevation of IOP in healthy human subjects resulted in a progressive drop in central retinal artery blood flow velocities implying a close link among mechanical and haemodynamic factors in this particular vascular bed. In contrast, ophthalmic artery flow velocities were found to be unaffected by acute IOP changes. Since the anterior optic nerve is supplied largely by the short posterior ciliary arteries,1 22 the purpose of this study was to determine the relation between short posterior ciliary artery haemodynamics and acute changes in IOP. This was studied by using scleral suction to acutely alter IOP in healthy eyes and monitoring the short posterior ciliary arteries with non-invasive CDI.
Materials and methods
All subjects had normal eye examinations with the exception of refractive error. No subject had systemic vascular disease. Ten subjects, five men and five women, were studied. Their ages ranged from 26 to 56 years. All measurements were made on the left eye. This procedure was approved by the University of Miami Human Subjects Institutional Review Board. Informed consent was obtained from all subjects. All experimental procedures conformed to the tenets set out in the Declaration of Helsinki.
All subjects were reclined at 120°. Drops of 0.5% proparacaine hydrochloride (proxymetacaine, Alcon Laboratories, Fort Worth, TX, USA) were placed into each subject’s left eye. Cotton swabs soaked in 4% lignocaine hydrochloride were applied to the temporal conjunctiva for 2 minutes. Brachial artery blood pressures were measured using sphygmomanometry and IOP was measured using a Tono-Pen XL tonometer (Mentor, Inc, Norwell, MA, USA). A Quantum 2000V (Siemans, Issaquah, WA, USA) with a 7.5 MHz linear phased transducer was used by the same experienced examiner (EKG) for all CDI. Coupling gel was applied to the closed eyelid, and the probe was positioned using minimal pressure. A single retrobulbar pixel abutting the optic nerve shadow immediately posterior to the optic disc on the temporal side was identified. CDI is not able reliably to resolve individual posterior ciliary arteries. Using a knowledge of retrobulbar vascular anatomy with recognition of the typical visual23 and aural PCA Doppler waveforms, the authors were able to reproducibly locate a single or small cluster of PCAs. The same vessel or cluster of vessels was used in all subsequent studies. After baseline recordings were completed, an 11 mm suction cup was applied to the temporal sclera and the vacuum increased incrementally (Langham OBF System) to produce targeted IOPs of 25, 30, 40, and 50 mm Hg. CDI of the short posterior ciliary arteries and measurement of the IOPs occurred within 3 minutes of each IOP elevation. The sample volume was kept at a constant distance from the optic nerve and sclera (Fig 1). The angle between the globe and transducer was also maintained. The scleral vacuum was released following measurements at the fourth elevation of IOP. Colour Doppler imaging and IOP measurements then occurred immediately and up to 10 minutes after release.

(A) The colour Doppler spectrum from the temporal short posterior ciliary artery in one subject shows the characteristic baseline waveform. (B) The waveform was maintained after the scleral suction cup was applied, but the peak systolic and end diastolic flow velocities decreased while Pourcelot’s resistivity index increased. This continued with IOP increased to 40 mm Hg, and (C) 45 mm Hg. Spectral tracing below baseline in some patients suggests possible reversal of flow. (D) Following release of the suction cup there was a dramatic increase in peak systolic and end diastolic flow velocities with a decrease in Pourcelot’s resistivity index. The IOP also decreased below baseline values.
The authors used a printout of the baseline PCA waveform to confirm that subsequent measurements were on the same vessel. Inadvertent inclusion of the surrounding vasculature would result in recognisable changes in the waveform. Five of the 120 spectral waveforms were omitted from analysis because of suspected inclusion of the surrounding vasculature. Statistical analysis was performed using a pairedt test and repeated measures analysis of variance with orthogonal polynomial decomposition to test for linear, quadratic, and higher order trends. Peak systolic flow velocities (PSV) and end diastolic flow velocities (EDV) were measured from the spectral analysis waveforms. Pourcelot’s resistivity index [(PSV − EDV)/PSV] was calculated at each IOP condition.
Results
The average baseline IOP was 15 (SD 5) mm Hg. The average IOPs increased with each incremental increase in scleral suction (Table 1). The colour Doppler spectral waveform from the temporal short posterior ciliary arteries showed the characteristic baseline waveform (Fig 1). After the scleral suction cup was applied, the shape of the waveform was maintained after the IOP was increased. However, the height of the waveform decreased as demonstrated in a cooperative subject with the colour Doppler probe maintained in a constant position (Fig 2). When suction was released the IOP decreased significantly below baseline (p<0.001; paired t test) (Table 1). Note in all figures that data values were determined from the optimised waveforms on the right of the spectral tracing. These waveforms corresponded to the B-scan picture above the waveforms. Waveforms on the left represent readings taken while optimising the colour Doppler sample volume position within the vessel used in previous measurements.
Average IOP during suction ophthalmodynamometry

During a continuous scan with constant position of the eye and colour Doppler probe, the peak systolic and end diastolic velocities decreased immediately after an acute increase in IOP as indicated by the arrow. The shape of the waveform remained constant.
The mean baseline brachial blood pressure was 117 (11)/71 (10) mm Hg. No subject had a significant change in blood pressure during the study.
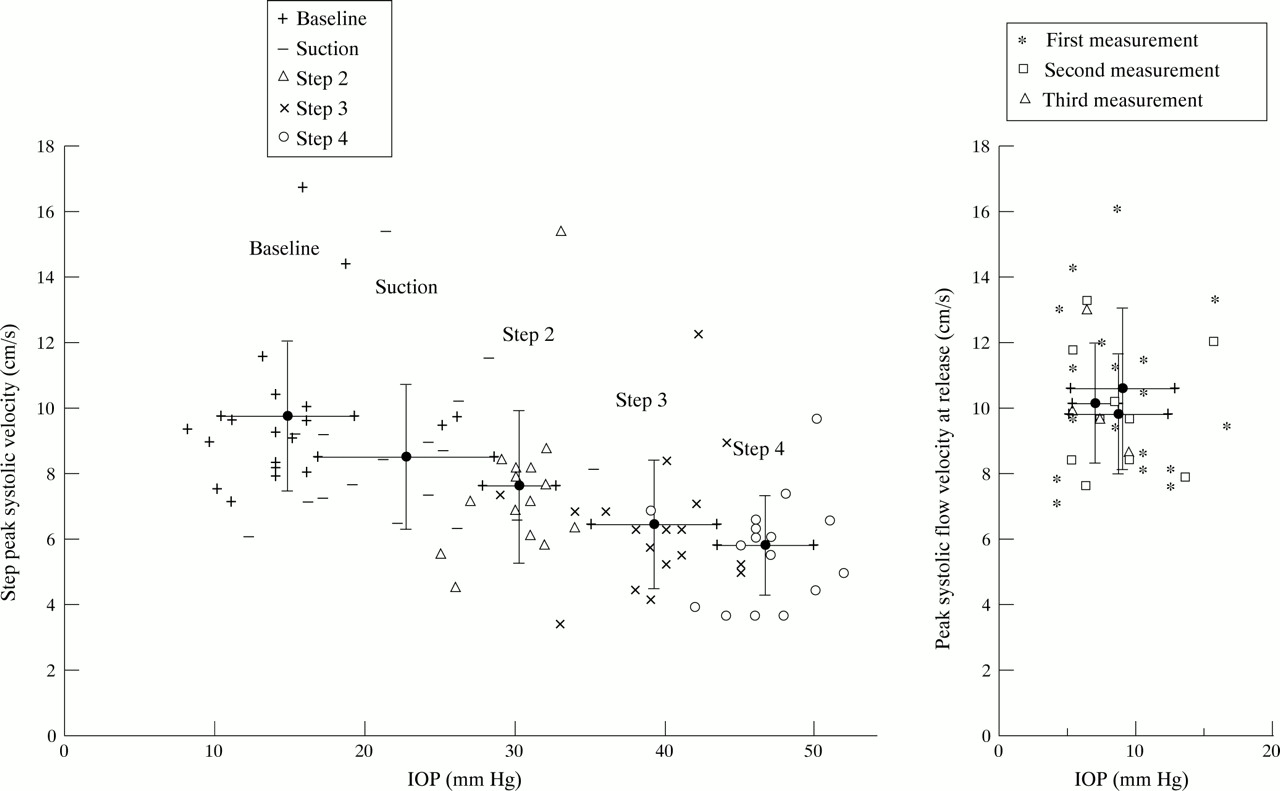
The blood flow velocities in the short posterior ciliary arteries were clearly dependent on IOP. There was a significant linear decrease in PSV with each incremental increase in IOP (p<0.001; orthogonal polynomial decomposition) (Fig 3). Following release of the vacuum there was a significant increase in PSV immediately and up to 10 minutes later (p<0.001; paired t test). Similarly, the average EDV significantly decreased with each incremental increase in IOP (p<0.001; orthogonal polynomial decomposition) (Fig 4). After release of scleral suction the EDV increased significantly immediately and up to 10 minutes later (p<0.001; paired t test).

(Left) Average peak systolic flow velocity (SD) significantly decreased from the baseline value after placement of the scleral suction cup (p<0.001). There was a significant linear decrease with the incremental increases in IOP (p<0.001). (Right) Three measurements made immediately after release of scleral suction and within the following 10 minutes show a significant increase in peak systolic flow velocity and a decrease in IOP to below baseline.

(Left) Average end diastolic flow velocity (SD) significantly decreased from the baseline value after placement of the scleral suction cup (p<0.001). There was a significant linear decrease with the incremental increases in IOP (p<0.001). (Right) There was a significant increase immediately and up to 10 minutes following release of scleral suction.
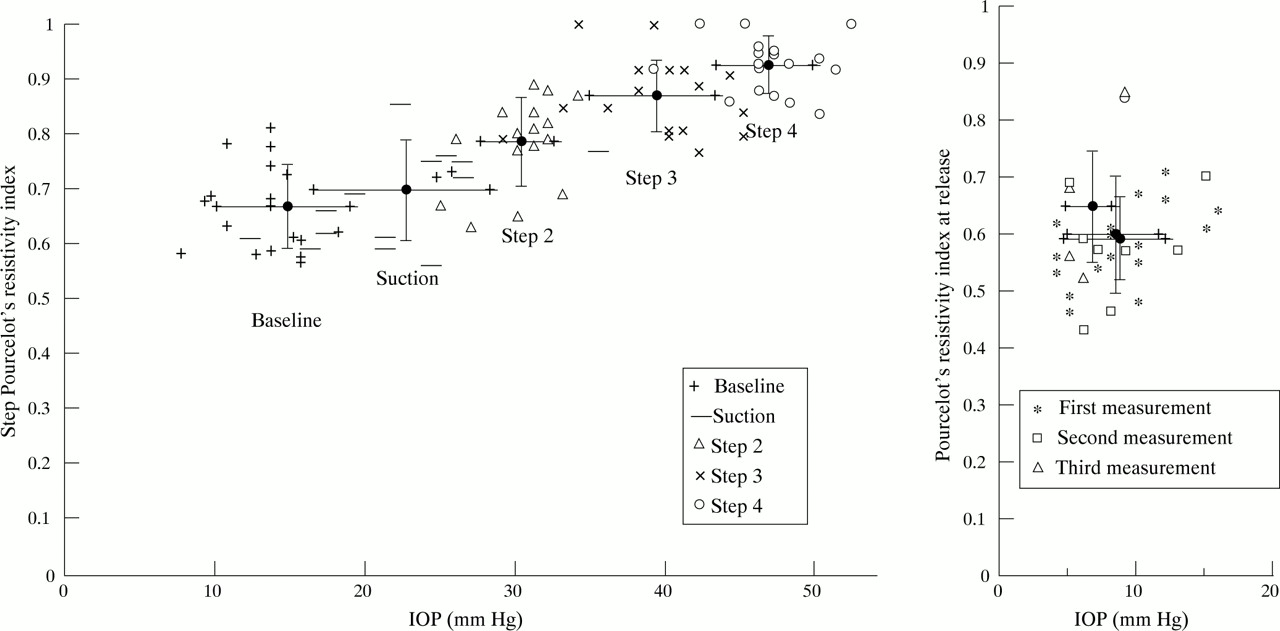
The average resistivity index significantly increased from baseline after placement of the scleral suction cup (p<0.017; pairedt test) and increased linearly with each incremental increase in IOP (p<0.001; orthogonal polynomial decomposition) (Fig 5). Immediately after pressure release the resistivity index decreased significantly immediately and up to 10 minutes later (p<0.001; paired ttest).

(Left) Average Pourcelot’s resistivity index (SD) significantly increased from baseline after placement of the scleral suction cup (p<0.017). There was a significant linear increase with the incremental increases in IOP (p<0.001). (Right) There was a significant decrease immediately and up to 10 minutes following release of scleral suction.
Discussion
It is widely accepted that the short posterior ciliary arteries represent the main source of blood for the anterior optic nerve.22 24 Because of this, a more complete understanding of the haemodynamic properties of these vessels, especially in response to elevated IOP, may well enhance our understanding of the pathogenesis of glaucoma. The optic nerve often lies in a watershed zone located between the distinct circulations of various posterior ciliary arteries25 and is therefore hypothesised to be particularly vulnerable to ischaemia in circumstances of decreased perfusion pressure.24 Such a decrease in ocular perfusion pressure would occur as IOP increases while mean arterial blood pressure remains constant.
The relation of IOP and optic nerve blood flow has been the focus of several studies. Often located in a watershed zone, the blood flow of the peripapillary choroid has been shown to be particularly susceptible to elevated IOP.1 6 26 27 A similar pattern has been described in patients with glaucoma.28 Despite these findings, there is much evidence to suggest that blood flow to the anterior optic nerve is effectively autoregulated over a substantial range of IOPs. Angiography studies suggest that peripapillary choroidal flow is maintained with pressures as high as 80 mm Hg.29Studies in cats using iodoantipyrine demonstrated minimal effect on optic nerve head blood flow of IOP elevated to within 25 mm Hg of mean femoral blood pressure.30 Even higher IOPs were required to decrease blood flow at the level of the lamina cribrosa. Studies using monkeys found only minor changes in blood flow with IOP up to 75 mm Hg.31 Laser Doppler flowmetry has also detected relatively constant optic nerve head haemodynamics over a wide range of acute IOP changes by scleral suction.32 Optic disc oxygen tension has been shown to be autoregulated in instances of decrease perfusion pressure.33 In addition, cats given infusion of angiotensin I when exposed to elevated IOP have been shown to suffer more short term axonal injury suggesting possible blockage of autoregulatory function.34 Although not all studies are in agreement,35 36 existing evidence suggests efficient autoregulation of blood flow to the anterior optic nerve over a significant range of IOP. Clearly, an impairment of such regulatory function could result in inappropriate blood flow in circumstances of elevated IOP.
Our investigation attempts to search for evidence of autoregulation through analysis of the haemodynamic properties of short posterior ciliary arteries in healthy humans with artificially elevated IOPs. Unfortunately, without knowledge of the lumenal diameter of the sampled vessels at the time of measurement, colour Doppler imaging and the resultant waveforms are not able to provide direct information about volumetric blood flow. However, it is possible that the consequences of autoregulation of blood flow may produce observable changes in the spectral waveform and calculated resistance index.
The results of this study show that short posterior ciliary artery haemodynamics are altered by elevated IOP and the consequent drop in perfusion pressure. Both peak systolic velocity and end diastolic velocity decrease linearly in response to elevation of IOP. Pourcelot’s resistivity index increased linearly with each increase in IOP over baseline. This index represents a quantification of resistance distal to the point of measurement and has been validated in vitro.37 A rise in resistance index indicates that vascular resistance is increasing downstream to the site of measurement. This may be caused by arteriolar, capillary, and/or venous compression.
The haemodynamic properties of the short posterior ciliary arteries in response to elevated IOP do not imply the presence of downstream autoregulation. Because the short posterior ciliary arteries predominately supply the choriocapillaris, these results are in agreement with previous findings of poor autoregulatory capacity of the choroidal circulation.38
The elevation of the resistance index is likely the consequence of mechanical compression of the choroid from the elevated IOP. These data do not exclude the presence of downstream autoregulatory capacity of the anterior optic nerve circulation. It is unlikely that the optic nerve circulation represents a sufficient proportion of the short posterior ciliary artery circulation to be reflected in the resistance index. The precise autoregulatory changes which may exist in the peripapillary vasculature would represent a very small percentage of the total choroidal blood flow. Such changes may not be sufficient to result in measurable haemodynamic changes in the short posterior ciliary arteries being studied.
We recorded our data within 3 minutes of each stepped increase in IOP. Previous studies of optic disc oxygen tension33 and retinal blood flow39 have suggested that an autoregulatory response would occur within the first minute and therefore should have been reflected in our data. Based on our results we can not rule out a more delayed autoregulatory effort in response to prolonged IOP elevation.
In our study, elevated IOP was imposed upon healthy eyes for a limited period of time in order to provide an uncomplicated model of the normal haemodynamic changes associated with acute ocular hypertension. The coexistence of additional pathological conditions such as hypertension or diabetes, as is present in many patients with glaucoma, could affect the haemodynamic changes resulting from acute elevation of IOP. In addition, chronic ocular hypertension, as encountered in most clinical settings, may result in much different haemodynamic changes. Cerebrovascular responses to acute and chronic changes in perfusion pressure have been shown to be different.40
In conclusion, this study demonstrates that the haemodynamic characteristics of the short posterior ciliary artery circulation are highly dependent on IOP. Our data do not reflect or suggest autoregulation of flow in the short posterior ciliary arteries in response to acute incremental elevations in IOP.
Acknowledgments
This work was supported by unrestricted grants from Research to Prevent Blindness Inc to Vanderbilt University and the Bascom Palmer Eye Institute. This work was supported in part by US Public Health Service National Service Research Award T32 EY 07021 and by a grant of the Deutsche Forschungsgemeinschaft Pi 181/3-1, Bonn, Germany. This project was also supported in part by the Murray Foundation and by Public Health Services grant EY10900 awarded by the National Eye Institute, Bethesda, Maryland.
The authors acknowledge Yanet Suarrez and Jin Hui Shen for technical support.