Article Text

Abstract
AIM A study was undertaken to investigate the correlation between colour discrimination tests and the presence of macular oedema in patients with type I diabetes to find a sensitive diagnostic tool for the detection of early functional changes.
METHODS The study was performed in 39 type I diabetic patients, 10 with and 29 without macular oedema. The examination included biomicroscopy, fundus photography of the macula, videofluorescein angiography, the LogMAR visual acuity chart, Farnsworth-Lanthony desaturated D-15 test, and the new Mollon-Reffin “Minimalist” test for colour vision deficiencies version 6.0.
RESULTS A highly significant correlation was found between the tritan value of the Mollon test and the presence of clinically significant macular oedema (p<0.0015), with a high sensitivity (88.9%) and specificity (93.3%). The DD-15 test was not significant (p=0.345) and showed low sensitivity for the presence of macular oedema (36%). All variables concerning the grading of macular oedema showed a highly significant association with the tritan values of the Mollon test (p<0.0001).
CONCLUSION The results suggest that the Mollon-Reffin “Minimalist” test version 6.0 is the best colour discrimination test for detecting macular oedema, with higher specificity and sensitivity than the other methods used in the study.
- diabetic retinopathy
- colour discrimination
- Mollon-Reffin test
- DD-15
- macular oedema
- colour vision
Statistics from Altmetric.com
Macular oedema is a major cause of visual loss in diabetic patients. The Wisconsin epidemiological study found an incidence of 20.1% over a period of 10 years for macular oedema in the younger onset group. Photocoagulation treatment decreases the risk of visual impairment, and an early diagnosis of diabetic macular oedema is essential for optimal prevention of functional loss. Macular oedema is difficult to detect by routine ophthalmological examination, visual testing, or biomicroscopy. Fluorescein angiography carries the risk of an allergic reaction and the required set up is not always available. It is therefore necessary to develop an additional non-invasive diagnostic method to evaluate retinal dysfunction caused by diabetic macular oedema.
Several studies have reported reduced colour discrimination in patients with diabetic retinopathy of all degrees of severity, but there has been no analysis of the influence of macular oedema. Later studies have investigated colour discrimination in patients with diabetic macular oedema using the Farnsworth-Munsell 100 hue test or the Farnsworth-Lanthony desaturated D-15 (DD-15) test and a more pronounced tritan defect was found in affected eyes.
We have examined whether a correlation exists between the degree of macular oedema of diabetic patients and the results of several functional tests, including colour discrimination as tested with the Farnsworth-Lanthony DD-15 test and the Mollon-Reffin “Minimalist” test.
Methods
SUBJECTS
The patient group was recruited prospectively from our outpatient department of retinal vascular and macular diseases and consisted of 16 men and 23 women aged 17–47 years. Thirty seven (95%) of the 39 patients had undergone intensive insulin treatment (baseline injection of long acting insulin, several injections of short acting insulin at mealtimes) and two had received conventional insulin treatment (one or two daily injections of long acting insulin), and for all but one patient a recent glycosylated haemoglobin (HbA1C) value could be obtained.
Admission criteria included type I diabetes with or without diabetic retinopathy and with best corrected visual acuity of >0.4 LogMAR (0.4 Snellen value). Because of the influence of nuclear sclerosis on colour vision, only patients younger than 50 years of age and with no lens opacities according to the Lens Opacities Classification System (LOCS) III were included. Only one eye of each patient was included in the statistical analysis. The eye to be studied was designated on the basis of the patient's birth month: in patients born in the first half of the year the right eye was selected, and in those with a birth month in the second half of the year the left eye was used. In patients who had macular oedema in one eye only, this eye was designated for the study. Nineteen right eyes (49%) and 20 left eyes (51%) were included in the analysis, resulting in an equal distribution between left and right eyes.
Exclusion criteria were congenital colour vision deficiencies, cataract, glaucoma, any retinopathy, new vessels, or chorioretinal scars in the macula. We also excluded patients with more than mild proliferative diabetic retinopathy and patients who had a history of intraocular surgery or laser therapy, because patients can have a tritan defect as a side effect of laser therapy.
STUDY DESIGN
Ophthalmological examination included best corrected visual acuity in LogMAR units using Bailey Lovie charts numbers 4 and 5 (National Vision Research Institute, Australia), and colour discrimination testing using the Farnsworth-Lanthony desaturated D-15 test and the Mollon-Reffin “Minimalist” test version 6.0. The chromaticities used are indicated in the original paperso anyone interested can construct their own copy of the test. For identification of subjects with congenital colour vision deficit and their exclusion from our study a Nagel anomaloscope (Schmidt and Haensch) was used. The LogMAR charts were used at a distance of 3 m with direct illumination of 60–120 cd/m2. The colour discrimination tests were conducted using an Osram AG lamp at a temperature of 5400 Kelvin and an illumination of 1200–1500 lux, 50 cm above the colour test. Both tests were first performed binocularly for training purposes and then with the right and left eyes separately.
The Mollon-Reffin test contains a set of grey chips of varying lightness which serve as the background chips, a set of coloured chips, the probe chips, and an orange demonstration chip. Five of the grey chips are placed randomly on the black Plexiglass. To these the examiner first adds the orange chip, which does not lie on any confusion line, mixes it with the grey chips, and invites the patient to identify the “coloured chip” by touching with a pointer. If the patient successfully identifies the orange chip, the examiner draws a probe chip from the middle of the protan series. After correct identification of this probe, the examiner then moves inwards along the confusion line and presents the least saturated chip; if, on the other hand, the response to the first protan probe is incorrect, the examiner moves outwards to the most saturated chip. On subsequent trials a simple staircase procedure is used to establish the maximal chroma at which the patient fails. The same process is then repeated for the tritan and deutan axis.
Colour discrimination deficits detected with the DD-15 test were analysed using a software program for calculating the total colour difference score (TCDS). For the Mollon-Reffin test the score value was defined as the number of the reliably identified coloured chip for each confusion line.
The intraocular pressure was measured with an applanation tonometer. After the pupil was maximally dilated with 0.5% tropicamide and 2.5% phenylephrine the retina was carefully examined by biomicroscopy with a Volk 90D lens. The biomicroscopic finding was documented using the ETDRS final retinopathy severity scale. The presence of clinically significant macular oedema (CSMO) according to the ETDRS criteria was established by biomicroscopy. Stereoscopic colour fundus photographs of the standard field no 2 were taken with a fundus camera (Canon CF-60UV with Kodak Ektachrome 100HC) to classify the macular oedema. Fluorescein angiography was recorded using a scanning laser ophthalmoscope (Rodenstock, Germany). A bolus injection of 5 ml of 10% fluorescein sodium (Braun Melsungen, Germany) was injected into the antecubital vein and the angiograms were recorded on an S-VHS video recorder (Panasonic 7330).
The fundus photographs and the angiograms were graded by two independent examiners and, where there were differences of opinion, these were resolved by discussion. For the grading of the fundus photographs a transparent overlay with a circle of 1 disc diameter (DD) radius was fixed over the image. By using a Donaldson 5× stereoscopic viewer the degree of macular oedema was determined using the modified Airlie House classification. As morphological variables the following lesions were graded: degree of CSMO (1 = no evidence, 2 = questionable involvement, 3 = size of oedema ⩾1 disc area, a part <1 DD from the centre, 4 = thickening/hard exudates <500 μm from the centre); hard exudate at the centre (1 = no evidence, 2 = questionable involvement, 3 = definite involvement by hard exudate); size of macular retinal thickening <1 DD from the centre (1 = no evidence, 2 = questionable involvement, 3 = size of thickening <0.5 disc area, 4 = size of thickening <1 disc area, 5 = size of thickening <2 disc area, 6 = size of thickening = 2 disc area); and maximal retinal thickness at the centre (1 = no evidence, 2 = questionable involvement, 3 = thickness of <1 × reference, 4 = thickness of 1 × reference but <2 × reference, 5 = thickness of 2 × reference but <0.5 DD, 6 = thickness ⩾0.5 DD). The videos of the angiograms were studied on a black and white high resolution monitor. The classification of the angiogram was performed in field 2 with a 20° central subfield using the ETDRS fluorescein angiogram grading form.
STATISTICS
For statistical analysis the software program statviewversion 4.5 (Abacus Concepts Inc) was used. Statistical tests including Kendall correlation, analysis of variance (ANOVA), and multiple and logistic regression were used to analyse patient data, particularly for significance of correlation between the results of the functional tests, on the one hand, and age, duration of diabetes, duration of the intensified insulin treatment, HbA1C, stage of retinopathy, and pathological changes detected in the macula; p values of <0.05 were considered to be statistically significant. All tests were used in a two tailed manner.
To determine the sensitivity and specificity the χ2 test was used. Sensitivity represents the probability of a test giving a positive result when the disease is present, and specificity is the probability of a negative result when the disease is absent.
Results
Most of the eyes were classified as having low levels of retinopathy; 12 (31%) had no diabetic retinopathy, nine (23%) had early, nine (23%) had mild, four (10%) had moderate, three (8%) had severe non-proliferative diabetic retinopathy and two (5%) had mild proliferative retinopathy. The presence of CSMO according to the ETDRS criteria was established by biomicroscopy and verified by stereo colour photography in 10 (26%) eyes.
Table 1 shows the characteristics of all the patients, with and without CSMO. The normal value for the TCDS of the DD-15 test is 116.9 and for the Mollon-Reffin test in all axes it is 1.
Mean (SD) data of patients with and without clinical significant macular oedema (CSMO)
No patient showed the error configuration typical of hereditary colour vision deficit in the DD-15 test. The tests for the deutan and protan axes of the Mollon-Reffin test were completed without error by all patients (score 1), the tritan (T) value was increased in nine eyes (23%).
DEPENDENCE ON AGE AND DURATION OF DIABETES
Significant correlation was found between age and the DD-15 colour discrimination tests (p<0.0001; Kendall), as well as between age and capillary loss (p=0.0236), and age and capillary dilatation (p=0.0124). The degree of macular oedema was not significantly correlated with age.
None of the tests showed significant correlation with duration of diabetes. Generally, a higher significance was established between duration of diabetes and the morphological variables, but this trend was also age dependent (capillary loss, p<0.0001; capillary dilatation, p=0.0019; leakage, p=0.0181; but CSMO, p=0.189; Kendall). Patients with CSMO or more severe retinopathy had a significantly longer duration of diabetes (p=0.0003 and p<0.0001; ANOVA).
DEPENDENCE ON RETINAL MORPHOLOGY
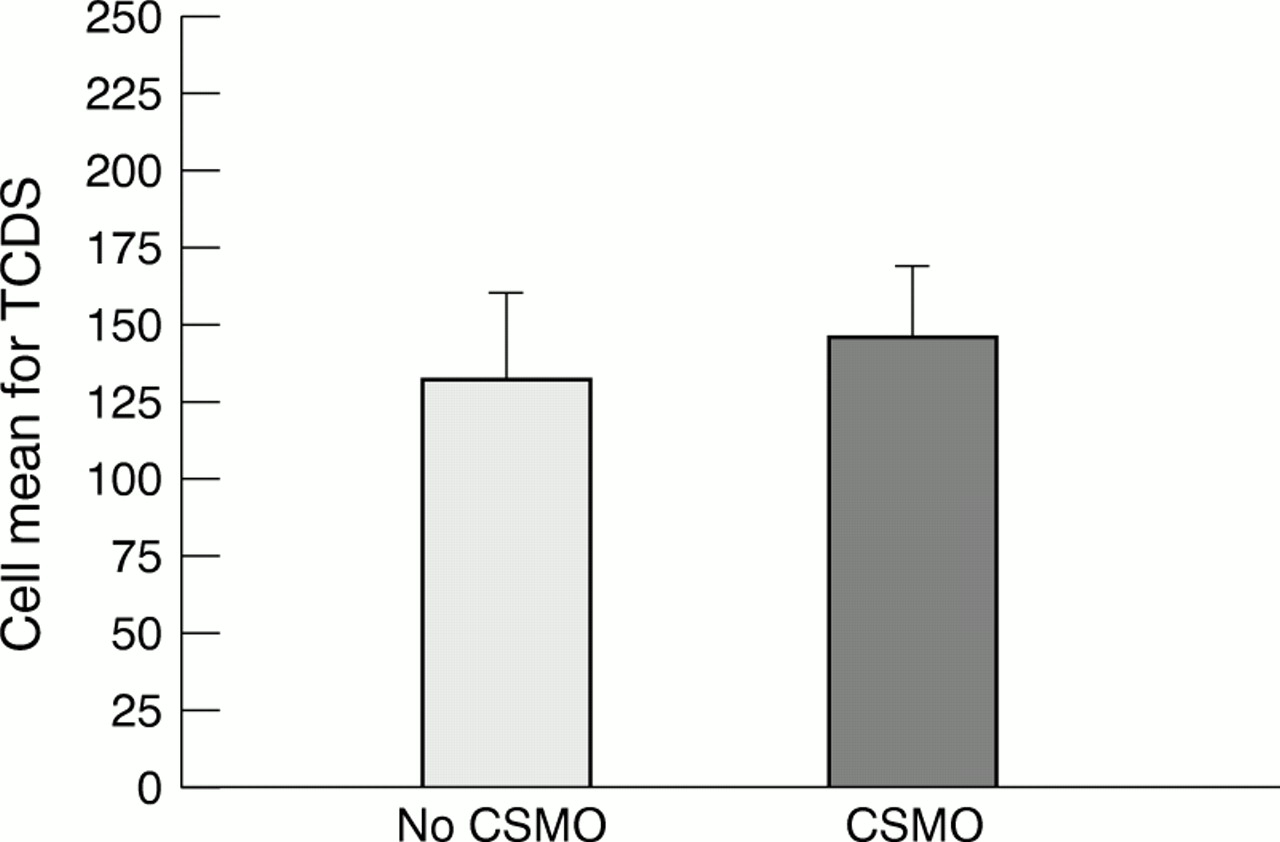
Patients with macular oedema had poorer visual acuity (p=0.692) and a higher TCDS (Fig 1, p=0.345) but only the Mollon T score differed significantly (Fig 2, p=0.0015; logistic regressionr 2 = 0.565). Table 2 shows the p values and adjusted r 2 of the correlation between the T value of the Mollon-Reffin test and the morphological variables of the retina. Thus, it can be asserted that the T score of the Mollon-Reffin test showed a significant correlation with the morphological features of maculopathy as established by photography (p<0.0001; multiple regression) and with the degree of angiographic leakage.

The colour discrimination deficit detected with the DD-15 test compared with the level of diabetic retinopathy with or without clinically significant macular oedema (CSMO). The total colour difference score (TCDS) was higher when macular oedema was present but there was no significant correlation (p=0.345; logistic regression).

Dependence of the Mollon-Reffin test results in the tritan (T) axis on the level of diabetic retinopathy, with or without clinically significant macular oedema (CSMO). A significant correlation was seen only in cases of macular oedema (p=0.0015; logistic regression).
Dependence of tritan value of Mollon-Reffin test on the morphology (p values with logistic or multiple regression (n=39 or n=38))
To exclude the effect of age from the other variables we performed a logistic regression. A significant correlation was found between the presence of macular oedema and the Mollon-Reffin T score (p<0.0025) but there was no correlation between macular oedema and the TCDS of the DD-15 test (p=0.4282). There was no correlation between the results of the colour discrimination tests and the level of retinopathy.
SPECIFICITY AND SENSITIVITY OF FUNCTIONAL TEST RESULTS FOR MACULAR OEDEMA
To determine the specificity and sensitivity of the tests the results were divided into two groups and the χ2 test was applied: (1) patients with normal values (visual acuity = 0.0 LogMAR (28 patients), Mollon T score = 1 (30 patients), TCDS = 116.9 (17 patients)) and (2) patients with abnormal values (visual acuity >0.0 LogMAR (11 patients), Mollon T score >1 (nine patients), TCDS >116.9 (22 patients)). Only the Mollon-Reffin test correlated highly significantly with the presence of diabetic macular oedema (p<0.0001, χ2 test), and only this test had clinically useful values for sensitivity and specificity (88.9% and 99.3%, respectively). Visual acuity and the DD-15 test recorded low sensitivity for the presence of macular oedema (45% and 36%)—that is, these two tests give conservatively negative results in most cases of diabetic macular oedema. The specificity for detecting macular oedema was 82% for LogMAR visual acuity and 88% for the DD-15 test. The differences in the sensitivity and specificity of the three functional tests for the presence of macular oedema are illustrated as receiver operator curves (ROCs) in Figure 3.

Sensitivity and specificity of visual acuity (VA), DD-15 and Mollon-Reffin tests for macular oedema shown as ROCs. The tritan (T) value of the Mollon-Reffin test was a better predictor than the other tests because it had a lower false positive rate (1 − specificity) for all values of sensitivity. The highest false positive rate was shown by the DD-15 test.
Discussion
The aim of this study was to investigate the correlation between the colour discrimination tests and the presence of macular oedema. In addition, we examined which of the applied functional tests had the best sensitivity and/or specificity for the detection of macular oedema in diabetic patients. Several studies have already examined visual acuity and the Farnsworth-Lanthony test in diabetic patients, but such studies have not been carried out for the Mollon-Reffin “Minimalist” test.
An increased extent of macular oedema or more severe retinopathy is a risk factor for visual impairment but, in the presence of focal macular oedema, visual acuity can be normal. Five (50%) of our patients with CSMO had a visual acuity of ⩽0.0 LogMAR. Three of these five patients presented with an abnormal Mollon T value. If cystoid changes are found in the angiogram, the visual acuity is decreased and this is correlated with the number and size of the cysts. This is in agreement with our study, since three of the four patients with cysts in the angiogram also had a LogMAR value of <0.0.
The colour discrimination defect is even more pronounced in diabetic patients with macular oedema. Bresnicket al found that, with the FM-100 test, macular oedema, capillary loss and leakage are correlated with the error score. The highest significance level was associated with leakage, which is similar to our results. These authors and an ETDRS report have reported that the tritan axis is more severely affected than the protan and deutan axes in patients with diabetic maculopathy and that this tritan-like defect increases in magnitude with increasing severity of macular oedema. Hudsonet al found increased sensitivity of short wavelength pathways in detecting CSMO. The position of the localised field loss corresponded to the clinical mapping of the extent of the oedema. A correlation between the selective loss of the short wavelength pathway sensitivity and the severity of diabetic macular oedema has already been demonstrated using an incremental threshold technique.
Macular oedema reduces the transmission of light to the photoreceptors. This might affect the blue rather than the red-green mechanism as a result of the lower density and number of blue cones in the human fovea. Another possible explanation for the tritan colour defect—similar to retinal detachment—might be the oblique orientation of the photoreceptors that occurs after retinal detachment and other retinal pathologies.
The best correlation was found between the presence of macular oedema and the Mollon-Reffin “Minimalist” test version 6.0. The DD-15 test only identifies the confusion axis for blue-yellow defects while the Mollon-Reffin test examines the tritan axis separately, directly along the confusion line. This is probably the reason for the higher sensitivity and specificity of the Mollon-Reffin test for detecting acquired colour discrimination defects in the tritan axis. With regard to the sensitivity and specificity, we found that the Mollon-Reffin test was the only colour discrimination test that might be appropriate for clinical use. In our study we included only patients without any lenticular opacities. Since patients with diabetes are more likely to develop cataracts than those without, a blue-yellow colour defect indicated from the lenticular opacities may occur earlier in this group than in the normal population. The use of blue-yellow colour vision tests without examination of the lens in diabetic patients older than 30 is therefore inadvisable.
In summary, our data indicate the usefulness of a simple colour discrimination method, the Mollon-Reffin “Minimalist” test version 6.0, as part of the screening and follow up examination for macular oedema in young patients with juvenile onset diabetes.
References
Notes
-
Proprietary interest: none.