Article Text

Abstract
AIMS Quantification of retinal vascular change is difficult and manual measurements of vascular features are slow and subject to observer bias. These problems may be overcome using computer algorithms. Three automated methods and a manual method for measurement of arteriolar diameters from digitised red-free retinal photographs were compared.
METHODS 60 diameters (in pixels) measured by manual identification of vessel edges in red-free retinal images were compared with diameters measured by (1) fitting vessel intensity profiles to a double Gaussian function by non-linear regression, (2) a standard edge detection algorithm (Sobel), and (3) determination of points of maximum intensity variation by a sliding linear regression filter (SLRF). Method agreement was analysed using Bland–Altman plots and the repeatability of each method was assessed.
RESULTS Diameter estimations obtained using the SLRF method were the least scattered although diameters obtained were approximately 3 pixels greater than those measured manually. The SLRF method was the most repeatable and the Gaussian method less so. The Sobel method was the least consistent owing to frequent misinterpretation of the light reflex as the vessel edge.
CONCLUSION Of the three automated methods compared, the SLRF method was the most consistent (defined as the method producing diameter estimations with the least scatter) and the most repeatable in measurements of retinal arteriolar diameter. Application of automated methods of retinal vascular analysis may be useful in the assessment of cardiovascular and other diseases.
- computer algorithms
- automated measurement
- retinal arteriolar diameters
Statistics from Altmetric.com
The retinal arteriolar network is readily viewed in vivo and has long been known to exhibit abnormalities in disease states such as hypertension and diabetes. Changes in the hypertensive retina may be qualitatively graded according to the presence of haemorrhages, exudates, and arteriovenous crossing phenomena. Although these changes have prognostic value, most hypertensives now present early with minimal retinal change and qualitative assessment in these circumstances is of little prognostic use.
More recently, quantitative assessments of the retinal vasculature have been performed. However, such measurements are complicated by varying refractive indices and the effects of magnification of the optic media, requiring the use of corrective factors which may be inaccurate.
An alternative way of quantitatively describing the retinal vascular network is to summarise the geometry of individual bifurcations in terms of their bifurcation angles (ω) and junction exponents (X) (see Fig 1). The junction exponent, a dimensionless measure of the relation between diameters of parent and daughter blood vessels, overcomes problems associated with interindividual differences in magnification. Theoretical optimal values for ω and X maximise vascular surface area for metabolic exchange while minimising power losses and intravascular volume. Analyses in a variety of animal and human circulations yield junction exponents remarkably close to the optimal value in healthy, but not in diseased, arterial networks. Both ω and X also have implications for vascular density. Narrowed angles and reductions in X from optimum values are associated with less dense vascular networks.

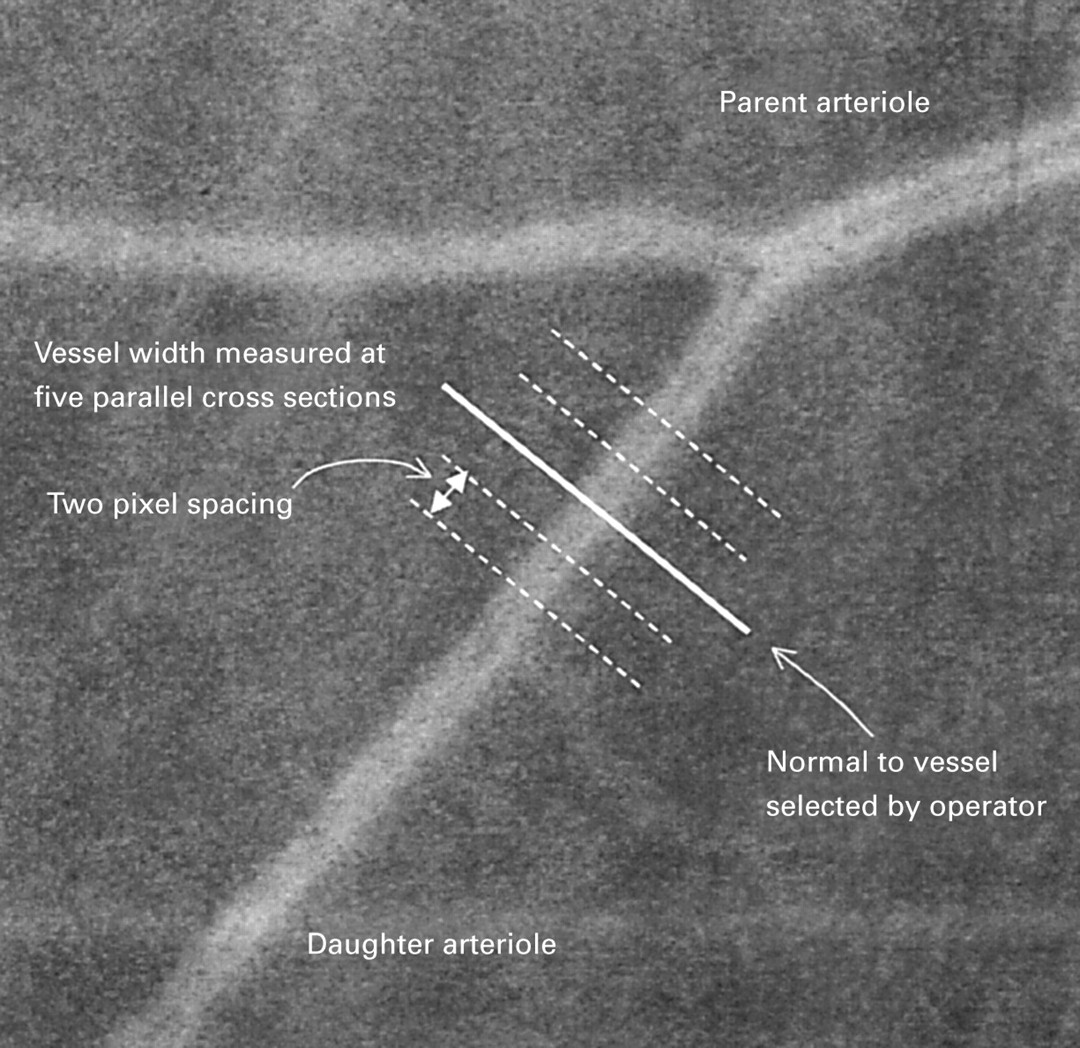
Image showing a retinal arteriolar bifurcation. To measure vessel diameters using operator dependent automated techniques a line is drawn perpendicular to the arteriole (bold line). A total of five measurements are made along parallel lines drawn with 2 pixel spacing between each measurement using the algorithms described (not drawn to scale).
Applying the measurement of bifurcation geometry to the human retina, we have shown that arteriolar bifurcation angles are reduced in various groups at risk of cardiovascular disease. Junction exponents, while not differing significantly between hypertensives and normotensives, decline with advancing age. In addition, length-diameter ratios of arterioles, another dimensionless measure, are significantly greater in hypertensives compared with normotensives.
In order to gain meaningful values of X, accurate measurements of arteriolar diameters are essential. Measurement of diameters by operator identification of vessel edges is time consuming and potentially subject to error and observer bias. This is particularly relevant when using red-free retinal photographic images, in which vessel edges may be ill defined. Other groups have used computer assisted techniques to overcome the subjective nature of operator dependent identification of vessel edges, the most commonly used method being the “half height” method. However, this method makes measurements based on only a limited amount of information in the intensity cross section, and therefore would be expected to be susceptible to image intensity noise and imperfections in the image acquisition process, such as the effect of film grain. This expectation is supported by our experience of applying this method to red-free retinal images. Accordingly we have sought to develop model and edge based techniques which take account of more information in the cross section, thus improving their robustness in the presence of such noise and imperfections. This paper compares the performance of three such methods, using diameters obtained by operator identification of vessel edges in fluorescein and red-free images as reference measurements.
Methods
SUBJECTS
Retinal images used in the current study were from male and female patients aged 30–80 years who had undergone both fluorescein angiography and retinal photography using a red-free filter to enhance contrast.
IMAGE HANDLING
Photographic diapositives were digitised using a Nikon 35 mm film scanner (LS-1000, Nikon, Tokyo, Japan). Digitised images were 2800 × 2400 pixels in size. Operator directed image analysis was performed using an application package within the matlab environment (Matlab Version 5.2, MathWorks Inc, MA, USA). A single trained observer made all measurements.
TECHNIQUES FOR DETERMINATION OF VESSEL DIAMETERS
The following four techniques for determining the width of a retinal arteriole were compared:
(1) Manual measurements
Manual measurements were made by calculation of linear distance between two points input by the operator, judged to correspond to opposite edges of the vessel. A 512 × 512 pixel region of interest was selected from the digital images used by the other techniques and was displayed in a window on a 15 inch CRT monitor. The vessel edges were selected by the operator by means of a mouse driven cursor.
(2) Gaussian measurements
Fitting of a double Gaussian model to the intensity cross section of the vessel was performed to determine a set of parameters characterising the vessel. The intensity cross section of the vessel was modelled by the function
and the parameters a 1 toa 5 anda 7 were determined for a given intensity profile by means of a modified Levenberg–Merquardt least squares method. The width of the vessel was calculated to be 2.33 a 3.
(3) Sobel measurements
Identification of vessel edge positions was performed by means of Sobel edge detection masks. The position of the vessel edge was determined from the mean position of maximum edge strength, averaged over a three pixel window.
(4) Sliding linear regression filter (SLRF) measurements
Identification of edge positions was made by means of linear regression within a sliding window filter. This technique incorporates adaptation of the size of the filter window, according to the approximate size of the vessel determined from a statistical computation. This technique is discussed further in the .
The three latter techniques are based upon measurement of vessel width along a cross section of the vessel manually selected by the operator to lie normal to the vessel axis. For each measurement, vessel width is estimated across a total of five parallel cross sections, two either side of that selected by the user, each cross section being two pixels away from its neighbour. This is illustrated in Figure 1.
IMAGE ANALYSIS
Sixty arteriolar segments, clearly identifiable on both fluorescein angiograms and red-free images, were selected. Diameters were measured five times by manual identification of vessel edges from both fluorescein angiograms and red-free images, and median values of each were stored for subsequent analysis. Each of the three computer algorithm techniques for determining the diameter of retinal arterioles from red-free images was tested. The median of the resulting five cross sectional diameter estimates was calculated and used in subsequent analyses.
To test the repeatability of each method, the diameters of an additional 21 vessel segments were determined, as described above, on two separate occasions.
STATISTICAL ANALYSIS
Agreement between median manual estimates of diameter and median diameters measured, from the same vessel segment, using each test method, was expressed as the mean difference in diameter (95% limits of agreement (2 × SD of the difference)) and shown graphically as Bland–Altman plots.
The repeatability of each technique was calculated as the within subject standard deviation (sw) and repeatability coefficients (2.77 × sw).
Results
DIFFERENCES BETWEEN DIAMETERS MEASURED MANUALLY IN FLUORESCEIN AND RED-FREE IMAGES
The mean (95% confidence interval) arteriolar diameter measured from fluorescein angiograms was 21.71 (20.15–23.27) pixels and from red-free images was 19.76 (18.62–20.90) pixels. The mean difference (95% limits of agreement) between the diameters of the same vessel segments measured from fluorescein and red-free images was 1.95 (−6.10–10.01) pixels. This is illustrated graphically as a Bland–Altman plot (see Fig 2).

Bland–Altman plot of differences between median manual diameter measurements from fluorescein angiograms and red-free images, plotted against the average of the two measurements. Broken lines represent the mean difference (2 SD) of the difference (95% limits of agreement).

Bland–Altman plots of differences between median manual and median Gaussian diameter measurements, plotted against the average of the two measurements. Measurements were made from the same red-free image. Broken lines represent the mean difference (2 SD) of the difference.
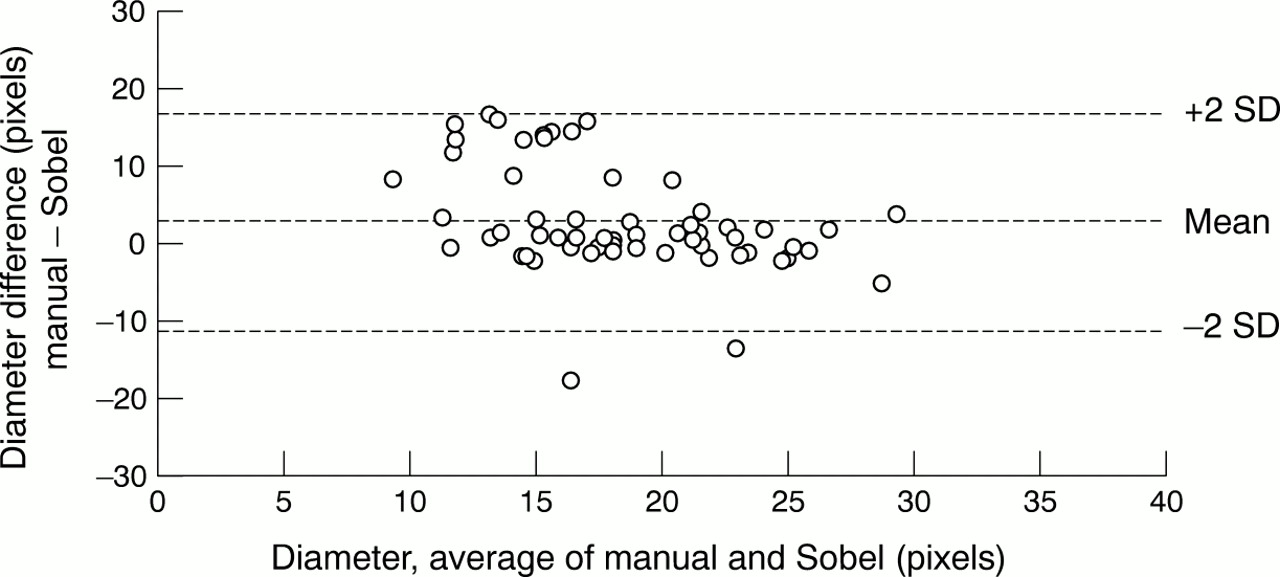
Bland–Altman plots of differences between median manual and median Sobel diameter measurements, plotted against the average of the two measurements. Measurements were made from the same red-free image. Broken lines represent the mean difference (2 SD) of the difference.
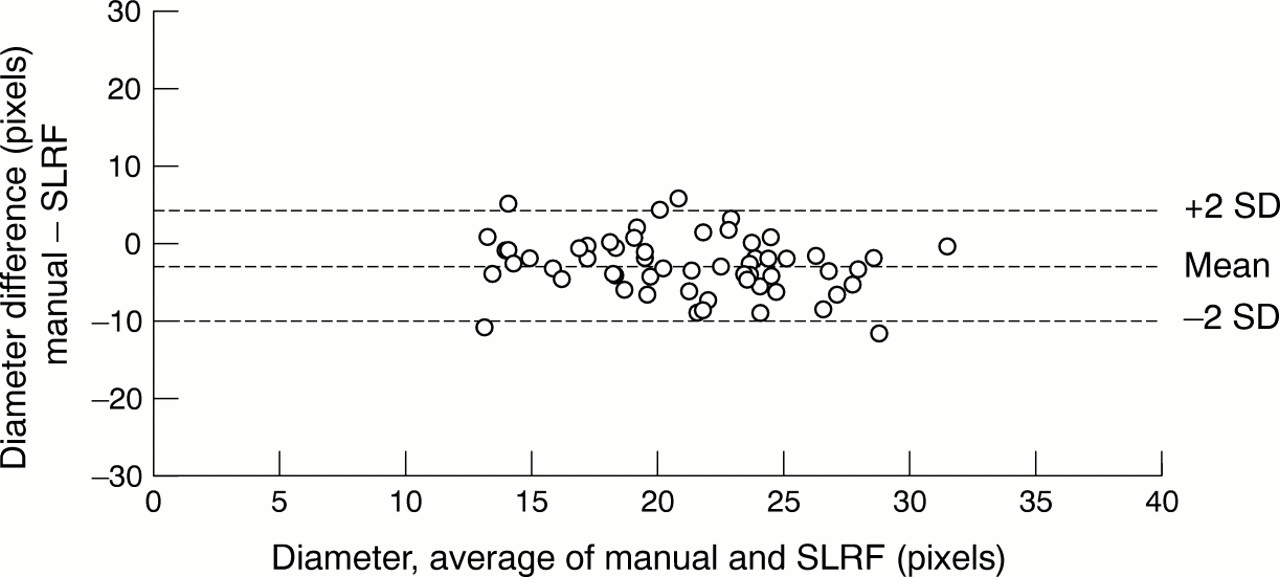
Bland–Altman plots of differences between median manual and median SLRF diameter measurements, plotted against the average of the two measurements. Measurements were made from the same red-free image. Broken lines represent the mean difference (2 SD) of the difference.
COMPARISON OF AUTOMATED AND MANUAL DIAMETER MEASUREMENTS IN RED-FREE IMAGES
The mean differences (95% limits of agreement) between the diameters measured manually and using each test method in red-free images were as follows: Gaussian 0.75 (−8.53–10.02) pixels, Sobel 2.82 (−10.85–16.49) pixels and SLRF −2.97 (−10.30–4.36) pixels. These data are illustrated graphically as Bland–Altman plots in Figures 3, 4, 5. As can be seen, in comparison with manual measurements of diameter, the Sobel method underestimated diameters, while diameters measured using SLRF were, on average, approximately 3 pixels greater than those measured manually. Of the three methods tested, the SLRF method performed best as demonstrated by the least scatter.
REPEATABILITY OF DIAMETER MEASUREMENTS IN RED-FREE IMAGES
Within subject standard deviation (sw) for median diameter determinations from red-free images performed by the same operator on two separate occasions were as follows: manual measurements 0.95 pixels, Gaussian 3.33 pixels, Sobel 1.74 pixels, and SLRF 1.40 pixels. The repeatability coefficients for each technique (2.77 × sw) were as follows: manual measurements 2.63, Gaussian 9.22, Sobel 4.82, and SLRF 3.89.
Discussion
We have described the comparison of three computer algorithms for the estimation of retinal arteriolar diameters from red-free retinal images, using manual measurements as a reference. We found that manual diameter measurements from red-free images are smaller than those from fluorescein angiograms. Of the three automated techniques, identification of vessel edge positions by means of linear regression within a sliding window filter (the SLRF method) appears to be the most consistent (defined as the method producing diameter estimations with the least scatter) and most repeatable (precise). However, diameters measured using this approach were consistently greater than those measured manually. Fitting of a double Gaussian curve to vessels was less consistent and markedly less repeatable than the SLRF method. Identification of vessel edge positions by means of Sobel edge detection masks was less repeatable than the SLRF method, and was markedly less consistent than either of the other automated methods.
A problem associated with testing new methods of retinal arteriolar diameter measurement in vivo is the absence of definitive standards or measurements with which to compare the test methods. There is no reason to assume that manual determination of vessel edges is more accurate than an automated algorithm. All automated methods of vessel width estimation from red-free images imply a scaling factor which is required to relate the measurement to the physical width of the vessel. Such scaling factors will generally differ between alternative measurement methods. The appropriate factor for a specific method can only be established given a model of the intensity profile arising from a vessel in a red-free image. Such considerations are outside the scope of the current study. The methods reported here provide width estimates which are broadly comparable with estimates obtained manually from red-free and fluorescein images, but no claim is made as to their absolute accuracy. Accordingly, systematic differences between the results from different methods can be expected, and indeed such bias is seen. The principal aim of this investigation is evaluation of the scatter of width estimates obtained from each automated method with respect to the reference method—that is, to assess the consistency of each method.
On the basis of previous studies, the diameters of retinal arterioles would be expected to be in the range 50–200 μm. However, the diameters of arterioles observed through a retinal camera will be affected by the refractive index and the distance between retina and camera lens. Absolute measures of diameter are consequently difficult to obtain. In addition, variations in diameter occur throughout the cardiac cycle. Thus, the only appropriate method of testing new measurement techniques is to compare measurements of the same vessel from an identical image. While this will make measurements more comparable, it will still fail to overcome variations caused by measurements being made at different points along an arteriolar segment, which will vary as a result of observable variations in diameter.
The automated methods tested, while operator dependent, are all faster than manual measurements of diameter. As the automated methods are less operator dependent than manual measurements, they may eliminate some, though not all, observer bias. A further drawback in comparisons between automated and manual measurements is that automated methods intrinsically make measurements to subpixel accuracy whereas manual measurements are dependent on the resolution of the display device. Thus, a systematic difference may be introduced between automated and manual measurements of the same vessel segment.
When viewed through a handheld ophthalmoscope or retinal camera, what is generally described as the retinal arteriole is actually the column of red blood cells within the vessel. The frequent presence of a brighter reflection of incident light in the centre of the vessel (central light reflex) is the likely explanation for why the Sobel technique was the least reliable method of determining vessel diameters. This technique frequently identified the central light reflex as the vessel edge, thereby underestimating the true vessel diameter.
Alterations in the prominence of the light reflex were incorporated into the early grading of hypertensive retinopathy as previously described. These early changes of hypertensive retinopathy have prognostic implications. However, the presence and degree of such changes is subjective and poorly reproducible and thus their prognostic value is weak.Fitting of a double Gaussian curve to a vessel and its associated light reflex may have the advantage of making a quantitative assessment of the light reflex more reproducible. Thus the use of the information contained within the fitted double Gaussian equation for an arteriole may prove to be have more reliable prognostic value than simple observation through an ophthalmoscope.
In contrast with observation of the cell column in retinal vessels in red-free images, fluorescein angiography delineates the plasma stream flowing through retinal blood vessels. Arteriolar blood flow is laminar, with a cell-free zone separating the central column of blood cells from the vessel wall. Consequently, measurements of arteriolar diameter from fluorescein and red-free images are not exactly comparable and, as expected, diameters measured in a similar fashion (that is, manually) from fluorescein angiograms were found to be greater than those measured from red-free images. It is unclear, however, what the relation is, if any, between the size of the vessel and the relative width of the cell-free zone and our results show no systematic differences in relation to vessel size.
Unlike fluorescein angiograms, the edges of vessels in red-free images are relatively blurred. This indistinction of vessel edges becomes increasingly obvious in vessels of narrow diameter, placing greater dependence on automated vessel width estimation algorithms. A further consideration in the measurement of diameters of red-free vessels by the SLRF method is that the method intrinsically requires a sufficient number of points within each window to calculate a reliable estimate of slope by linear regression. Experience with the method suggests that it becomes unreliable for total vessel widths of less than 10 pixels.
Defects in the photographic image such as clumping of grain in the emulsion during processing as well as defects in the optical path in the camera are also likely to become increasingly significant in smaller vessels. It is possible that interaction between the discrete emulsion grain and digitisation of images may result in additional degradation of the image. The effect of grain may be reduced by careful choice of emulsion and development techniques, or may be overcome by direct capture of digital images using charge coupled device (CCD) cameras. Investigations of the effects of development techniques, emulsions, and the use of digital techniques are ongoing.
It is hoped that the use of retinal arteriolar network analysis rather than traditional ophthalmoscopic observation will allow the detection of abnormalities in the retinal circulation at an earlier stage. We have previously shown, using manual measurement techniques, that abnormalities occur in hypertension, with age, and in men of low birth weight, all of which are conditions associated with increased morbidity and mortality from cardiovascular disease. Use of the currently tested techniques, which are faster than the previously used manual techniques, will allow the assessment of retinal vascular network geometry in larger groups of hypertensives as well as other groups known to have microvascular disease. Prospective studies are also required to test whether such changes in microvascular network geometry are associated with an adverse prognosis.
In conclusion, we have described the comparison of three computational methods for the determination of retinal arteriolar diameters from red-free retinal images. One of the three tested techniques, the sliding linear regression filter method, was found to be most consistent and repeatable. Use of a standard edge detection algorithm was less reliable owing to frequent misinterpretation of the central light reflex as the vessel edge. This is likely to become an increasing problem in more advanced hypertensive retinopathy when the light reflex becomes increasingly prominent. Measurements of vessel diameters become increasingly inaccurate when measuring smaller vessels owing to the inherent limitations of computational techniques and image resolution. The SLRF method appears to be sufficiently robust for use in clinical studies of the retinal arteriolar network geometry. Meanwhile, work is ongoing to produce a fully automated technique for determination of retinal arteriolar bifurcation geometry.
Acknowledgments
This work was supported by a grant from the Medical Research Council (UK).
EDGE IDENTIFICATION BY SLIDING LINEAR REGRESSION FILTER METHOD (SLRF)
The Sobel method, based on only 3 × 3 masks, would be expected to be less effective in identifying and positioning gradual edges such as those found in red-free images, compared with the well defined edges apparent in fluorescein images. The increased noise in red-free images also has an adverse effect. Nevertheless, detection of edges may be an appropriate approach to quantify vessel width from red-free images, and so an alternative approach has been evaluated to determine if any improvements over the Sobel method can be achieved.
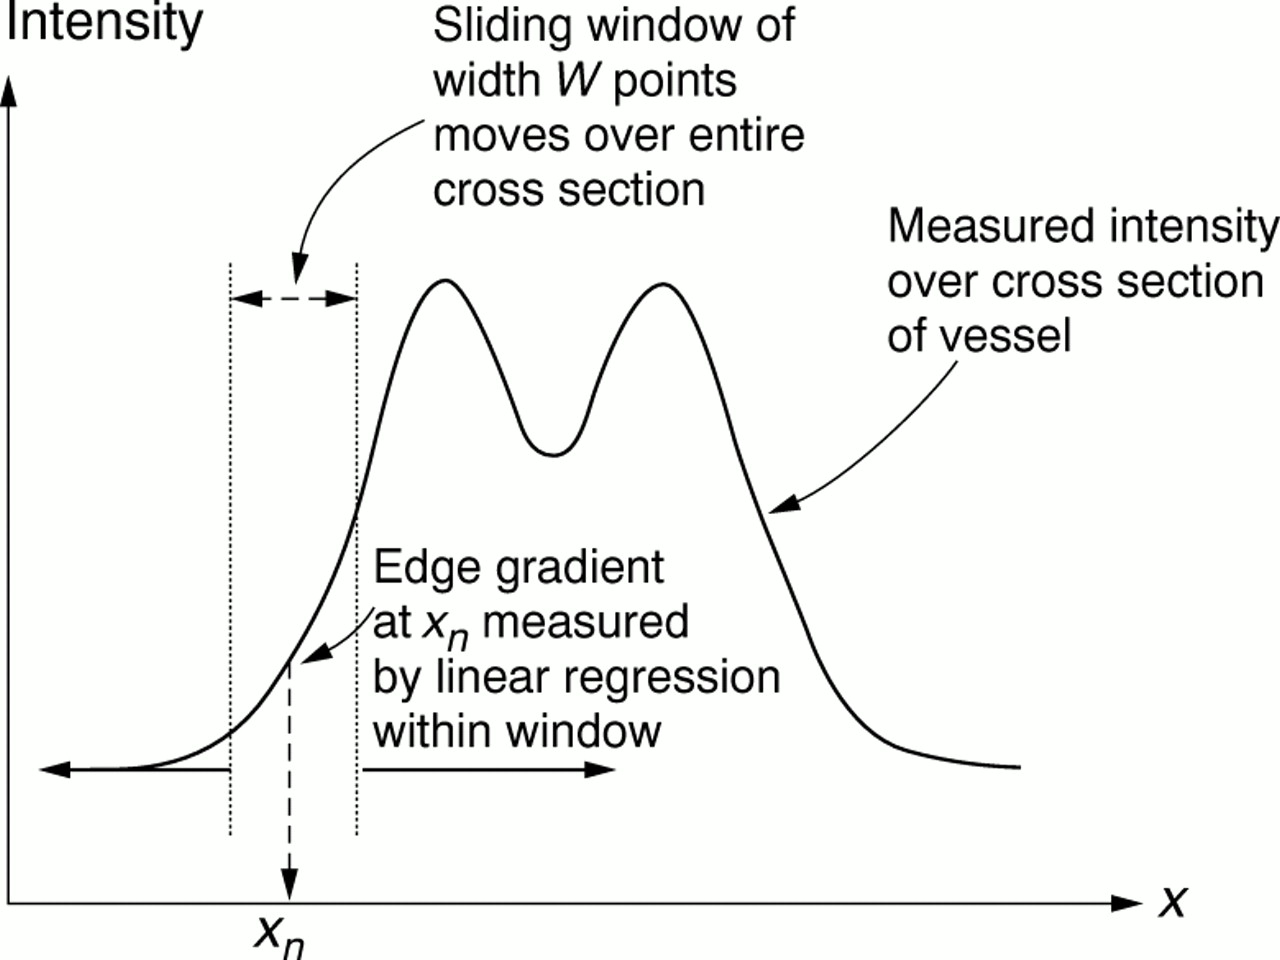
The SLRF method is based upon the fitting of a line by linear regression, relating image intensity against distance along the cross section, within a window of W points centred on the nth point. The window is progressively moved by a single point at a time across the entire cross section of interest, and the SLRF of the best least squares line recorded against the nth point asmn . This principle is illustrated in Figure 6.

The sliding linear regression filter (SLRF) method is applied to a vessel cross section as illustrated. The width of the sliding window (W) is determined by a moment calculation and the window is progressively moved across the width of the vessel. At each position of the window, the gradient of intensity change with distance is measured by a linear regression calculation.
To determine the positions of the maximum positive going and negative going slope, the resulting values of m are subject to a threshold test, and those points falling beyond a specified range are used to compute the actual position of the edge. Hence
where m max andm min are the maximum and minimum values of slope respectively, andkt is an empirically determined constant, for which a value of 0.5 has been found to yield acceptable results. The vessel width is given by the difference betweenxedge values.
A further consideration in the SLRF method is the choice of window size W. Generally, a smaller window size will give better resolution of edges of small vessels, but at the expense of less noise rejection. It may be concluded that the window size should be adapted to reflect the size of the vessel under examination. It has been found that a suitable value ofW may be derived from a calculation based on the use of the second moment, yielding an initial estimatea * 3 of parametera 3 defined by equation (1). Hence
W =kwa * 3 (3)
where kw is an empirically determined constant for which a value of 3.0 has been found to be satisfactory.