Article Text

Abstract
Background/aims: To assess the variability in retinal vessel measurements at different points in the pulse cycle.
Methods: A healthy white male aged 19 years had 30 digitised images taken at three distinct points in the pulse cycle over a one hour period. A pulse synchronised ear clip trigger device was used to capture images at the desired point in the pulse cycle. Two trained graders measured the retinal vessel diameter of one large arteriole, one large venule, one small arteriole, and one small venule 10 times in each of these 30 images.
Results: Within an image, variability was similar between graders, pulse point, and vessel type. Across images taken at the same point in the pulse period, the change from the minimum to maximum measurement was between 6% and 17% for arterioles and between 2% and 11% for venules. In addition, measurements of small vessels had greater changes than large vessels and no point in the pulse period was more variable than another. Ignoring pulse cycle increased variability across images in the large venule, but not in the other vessel types. Mixed effect models were fit for each of the vessel types to determine the greatest source of variability. Controlling for pulse point and grader, the largest source of variability for all four vessels measured was across images, accounting for more than 50% of the total variability.
Conclusion: Measurements of large retinal venules is generally less variable than measurements of other retinal vessels. After controlling for pulse point and grader, the largest source of variation is across images. Understanding the components of variability in measuring retinal vessels is important as these techniques are applied in epidemiological studies.
- retinal vessel diameters
- variation
- pulse cycle
Statistics from Altmetric.com
The retinal blood vessels are available to non-invasive visualisation, and therefore provide a unique opportunity to directly observe and study the structure of the circulation in vivo. Narrowing of the retinal arterioles is associated with ageing, hypertension, inflammation, and other processes,1–4 and has long been hypothesised to be a marker of prognosis in people with hypertension.5–7 However, narrowed retinal vessels are imprecisely defined based on a clinical ophthalmoscopic examination.8
Recent research has focused on using computer assisted methods to measure retinal vessel diameters from digitised photographic images.1,9,10 In the Atherosclerosis Risk in Communities (ARIC) study, retinal arteriolar narrowing, as defined from photographs, was found to be associated with incident coronary heart disease in women,11 and incident stroke and diabetes in men and women.12,13 These findings raise the possibility that an objective assessment of retinal vessel calibers from photographs may provide unique cardiovascular risk information in the general population.
However, quantification of retinal vessel diameters from photographs may still be imprecise. There are potentially several sources of variation. Firstly, retinal vessel diameters may change in an individual, even over a short period of time. Studies have shown that the calibre of retinal vessel changes with the pulse cycle.1,9,14–15 Therefore, taking photographs at random points in the pulse cycle may result in an unrecognised source of variation in the measurements of retinal vessel diameters between subjects and over time in the same individual. Few studies have investigated this in detail. Chen et al studied this in retinal photographs of 10 young healthy volunteers. Multiple photographs were taken at each of eight different points in the cardiac cycle synchronised via an electrocardiogram (ECG).14 The researchers found maximum changes at different points in the pulse cycle of 4.8% in a major retinal venule and 3.9% in a major retinal arteriole. They found that venular diameter was smallest in early systole, increasing to a maximum level in early diastole, and then decreasing from that point onwards. The arteriole diameter peaked slightly earlier. In another investigation of 10 volunteers, Reshef showed that a summary measure of the retinal venule diameters (central retinal vein equivalent or CRVE) and the arteriolar diameters (central retinal artery equivalent or CRAE) change at different points in the cardiac cycle.15 Across the cardiac cycle the CRVE changed by 3.1% and the CRAE changed by 4.3%. The changes followed a similar cardiac pattern to those found by Chen et al. However, Reshef’s study was small and these changes did not reach statistical significance.
Methods used to take photographs represent another source of variability. For example, if the eye was not positioned in the same location each time the photograph was taken, the retinal image could be different (images of the vessels may be captured at slightly different angles, resulting in different measurements). In Chen’s study, they found a large amount of variation between photographs taken at the same point in the pulse cycle, 2.6% in venules and 3.7% in arterioles.14 In addition, Reshef’s study also reported a large amount of variation between different photographs taken at the same point in the pulse cycle, 3.9% for CRVE and 5.6% for CRAE.15
Current methods of retinal vessel measurements rely on a fair amount of subjective human input. Thus, there are inter- and intra-grader variability in retinal vessel measurements. In the ARIC population, Couper et al studied grader variability measuring CRAE, CRVE, and the arteriole to venule ratio (AVR).16 The authors found that reliability coefficients were higher within graders than between graders. In addition, they found grader variation was smaller than variation from different photographs.
In the current study we evaluated the possible sources of variability in measuring retinal vessel diameters from photographs, controlling for different points in the pulse cycle.
METHODS
The study was done in a healthy white male aged 19 years. We used a Canon CR6-45NM fundus camera equipped with a digital Canon D-30 (3.0 mega-pixel) camera back to take 30 digital images of the right eye. A pulse synchronised ear clip trigger was used to capture images at the desired point in the pulse cycle. The photographer focused on the optic nerve, ETDRS field 1,17 and clicked the trigger. This initiated timing of the pulse cycle. Based on timing of two cycles the image was taken at a set percent delay into the cycle. Images were taken one to two minutes apart. For logistical reasons, the process of taking photographs at different points in the pulse cycle was not randomised. Instead, 10 photographs were taken in sequential order at 0%, 30%, and 70% delay into the pulse period, where 0% is at the peak of the wave at the earlobe.
Retinal vessel measurement
Two graders, trained in retinal vessel measurement techniques, measured one large retinal arteriole, one large venule, one small arteriole, and one small venule from each photographic image. Each of these four vessels in the 30 images was measured 10 times for a total of 300 measurements of each vessel for each grader. Although measurements were consecutive, systematic bias was minimised because the measurement procedure used semi-automated computer software.
The measurement procedure has been previously described.18 In brief, images were converted to an 8-bit grey scale format heavily weighting the green channel. The retinal images were displayed on 21 inch monitors set to 1600×1200 pixels. The grader selected the venule (arteriole) segment to measure in a zone between 1.0 and 1.5 disc diameters from the centre of the disc using a standard protocol. The software takes five evenly spaced, right angle measurements (in microns) of the particular segment of the vessel. The two outcomes are the mean width of these five lines and the width of the centreline. The grader can choose either outcome or repeat the measurement. The final result is a measure of the diameter of the vessel.
Statistical analysis
Methods used to assess sources of variability in retinal vessel measurement included plots, simple statistical summaries, and mixed effect models. Means and confidence intervals (CI) for the standard deviations (SD) were calculated using the following criteria: the SD for the 10 measurements within each image was computed. The 10 SD from each point in the pulse cycle were averaged and 95% CI were computed from them. All 30 images were used to get the overall mean SDs and CIs. The percent changes between images were calculated as the maximum mean measurement minus the minimum mean measurement divided by the minimum mean measurement and then converted to a percent.
Systematic differences in vessel diameter measurement had been found between the two graders (unpublished results, 2002). In addition, Chen and Reshef showed differences in vessel diameter widths between different points in the pulse cycle.14,15 Grader and pulse cycle were thus considered fixed effects in mixed effect models. The purpose of using mixed effect models was to simultaneously model these fixed effects with several sources of variability. The additional sources included the variability across images and the variability in measurements within the same image. SAS version 8.01 (Cary, NC, USA) and R version 1.5.0 (Comprehensive R Achive Network) were used to do all analyses.
RESULTS
Variation within images
Table 1 shows the variation of retinal vessel diameter measurements within an image. To assess whether the within image variation was different by vessel type, point in the pulse cycle, or grader, we stratified by these variables. The large venule had the smallest within image variability yielding an average standard deviation of 0.95 microns (μm), compared with 1.04 μm, 1.09 μm, and 1.12 μm in the small venule, large arteriole, and small arteriole, respectively. In addition, the within image variation was similar at different points in the pulse cycle and between graders. In most instances, the confidence intervals overlapped regardless of vessel type, pulse point, or grader suggesting variation within images was not significantly different. Subsequently the last row of table 1 contains an overall estimate of the within image standard deviation (SD, 1.01; 95% CI 0.96 to 1.07).
Variation within an image
Variation across images
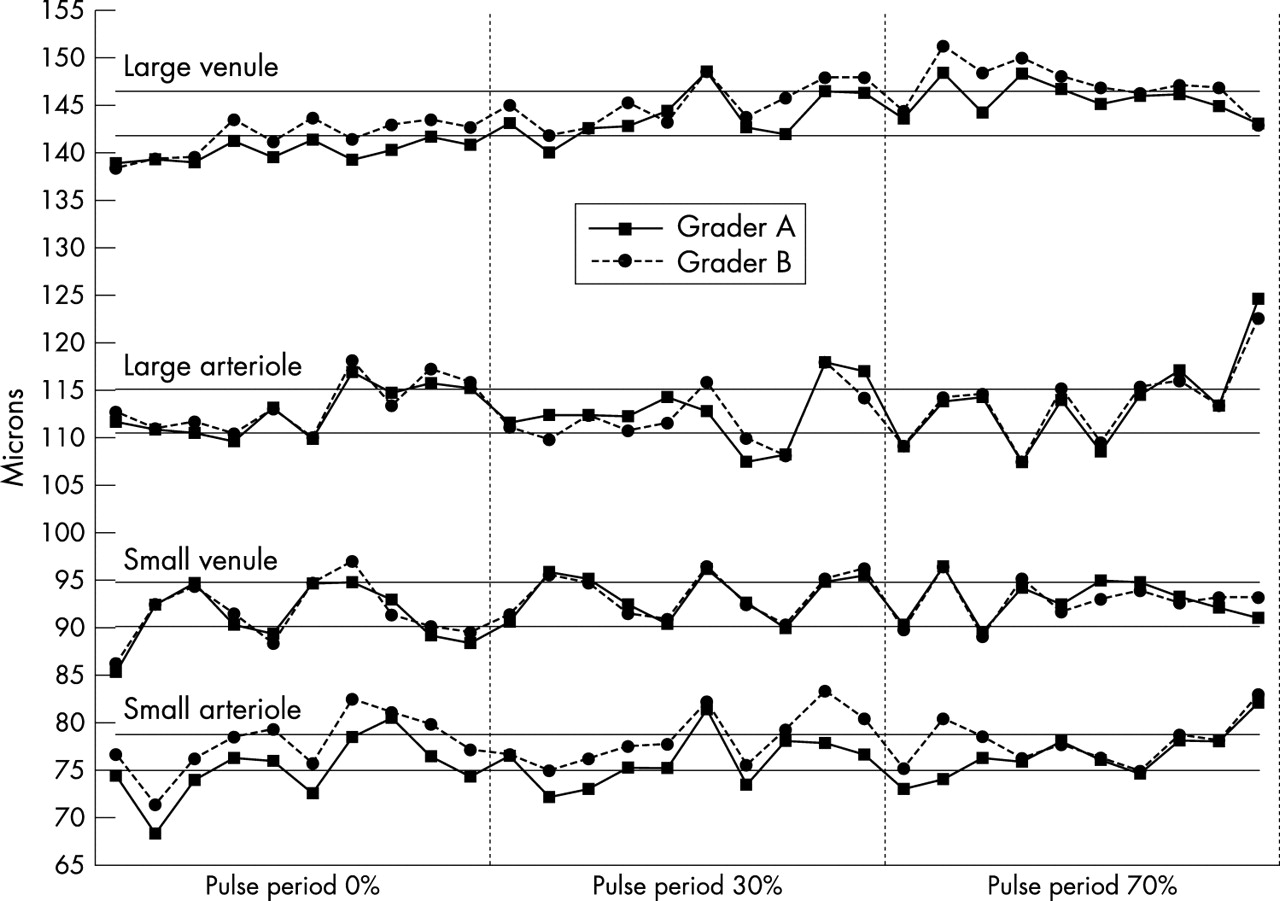
We next assessed variation across images by considering the means of the 10 individual measurements by each grader from each image (fig 1 and table 2). We first considered the variation between vessel types. Among images taken at the same point in the pulse period, the change from the minimum to maximum size was between 6% and 18% for arterioles and between 2% and 11% for venules. Small vessels had bigger changes than large vessels (table 2).
Variation across images

Mean vessel measurements of diameter for each image by grader. Each point represents the mean of 10 measurements done by each of two graders. The lines connect images taken in succession. The horizontal lines for each vessel type represent the first and third quartile of all 600 measurements.
Variation between graders across images was assessed in Figure 1 by drawing separate lines for each grader. The lines overlap well between the large arteriole and small venule, but on average grader B had higher mean measurements for the large venule (p<0.001) and the small arteriole (p<0.001).
Although differences between graders existed, the variation between graders was much smaller than that seen across images within the same point in the pulse cycle (fig 1). For example, we looked at the measurements for the small venule 0% into the pulse period: some of the images had mean diameters below the first quartile, while different images taken at the same point in the pulse period had mean diameters near the third quartile. This pattern was not restricted to vessel type or any particular point in the pulse cycle.
Further, we assessed variation between images by ignoring that images were taken at different points in the pulse cycle. Except for the large venule, the standard deviation of the mean measurement of all 30 images was not higher than when restricting to any particular point in the pulse cycle (table 2). Alternatively, the large venule had a higher standard deviation not considering the pulse point (SD = 3.0 versus 1.1, 2.5, 1.8 for ignoring pulse versus 0%, 30%, 70% delay into the pulse period, respectively). Figure 1 showed that the large venule had the smallest variability across images within any particular point in the pulse cycle and had an increasing trend from 0% to 70% delay into the pulse period (p value for difference between pulse points <0.001).
Combined sources of variability
Tables 1 and 2 address separate sources of variability (within and across image variability). To determine whether there was a difference between within and across image variation we combined these sources of variability together in mixed effect models. The sources of variability after controlling for pulse point and grader were computed for each vessel (table 3). As suspected, the largest source of variability was across images, accounting for over 50% of the total for all vessels. In addition, within an image the individual grader measurements accounted for around 20% of the total variation. This was consistent with data shown in the previous tables and figure. Image quality was also assessed, but did not change results (data not shown).
Sources of variation controlling for pulse point and grader
DISCUSSION
Our primary aim was to evaluate the sources of variability in measuring retinal vessel diameters. Previous research has shown that retinal vessel diameters change at different points in the pulse cycle. However, we found that variation across photograph images within the same point in the pulse cycle was generally too wide for us to detect differences across the pulse cycle. In addition, grader variation in measurements of each image makes differences between pulse measurements smaller than 2 μm difficult to detect. Thus, these two sources of variation reduce any effect pulse point may have on the measurements of retinal vessel diameters using the methodology employed in this study.
Grader measurement and photograph variation were small for the large venule compared with the other three vessels measured in this study. Thus, we were able to detect a pulse effect in the large venule. We found that the large venule had the smallest diameter when the pulse is at the peak of the pressure wave at the earlobe and increases in diameter at the other two points measured. Several reasons may explain why both within and across photograph variation was lower in the large venule. Firstly, the contrast between large vessels and the background retina is greater than the contrast between smaller vessels and the background retina. Secondly, venules are easier to measure than arterioles because they are more distinct on retinal photographs. The combination of these two factors makes photographing and measuring large venules the most precise.
It was also possible that we did not detect differences in vessel diameter because of the points in the pulse cycle chosen for analysis. In the Chen and Reshef studies, both arterioles and venules had their smallest diameter about 1/8 into the cardiac cycle (0/8 representing the peak of the R wave).14,15 Arteriole diameter peaked slightly earlier (3/8 into the cardiac cycle) than venule diameter (5/8 into the cardiac cycle). We estimated that the peak of the pulse wave at the ear lobe occurred 37% into the current cardiac cycle (starting at the peak of the R wave) as measured on an ECG between left and right index fingers. According to Chen and Reshef’s studies, the points we chose correspond to a wide range of vessel diameters.
The largest source of variation we found was across photograph images. Some variation could be expected biologically, for example, because of differences in respiration and vessel oxygen content, posture, and blood pressure changes. The photography process was also likely to have an impact on these changes. For example, if the eye was not positioned in the same location each time the photograph was taken, the image could be different—for example, images of the vessels may be captured at slightly different angles, resulting in different measurements.
The photograph quality was another factor. Overall photograph quality in this experiment was judged to be good and so as a variable in the mixed effect model it provided little information in explaining variability in measures of vascular diameter. Therefore our graded measure of photograph quality was not sensitive enough to detect subtle measures of image quality that were having an influence on our measures. Poor photograph quality could make the vessel diameter look bigger (or smaller) with the walls of the vessel difficult to detect, introducing further variability.
Our study included a single eye from one young healthy volunteer, and did not evaluate whether the pulse cycle may affect individuals differently. Age, race, gender, blood pressure, diabetes status, and intraocular pressure are known to affect vascular flow in the retina and elsewhere.1–4,19,20 Despite these limitations, our data may have important clinical implications. Reduced retinal arteriolar calibre may be a marker of systemic arteriolar diseases.1–7 A common way of summarising the retinal vessel measurements is to calculate the arteriole to venule ratio (AVR). In the ARIC study, AVR was found to be predictive of coronary heart disease in women and incident stroke and diabetes in men and women, independent of blood pressure and other traditional risk factors.11–13 In the ARIC study the retinal measurements were graded from a retinal photograph taken at a single and random point in the pulse cycle. Although variability from the pulse cycle exists, it occurs at random in the same way in all participants (with or without disease) in the ARIC study, thus this variation would not bias the relationship assessed substantially.
The significance of changes in vessel size over multiple visits has yet to be assessed. We have only shown that the point in the pulse cycle had a significant difference in measuring the larger of the two venules. In future studies where photographs are compared over time, controlling for pulse cycle may eliminate one source of variation. Despite this, the effect of pulse is smaller than the variation across the photograph images, so methods to reduce this variability are needed.
In summary, a small difference in vessel measurements across the pulse period was detected in the larger of the two retinal venules but not in any of the other three vessels measured. The larger amount of variation across photographs made pulse cycle differences difficult to detect. Based on these findings, we postulate that taking one photograph at random in the pulse cycle, as done in previous large population based epidemiological studies such as the ARIC Study and the Cardiovascular Health Study (CHS), may tend to bias the associations found to the null because of the random variability found.2,4,11–13 While timing the photographs to one point in the cycle might reduce some of this variability, of greater concern is the need to improve photograph quality. The implications of variability in retinal vascular measures due to photographs taken at different points in the pulse cycle in a longitudinal study will need to be carefully studied.
Acknowledgments
We would like to thank all others involved in this project including Michael Neider, Katie Nigl, Karl Jensen, and Daniel Yee. This study was supported by NIH grants EYO6594 (Klein R, Klein BEK) and HL66018 (Klein R, Wong TY).