Article Text

Abstract
Aim: The aim of this study was to establish the functional significance of annular macular abnormalities present on fundus autofluorescence imaging (AF) in patients with cone or cone–rod dystrophy.
Methods: Fundus AF was performed on ten subjects (age range 18–82 years) with cone or cone–rod dystrophy consequent upon RPGR or RIMS1 mutation. International-standard full-field and pattern electroretinograms (ERGs) were performed in all cases. Photopic and scotopic fine matrix mapping (FMM) and multifocal ERG were performed on selected cases.
Results: Subjects had annuli of high density AF that bordered central areas of low density in older RPGR cases and most RIMS1 cases. The size of the AF ring correlated with age and enlarged with time in two subjects. High-density rings were associated with a gradient of scotopic and photopic sensitivity loss. Pattern electroretinogram (PERG) P50 amplitude, when detectable, was inversely related to the size of the AF ring. Multifocal ERGs in two subjects showed widespread reduction with relative sparing over the foveal area, in keeping with FMM data.
Conclusions: Some patients with cone–rod dystrophy have a parafoveal ring of increased autofluorescence that may enlarge with time. Increased autofluorescence is associated with reduced rod and cone sensitivity, rather than photoreceptor cell death, and AF imaging may help identify viable areas of retina amenable to future therapeutic intervention.
Statistics from Altmetric.com
Autofluorescence imaging (AF) is a non-invasive method of visualising the distribution of lipofuscin across the posterior pole.1 2 Lipofuscin is derived from the life-long shedding and subsequent degradation of photoreceptor outer segments and normally accumulates in the retinal pigment epithelium (RPE) with age.3 4 An abnormal increase or depletion of lipofuscin manifests as high- or low-density areas, respectively, in AF images, and such changes may aid the detection and characterisation of a wide range of inherited retinal disorders, either by accentuating the fundus abnormalities or revealing changes not identified by other techniques.5–11 Previous studies on patients with retinitis pigmentosa (RP; rod–cone dystrophy) and good visual acuity have revealed a common AF abnormality in the form of a parafoveal ring of high density that varies in size, and that encircles areas of preserved photopic function.12–16 The ring of high density is not genotype-specific and has been described in dominant, recessive and syndromic RP. A similar annular distribution of high-density AF has recently been described in other disorders including two groups of patients who manifest cone or cone–rod dystrophy consequent upon mutation in RIMS117 or RPGR ORF15.18 In keeping with other forms of cone–rod dystrophy, these patients typically present with reduced central vision, photophobia and reduced colour vision, but the significance of AF abnormalities in these disorders has not previously been ascertained.
Fine matrix mapping (FMM) is a psychophysical technique that has proved useful in the assessment of photopic and scotopic sensitivity in a variety of retinal disorders.13 14 19–23 Pattern electroretinograms (ERGs) and multifocal ERGs (mfERGs) are established objective measures of central cone system function that have been used widely in studies of central retinal function.24 25 The current study uses these psychophysical and electrophysiological measures of macular cone and rod system function in patients with RPGR ORF15 and RIMS1 mutations. The results are compared with those of AF imaging in order to assess the significance of AF abnormalities and to refine the functional phenotype.
METHODS
The tenets of the declaration of Helsinki were followed and local ethics committee approval was obtained. The main genetic and clinical features of patients with cone or cone–rod dystrophy consequent upon mutation in RPGR or RIMS1 have been presented in two previous studies.17 18 A cohort of ten patients underwent additional detailed psychophysical assessment as part of the current study. Six patients were from a single pedigree with a dominantly inherited mutation of RIMS1 (also known as CORD7). Four patients were from two pedigrees with X-linked disease consequent upon mutation in RPGR ORF15 (also known as CORDX1). Patients were aged between 18 and 82 years with a mean age of 43 years and a median age of 48 years. All patients underwent AF according to previously described techniques.1 26
Full-field ERG testing was performed in all subjects using protocols that exceeded the International Society for Clinical Electrophysiology of Violon (ISCEV) minimum standard.27 Additional ERG recordings included a dark-adapted response to a bright white flash (0.6 log units greater than the ISCEV standard flash) to demonstrate better the ERG a-wave. The pupils of all subjects were dilated before full-field ERG testing using phenylephrine (2.5%) and/or tropicamide (1%). Gold-foil corneal recording electrodes were used. Pattern ERGs evoked by high-contrast checkerboard reversal were recorded without mydriasis and with optimal refraction according to ISCEV recommendations using standard parameters.28 The pattern ERG (PERG) P50 component was used as an index of macular function.24
MfERGs were performed using an array of 61 hexagonal stimulus elements (RETiscan System; Roland Consult, Wiesbaden, Germany) subtending a maximum visual angle of 57° and recorded using gold-foil corneal electrodes after mydriasis. The viewing distance was 33 cm with additional refraction appropriate for viewing distance. Four radially orientated cross-hairs aided fixation and responses were recorded binocularly. Detailed methods have been previously described.29
Photopic FMM was performed according to previously described techniques19–23 and values were compared with normative data, obtained from 14 healthy subjects aged between 25 years and 60 years (mean age 45 years; median age 48 years). In brief, photopic sensitivity was tested at 1° intervals within a 9×9° area. Subjects signalled detection thresholds using a push-button control. The matrix was positioned over the retinal area of interest, usually covering areas of abnormal autofluorescence, and aligned according to the position of the blind spot. Sensitivities were shown as contour plots, illustrating the position and orientation of test matrices, and as three-dimensional threshold profiles plotted using interpolated values at 0.25° intervals, obtained by Gaussian filtering. Scotopic FMM was performed over identical retinal locations following pupil dilation (tropicamide 1%) and 40 min dark adaptation. Fixation was monitored continuously. Normal threshold profiles were subtracted from those of the patients.
RESULTS
Patients
All patients had a diagnosis of cone or cone–rod dystrophy consequent upon mutation in RIMS1 or RPGR. Detailed symptoms and signs have been previously described;17 18 the main clinical features in the cohort of ten patients included in the current study have been summarised and updated (table 1).
Electrophysiology
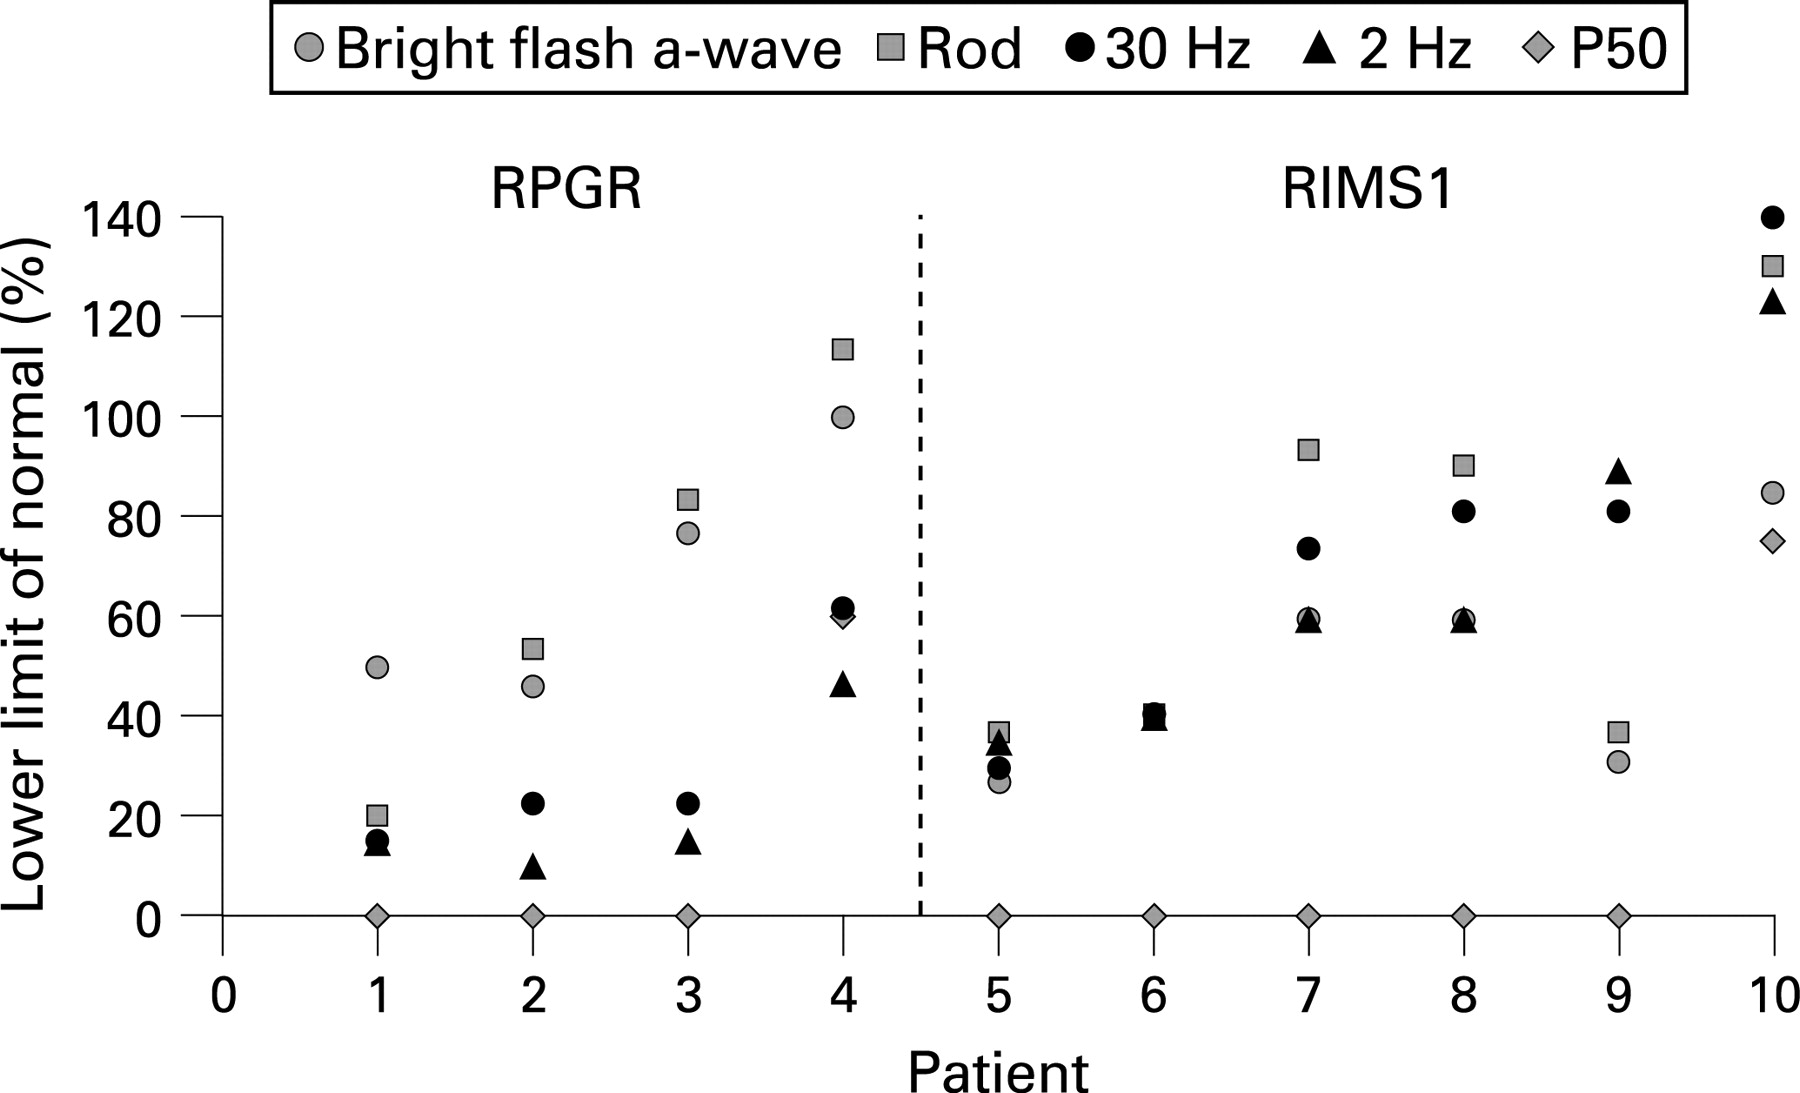
The main full-field ERG and pattern ERG findings are described below and summarised in fig 1. Three brothers with RPGR mutations had full-field ERGs consistent with generalised dysfunction affecting cone more than rod systems (fig 1, cases 1, 2, 3) and in a different pedigree with a different RPGR mutation (table 1) one subject had ERGs consistent with generalised dysfunction confined to the cone system (fig 1, case 4). Delays in the 30 Hz flicker ERGs were moderately severe (9–13 ms) in cases 1–3; no delay was present in case 4. The phenotype in RIMS1 subjects was more variable and included four cases with a similar degree of cone and rod system involvement (fig 1, cases 5–8) and two cases with full-field ERG evidence of predominant rod-system involvement (cases 9 and 10). Flicker ERGs were of normal timing except in case 9 (mild delay of 3 ms). The diagnosis of cone–rod dystrophy was based upon macular dysfunction in subjects with full-field ERG evidence of equal or predominant rod system involvement.

Pattern ERGs were undetectable in eight of ten cases consistent with severe macular cone system involvement. In the two youngest subjects, with the smallest parafoveal rings (subjects 4 (RPGR) and 10 (RIMS1)), pattern ERG P50 was subnormal consistent with significant but mild macular involvement (fig 1). Ring size showed positive correlation with full-field ERG indices of generalised rod function (scotopic bright flash ERG a-wave amplitude, r = 0.81, p<0.0025; rod ERG amplitude, r = 0.76, p<0.01), but did not correlate significantly with cone-mediated full-field ERG parameters (30 Hz ERG, r = 0.38, p<0.15; transient photopic ERG b-wave, r = 0.25, p>0.25). MfERGs, performed in three of the RPGR subjects (fig 2), showed widespread reduction in all three with a relatively spared central response in cases 3 and 4 (fig 2C, D).

Fundus autofluorescence
An example of a normal fundus AF is shown in fig 2. High-density rings of AF were present in all subjects with cone or cone–rod dystrophy. The internal radius of the high-density rings of AF varied between approximately 1.5 and 7° and there was a high degree of inter-ocular symmetry (r2 = 0.99). Ring radius showed positive correlation with increasing age (r2 = 0.63).
The AF abnormalities in the RPGR cases were typically characterised by high-density rings that encircled relatively preserved AF (fig 4). Highly localised low-density AF was seen at the fovea in all cases, possibly explained by normally occurring luteal pigment (see below).

In all RIMS1 patients, other than the youngest (case 10), high-density rings encircled areas of abnormal low density AF (fig 5). One subject had a roughly concentric inner ring of disrupted AF with patchy, low-density foci, surrounding a central island of preserved AF (case 8). The largest area of central atrophy was seen in the oldest subject (case 6).

Three patients (cases 2, 3 and 9) underwent repeat AF imaging on routine follow-up; over a 20-month period the high-density rings showed expansion in two of these cases (fig 6).

Fine matrix mapping
Normal subjects
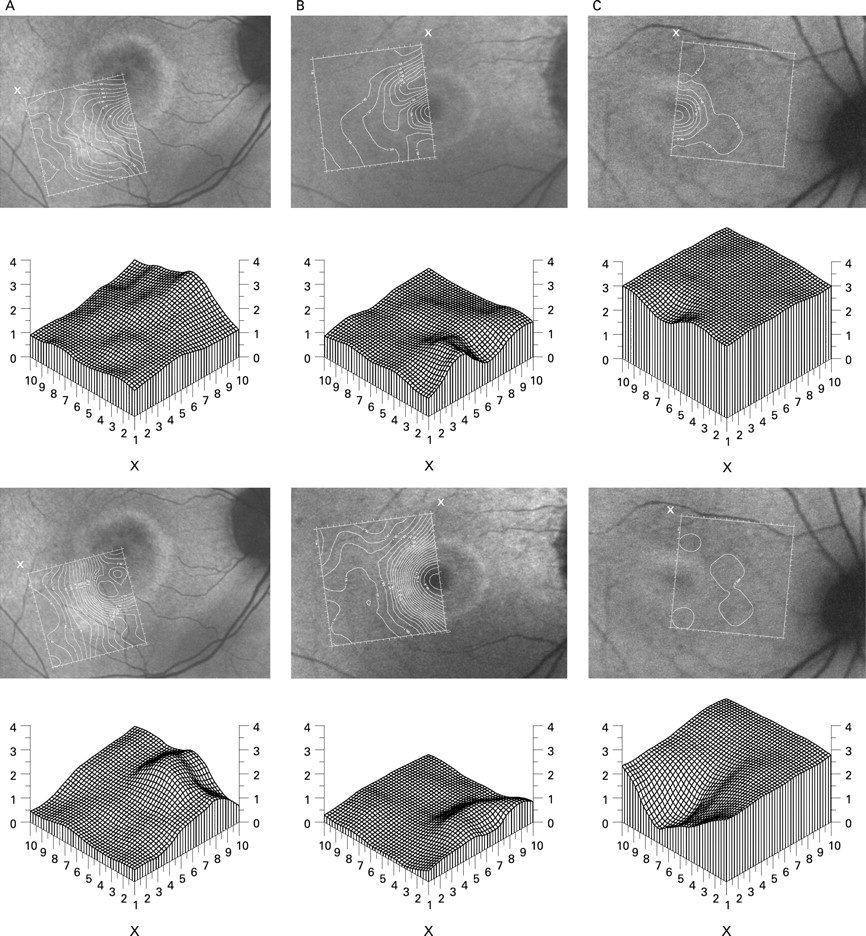
Figure 3 shows examples of contour plots obtained in a typical normal subject at central (A and B) and paracentral (C and D) retinal locations under photopic (A and C) and scotopic (B and D) conditions. Three-dimensional threshold plots show mean threshold values obtained at corresponding retinal locations under photopic (14 subjects) and dark-adapted scotopic (12 subjects) conditions. The age range of the 14 subjects was 21–57 years with a mean age of 33 years and a median age of 31.5 years. Mean threshold values and standard deviations for selected retinal locations are shown in table 2. Additional normative data were obtained at two paracentral retinal locations in a 22-year-old and at five paracentral locations in a 55-year-old subject to allow age-matched comparison with corresponding areas tested in the patient cohort (see below).

Fine matrix mapping in RPGR patients
Three RPGR subjects completed FMM, including two siblings from the same pedigree. In the two brothers (cases 2 and 3, fig 4A, B), photopic thresholds at the fovea were elevated by 1–1.5 log units (2–4 SDs). Over the parafovea, there was a gradient of decreasing sensitivity with maximum photopic and scotopic threshold elevation bordering the internal edge of the arc of high density. Scotopic sensitivity reductions were milder than photopic losses by approximately 0.5 log units over eccentric locations.
In subject 4, with full-field ERG abnormalities confined to the cone system (fig 1), photopic thresholds were severely elevated with only relative sparing of photopic sensitivity at the fovea, (fig 4C, case 4) consistent with relative preservation of the PERG (fig 1, case 4) and the central mfERG (fig 2D). Scotopic thresholds were severely elevated over the whole of the area tested.
Fine matrix mapping in RIMS1 patients
Four subjects were able to complete FMM. Of those tested, the youngest, asymptomatic proband (case 10, age 18 years), had a small parafoveal high-density ring, spatially concordant with an annular area over which photopic thresholds were elevated by about 0.15 log units (fig 5A). Scotopic thresholds showed greater elevation (by approximately 1 log unit or 2.2 SDs over paracentral areas) and were spatially more extensive. This subject had a mildly reduced PERG P50, in keeping with mild sub-clinical macular dysfunction, and full field ERGs consistent with mild generalised rod photoreceptor dysfunction (fig 1, case 10). The father of subject 10 (fig 5B, case 8), showed severe sensitivity losses under photopic and scotopic conditions that were associated with a parafoveal annular area of patchy low-density AF that was bordered externally by a concentric ring of high density. Relative sparing of photopic sensitivity was seen over an island of preserved foveal AF (threshold elevation <6 SDs). Subject 9 (the uncle of the proband) showed severe photopic sensitivity losses over atrophic central areas with relatively preserved sensitivity external to the ring of high density (fig 5C); the area of severe scotopic sensitivity loss extended over a larger area and was more severe. The paternal grandmother of the proband manifested a well-circumscribed atrophic area of low density AF over which sensitivity losses were severe (fig 5D, case 6).
DISCUSSION
The cone–rod dystrophies consequent upon mutations in either RIMS1 (autosomal dominant) or RPGR (X-linked) are characterised by photophobia, dyschromatopsia, progressive deterioration in visual acuity and night vision and peripheral field abnormalities that tend to manifest later in RPGR than in RIMS1 cases.17 18 Ophthalmoscopic abnormalities, when present, are generally confined to the macula. Annular high-density AF abnormalities in both RPGR and RIMS1 may be associated with affected status in cases with normal or mildly impaired visual acuity and normal or mildly abnormal fundi (table 1, cases 3 and 10). The current study compares objective electrophysiological and psychophysical measures of rod and cone sensitivity with AF imaging and establishes that the AF abnormalities are spatially concordant with changes in retinal sensitivity and are likely to represent evolving RPE disturbance at the macula associated with progressive retinal dysfunction.
The annular AF abnormality is not unique to RPGR and RIMS1 cases. Similar AF abnormalities have been reported in a number of other conditions including autosomal dominant and recessive rod–cone dystrophy (see below),12–16 Bull’s eye maculopathy,8 Leber congenital amaurosis,30 X-linked retinoschisis,31 Best macular dystrophy11, and forms of autosomal dominant cone and cone–rod dystrophy consequent upon mutation in GUCY2D32 or GUCA1A.33 The AF abnormality is a non-specific manifestation suggesting increased metabolic load at an intermediate stage before cell loss and atrophy.1 2 13
The size of the AF ring is related to age in both RPGR and RIMS1 subjects, suggesting that ring size may increase with time. Extensive longitudinal studies have yet to be performed but serial imaging of two patients showed, for the first time, evidence of progressive ring expansion (fig 6A and 6C). Subsequently, central or concentric areas of irregular atrophy may occur within the ring with loss of lipofuscin and AF (fig 6A). Areas of low-density AF may eventually coalesce, forming a confluent central atrophic lesion within the ring. It is tempting to speculate that similar ring expansion may occur in other cone–rod and macular dystrophies. The ring expansion contrasts with the evolution of annular AF abnormalities in patients with RP and normal visual acuity. Those patients manifest a ring that encircles central areas of normal photopic macular function that constricts with time15 and which is likely to represent progressive RPE disturbance secondary to photoreceptor dysfunction. Pattern ERG P50 amplitude in those RP cases is proportional to the radius of the ring.12 14 16 Perhaps not surprisingly, PERG P50 was inversely related to ring size in the few RPGR and RIMS1 patients with a detectable response (fig 1). Multifocal ERGs were consistent with the PERG and FMM findings, showing widespread dysfunction over the posterior pole (mfERG array 57°) but with relative sparing of central macular function in some cases.
The ring may be a result of rod-system dysfunction, consistent with the parafoveal distribution of rod photoreceptors and the low density of cones outside the fovea34–36 and in keeping with the role of rod outer segment shedding in the deposition of lipofuscin.3 37 This is also consistent with macular sensitivity losses in RIMS1, that in most cases were more severe and spatially extensive under scotopic than photopic conditions (fig 5), as in other retinal disorders that manifest high density AF abnormalities.13 14 22 In RPGR cases scotopic thresholds sometimes matched those at which cones mediate detection,14 thereby confounding direct comparison, or showed similar or slightly greater elevation under photopic conditions. However, it is interesting to note that only rod-mediated full-field ERGs correlated with ring size. The origins and nature of the AF ring warrant further investigation.
It is widely reported that high-density AF precedes cell loss in many retinal disorders. Retained levels of autofluorescence, seen in younger patients within the high-density ring and in all cases outside the ring, suggests continuing metabolic demand from photoreceptors that are intact but dysfunctional. An important implication is that such cells may be amenable to functional rescue in contrast with low-density areas where cell death may already have occurred. FMM indicates that photopic sensitivity at the fovea may be relatively preserved in the presence of low density AF in some cases (fig 4A, 4B and 4C). A possible explanation is that the foveal hypofluorescence may represent absorption of the incident 488 nm radiation by dense luteal pigment. Several studies have used the fundus AF imaging technique to quantify macular pigment objectively and have shown high optical density at the fovea in many individuals.26 38–40 There may also be less underlying autofluorescence at the fovea.36 The absorption spectrum of luteal pigment is maximum at about 460 nm and the use of alternative longer wavelengths, within the broad excitation spectrum of lipofuscin, may prove useful in differentiating between pigment absorption and atrophy.41
FMM enables high spatial resolution assessment of macular function but like the pattern ERG and multifocal ERG, requires good fixation. Only three patients were unable to perform FMM due to fixation problems. Accuracy of fixation was not quantified, but patients were monitored continuously throughout testing via an infrared camera and adequate fixation was noted and recorded during testing. The current study demonstrates that detailed assessment of macular function may be possible in the absence of good acuity providing fixation is carefully monitored. FMM, mfERG and PERGs were informative in those able to comply with testing and provided unique insight into the nature of the AF abnormalities.
PERGs, mfERGs and photopic FMM were abnormal in all affected patients that were tested, in keeping with macular cone system dysfunction. Scotopic FMM provided the only measure of macular rod function. It is notable that one patient with normal rod-mediated full-field ERGs and a diagnosis of cone dystrophy (case 4) had evidence of severely reduced scotopic sensitivity across the central macula (fig 4C). Accurate functional phenotyping may require assessment of macular rod system function, often overlooked in attempts to establish phenotype–genotype correlations.
Some patients with cone–rod dystrophy have a parafoveal ring of increased autofluorescence that may be an early manifestation of macular involvement and that may enlarge with time. Increased autofluorescence is associated with reduced rod and cone sensitivity rather than photoreceptor cell death, and AF imaging may help identify viable areas of retina amenable to future therapeutic intervention. The study establishes the nature of the relationship between increased AF and retinal dysfunction in subjects with cone or cone–rod dystrophy consequent upon specific mutations and further refines the functional phenotype in these disorders.
Acknowledgments
Foundation Fighting Blindness (A G Robson, A T Moore, A R Webster), Guide Dogs for the Blind (M Michaelides, A T Moore), British Retinitis Pigmentosa Society (A T Moore, A R Webster). EUFP6 EVI Genoret (A T Moore). We are grateful to A J Hardcastle and D M Hunt.
REFERENCES
Footnotes
Competing interests: None declared.