Article Text

Abstract
AIMS/BACKGROUND Recently a commercially available scanning laser Doppler flowmeter has been produced, which provides two dimensional maps of the retinal perfusion. The aim of the present study was to investigate the reproducibility and the sensitivity of these measurements.
METHODS 16 healthy subjects were randomised to inhale different gas mixtures of oxygen and nitrogen in a double blind crossover study. The following gas mixtures of oxygen and nitrogen were administered: 100% oxygen + 0% nitrogen, 80% oxygen + 20% nitrogen, 60% oxygen + 40% nitrogen, 40% oxygen + 60% nitrogen, 30% oxygen + 70% nitrogen, 20% oxygen + 80% nitrogen, 15% oxygen + 85% nitrogen, and 10% oxygen + 90% nitrogen. Retinal haemodynamic variables and systemic haemodynamics were measured during all inhalation periods. Recordings under resting conditions were performed three times to calculate intraclass coefficients.
RESULTS In two subjects we did not obtain technically adequate results. A dose dependent change in retinal blood flow during graded oxygen breathing was observed (p < 0.001). During 100% oxygen breathing blood flow decrease was between 29% and 33%, whereas blood flow increase was between 28% and 33% during inhalation of 10% oxygen + 90% nitrogen.
CONCLUSIONS Scanning laser Doppler flowmetry has an acceptable reproducibility and is appropriate for description of the effect of graded changes in Po 2 on retinal haemodynamics. The main problems with the system are the large zero offset, the fixation during retinal scanning, and the neglect of blood flow changes during the cardiac cycle.
- laser Doppler flowmetry
- retinal blood flow
- hyperoxia
- hypoxia
Statistics from Altmetric.com
Laser Doppler light scattering has been used to study blood flow in large retinal vessels1-3 as well as blood flow in vascularised ocular tissue.4-7 Recently, a commercially available scanning laser Doppler flowmeter (Heidelberg retina flowmeter, HRF, Heidelberg Engineering, Heidelberg, Germany) has been produced.8 9 This system combines laser Doppler flowmetry with laser scanning tomography. Therefore, a two dimensional mapping of the optical Doppler shift can be recorded.
Several authors have investigated the reproducibility and validity of this method for quantification of ocular microcirculation. Michelson and coworkers reported reliability coefficients between 0.81 and 0.85 for both short term and long term variability.8-10 The validity of measurements with the scanning laser Doppler flowmeter for retinal blood flow assessments was compared with a single point laser flowmeter.10 Correlation coefficients between 0.51 and 0.83 were reported for the readings obtained with the two instruments.
However, the suitability of a method for characterisation of pharmacological treatment effects is determined mainly by its sensitivity to detect changes in blood flow. Stimuli known to provoke pronounced changes in retinal blood flow, such as carbogen and oxygen breathing or increase in intraocular pressure, caused significant changes in scanning laser Doppler flowmeter variables.11 On the other hand, it has been reported that quantitative measurements with the HRF are limited by the large zero offset, which cannot be determined in vivo.12 This argues that the relation between microvascular blood flow and HRF readings might not be linear and could therefore limit the use of the instrument in pharmacodynamic studies.
It is well known that retinal blood flow strongly depends on arterial partial pressure of oxygen (Po 2).13 We therefore investigated the effect of different degrees of hypoxia and hyperoxia on HRF variables and assessed the sensitivity to detect haemodynamic changes during these conditions.
Methods
SUBJECTS
The study protocol has been approved by the ethics committee of Vienna University School of Medicine and written informed consent was obtained by all subjects. Sixteen healthy, non-smoking, drug free volunteers (nine male, seven female) aged between 23 and 35 years (mean 28.6 (SD 3.2) years) were studied. Each subject passed an ophthalmic examination, including slit-lamp biomicroscopy and indirect funduscopy. All subjects included had normal ophthalmic findings with ametropy less than 5 dioptres.
STUDY PROTOCOL
On the trial day the subjects were randomised to inhale different gas mixtures of oxygen and nitrogen in a double blind crossover design. The following gas mixtures of oxygen and nitrogen were administered: 100% oxygen + 0% nitrogen, 80% oxygen + 20% nitrogen, 60% oxygen + 40% nitrogen, 40% oxygen + 60% nitrogen, 30% oxygen + 70% nitrogen, 20% oxygen + 80% nitrogen, 15% oxygen + 85% nitrogen, and 10% oxygen + 90% nitrogen. Balanced randomisation was used to ensure that groups of two of the 16 subjects received one of the above treatments first. All gases were delivered through a partially expanded reservoir bag at atmospheric pressure under nasal occlusion.
All subjects were asked to refrain from alcohol and caffeine for at least 12 hours before trial days. After a 20 minute resting period in a sitting position, baseline measurements of laser Doppler flowmetry and systemic haemodynamics were performed. Thereafter, a 10 minute breathing period of the first gas mixture was started. Measurements were obtained during the last 3 minutes of each breathing period. Subjects subsequently crossed over to the next treatment, where measurements were performed in an identical fashion. Washout periods between consecutive inhalation sessions were 10 minutes. After four inhalation sessions and at the end of the study measurements were again performed under resting conditions. These readings, together with the baseline recordings, were taken to calculate short term variability of measurements.
STUDY METHODS
The principles of laser Doppler flowmetry have been described in detail by Bonner and Nossal.14 Briefly the vascularised tissue is illuminated by coherent laser light. Scattering on moving red blood cells (RBCs) leads to a frequency shift in the scattered light. In contrast, static scatterers in tissue do not change light frequency but lead to randomisation of light directions impinging on RBCs. This light diffusing in vascularised tissue leads to a broadening of the spectrum of scattered light (Doppler shift power spectrum, DSPS).
From this DSPS the mean RBC velocity (vel), the blood volume (vol), and the blood flow (flow) can be calculated in relative units.14 These variables are calculated from the backscattered light for each point during the scanning process. The procedure of data sampling and the confocal optical system are described in detail by Michelson et al.8 10The line sample frequency is 4000 Hz and frequencies of less than 125 Hz are excluded for fast Fourier transform.
From the calculated RBC velocity, the blood volume, and the blood flow a two dimensional map of retinal perfusion is created. Hence, these variables can be quantified in relative units for any image point. In the present study three 20 × 20 pixel areas were chosen for calculation of haemodynamic variables (200 × 200 μm). Two recordings were taken at each time point and the mean of the two values was used for analysis. One area was located temporally to the centre of the macula. Care was taken that this region did not overlap with the avascular retinal zone. However, the 20 × 20 pixel area was set as close to the margin of the avascular zone as possible. The second area was located approximately 5 degrees nasal and the third area approximately 5 degrees temporal to the centre of the macula. The measurements were performed in regions without major surface vessels.
Systolic and diastolic blood pressures (SBP, DBP) and pulse rate were measured by an automated oscillometric device (Siemens Sirecust 888R, Siemens, Erlangen, Germany).
STATISTICAL ANALYSIS
Statistical analysis was done using the statisticasoftware package (Release 4.5, StatSoft Inc, Tulsa, OK, USA). To quantify the short term variability of the measurements, intraclass correlation coefficients (κ) for velocity, volume, and flow were calculated in the three areas under study from the three recordings under air breathing. κ was calculated according to Kramer and Feinstein,15 based on a repeated measure ANOVA model. κ can then be calculated from the variance among subjects (vs), the variance among methods (vm), and the residual error variance (ve):
The higher the intraclass correlation coefficients the better the reproducibility of the method. A κ of 1 reflects perfect reproducibility. The intraclass correlation coefficient is a generally accepted measure of reliability and is considered more appropriate than older methods such as χ2, percentage agreement, product moment correlation, or Yule’s Y.15
For data description haemodynamic variables were expressed as percentage of baseline. Effects of graded changes in Po 2 on haemodynamic variables were assessed by repeated measure ANOVA versus baseline. Post hoc comparisons were done by paired t tests with Bonferroni’s correction for multiple comparisons. The level of significance was set to p = 0.05.
Results
For analysis the results of 14 subjects were included. In the remaining two subjects under study we did not obtain technically adequate results during all breathing periods.
Intraclass correlation coefficients for velocity, volume, and flow are presented in Table 1. Results in the macula were less reproducible than nasal or temporal. The correlation coefficients for velocity, volume, and flow were comparable.
Intraclass correlation coefficients (κ) of the Heidelberg retina flowmeter variables under study
The effects of graded changes of Po 2 on HRF variables are shown in Figures 1, 2, 3 for the three areas under study. All changes were dose dependent, with the largest decrease at 100% oxygen breathing and the largest increase at 10% oxygen + 90% nitrogen breathing. The level of significance as calculated by repeated measure ANOVA was < 0.001 for all variables under study.
In the macula (Fig 1) velocity was reduced by −22% (SD 9%) during 100% oxygen breathing (p < 0.009 versus baseline, as calculated by post hoc comparisons) and increased by +14% (12%) during 10% oxygen + 90% nitrogen breathing (p < 0.041 versus baseline). Eighty per cent oxygen + 20% nitrogen breathing decreased velocity by −19% (11%) (p < 0.021 versus baseline), whereas the other gas mixtures did not significantly change velocity. The effect on volume was less pronounced with a −14% (9%) decrease during 100% oxygen breathing (NS versus baseline) and a +11% (3%) increase during 10% oxygen + 90% nitrogen breathing (NS versus baseline). Flow decreased by −33% (12%) during 100% oxygen breathing (p < 0.005 versus baseline), by −29% (13%) during 80% oxygen + 20% nitrogen breathing (p < 0.011 versus baseline), and by −25% (12%) during 60% oxygen + 40% nitrogen breathing (p < 0.024 versus baseline). A significant increase was observed during 10% oxygen + 90% nitrogen breathing (+28% (16%), p < 0.017 versus baseline).

The effect of different mixtures of O2 and N2 on scanning laser Doppler flowmetry variables in the macula. Results are presented as percentage change from baseline (means (SEM)).
In the nasal area (Fig 2) significant decreases in velocity were observed during administration of 100% oxygen (−20% (7%), p < 0.011 versus baseline) and 80% oxygen + 20% nitrogen (−18% (6%), p < 0.013 versus baseline), whereas none of the other gas mixtures significantly increased velocity. Again, the effect on volume was less pronounced with a −11% (7%) decrease during 100% oxygen breathing (p < 0.048 versus baseline) and a +13% (12%) increase during 10% oxygen + 90% nitrogen breathing (ns versus baseline). Blood flow significantly decreased during 100% oxygen breathing (−29% (8%), p < 0.007 versus baseline) and during 80% oxygen + 20% nitrogen breathing (−24% (8%), p < 0.009 versus baseline), and increased during administration of 15% oxygen + 85% nitrogen (+ 25% (19%), p < 0.032 versus baseline) and 10% oxygen + 90% nitrogen (+33% (20%), p < 0.024 versus baseline).
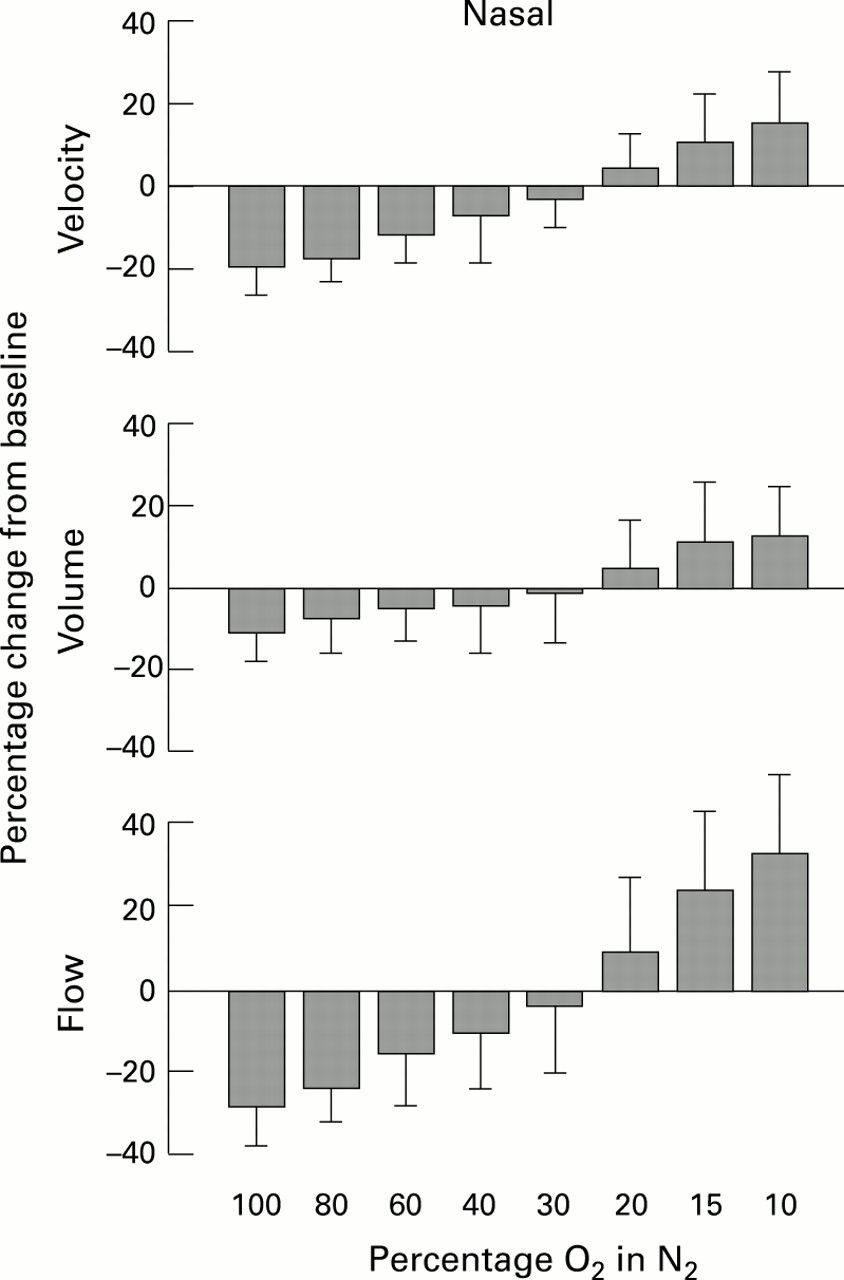
The effect of different mixtures of O2 and N2 on scanning laser Doppler flowmetry variables in an area approximately 5 degrees nasal. Results are presented as percentage change from baseline (means (SEM)).
In the temporal area (Fig 3) velocity decreased by −20% (8%) during 100% oxygen breathing (p < 0.003) and by −18% (6%) during 80% oxygen + 20% nitrogen breathing (−18% (6%), p < 0.006 versus baseline), and increased during 10% oxygen + 90% nitrogen breathing (p < 0.043 versus baseline). Volume was reduced by −13% (5%) during 100% oxygen administration (p < 0.027 versus baseline), but was not significantly altered during the other inhalation periods. The effect on flow reached statistical significance during 100% oxygen breathing (−31% (10%), p < 0.002 versus baseline), during 80% oxygen + 20% nitrogen breathing (−27% (7%), p < 0.009 versus baseline), and during 10% oxygen + 90% nitrogen breathing (+29 (17%), p < 0.026).

The effect of different mixtures of O2 and N2 on scanning laser Doppler flowmetry variables in an area approximately 5 degrees temporal. Results are presented as percentage change from baseline (means (SEM)).
Systemic haemodynamics showed only minor changes during inhalation periods (Table 2). Only with the 10% oxygen + 90% nitrogen mixture was a significant increase in pulse rate observed (p < 0.023).
Systemic haemodynamics during breathing mixtures of oxygen and nitrogen. Data are mean (SEM)
Discussion
Reproducibility of measurements is a major determinant for the capability of a method to detect drug or disease induced effects. The reproducibility of HRF variables in our study is slightly less than that previously reported.8 10 There were no large differences among the intraclass correlation coefficients for the three retinal locations tested; however, the values observed for the macula were lowest of all three areas. The reproducibility of HRF measurements is in the same magnitude as that reported for colour Doppler ultrasound.16 The intraclass correlation coefficients obtained in the present study indicate that scanning laser Doppler flowmetry provides haemodynamic variables with acceptable reproducibility.
In the present study 100% oxygen breathing caused a decrease in flow between 29% and 33%, in velocity between 20% and 22% and in volume between 11% and 14% in the areas under study. Compared with other published data these reductions are considerably less pronounced. During 60% oxygen breathing Fallon et al 17reported a 36% decrease in macula capillary leucocyte velocity as assessed with the blue field entoptic technique. With the same method Sponsel et al 18 reported a 20% decrease in leucocyte velocity and a 23% decrease in leucocyte density during 100% oxygen inhalation. However, the comparability of HRF with blue field entoptic variables is limited, as Doppler flowmetry measures RBC velocity, whereas blue field technique measures leucocyte velocity.19 Using laser Doppler velocimetry and fundus photographs Riva et al 13 and Pakola and Grunwald20 observed a 64% and 56% decrease during 100% oxygen breathing, respectively. It must be kept in mind that these results were obtained in major retinal veins, whereas the HRF data reflect blood flow from superficial and deep capillary layers of the retinal circulation. The ratio with which these layers contribute to the signal in the present study is unknown and it might well be that they have different responsiveness to hyperoxia. Hence, one does not necessarily expect the same results with the two methods.
During hypoxia we observed an increase in haemodynamic variables. In humans only few data on the effects of a decrease in Po 2 on retinal blood flow are available. With the blue field entoptic technique a 38% increase in leucocyte velocity under 10.5% oxygen breathing has been reported.17 On the other hand Sponsel et al 18 did not find significant changes in leucocyte velocity and density during mild hypoxia (16% oxygen).
However, we observed a dose dependent change in retinal blood flow during graded oxygen breathing. This effect was highly significant as evidenced by repeated measure ANOVA. A progressive decrease in leucocyte velocity has already been observed previously with increasing oxygen concentrations.21 Moreover, there was no significant difference in Po 2 reactivity of the three retinal areas in our study. This is in keeping with the results of a recently published laser Doppler velocimetry study.22Hence, the results of this HRF study are generally in keeping with literature, despite the flatter dose-response curve. We cannot entirely exclude that we did not reach Po 2 levels as reported in other studies with the gas mixtures administered since we have not measured arterial Po 2. However, as we have deliberately used our gas delivery system for other clinical trials in which the effects on Po 2 were in agreement with the results of other investigators23 24 it is presumable that the effects on Po 2 were in the same range as in other studies.
The flattened dose-response curve in the present study might be caused by the contribution of the choroidal circulation to the signal, because the reactivity of choroidal blood flow to changes in Po 2 is much less pronounced than that of the retinal blood flow.23-25 This is particularly important when measurements are taken from sites near the centre of the macula. However, the reactivity of flow was comparable between the three areas under study, which argues that the choroidal blood flow contribution was not more pronounced at the margin of the avascular retinal zone.
Additionally, methodological problems have to be considered, when our data are interpreted. On the one hand the large zero offset of the method might be responsible for this observation, because it will generally lead to flattened dose-response curves. In the current version of the instrument the noise is calculated from the power in the frequency band between 1.5 and 2 kHz.10 However, the validity of this procedure is not yet entirely clear, especially because the data acquisition time per pixel is very short. On the other hand it is uncertain whether the upper cutoff frequency of the instrument of 2 kHz is appropriate for the detection of larger increases in retinal blood flow. It has been reported that in normal retinal tissue the Doppler broadenings are in the range of 500–800 Hz.10 Hence, an increase in retinal blood flow, which increases Doppler shift frequencies, might be underestimated as the instrument works near the saturation point. In addition, some information on very low blood flow velocities may be lost owing to the setting of the lower cutoff frequency to 125 Hz, which is necessary to reduce the influence of movement artefacts.
It must be kept in mind that we did not obtain technically adequate results in two subjects under study. This is mainly caused by fixation problems when the laser beam scans along the retina. This problem might be partially overcome if a fixation light is given to the studied eye and not to the contralateral eye. However, there might be some additional sources of error, which limit the reproducibility and sensitivity of the method. It is well known from blue field technique and scanning laser fluorescein angiography that retinal capillary blood flow is pulsatile.19 Hence, the reading of a single image point will depend on the time point during the cardiac cycle. It is obvious that the larger the area which is used for evaluation the smaller the error due to time averaging.26 This problem might be partially solved if the start of recording is triggered by an electrocardiograph. An additional source of error with the laser Doppler flowmeter is introduced by displacement of the analysis window, when different images are evaluated. If measurements are taken from slightly different geographic areas noteworthy errors may be introduced. An automated, software based selection of the region of interest might in future be helpful in overcoming this problem.
In conclusion, we have shown that scanning laser Doppler flowmetry has an acceptable reproducibility and is appropriate for description of the effect of graded changes in Po 2 on retinal haemodynamics. In two of the 16 subjects we did not get technically adequate results. The main problems with the system are the large zero offset, the fixation during retinal scanning, and the neglect of blood flow changes during the cardiac cycle.