Article Text

Abstract
AIMS/BACKGROUND The measurement of visual acuity is the most widely accepted indicator of amblyopia and is thought by some to be the only effective screening test. The aim of this study was to investigate the effectiveness of the traditional single optotype Sheridan-Gardiner test (SGT) in the measurement of visual acuity and the detection of amblyopia, compared with the log based linear format Glasgow acuity cards (GAC).
METHODS In the present study visual acuity was measured monocularly in 702 primary 1 schoolchildren using both acuity tests.
RESULTS A significant difference was found in the mean (SD) visual acuity measured with GAC (0.9 (0.08) modified logMAR) and SGT (1.13 (0.09) modified logMAR), df=632, t=−59.08, p=0.0001. The majority of children (89.3%) achieved visual acuities better than 6/6 in either eye when using the single optotype test. If the 95% confidence limits for a significant interocular difference in acuity are used as criteria for the detection of unilateral amblyopia, GAC were found to be the most sensitive, correctly identifying 100%, while SGT identified 55% of the children with unilateral amblyopia.
CONCLUSION The results of this study highlight several problems with both the test format and testing procedure in the present school screening system.
- visual acuity
- amblyopia
- screening
Statistics from Altmetric.com
In the general population the incidence of squint is approximately 4.75% and amblyopia 2–3%.1 Studies have shown that during the first 45 years of life amblyopia is responsible for loss of vision in more people than all other ocular disease and trauma combined, and in those aged under 20 years the incidence of amblyopia is 10 times more frequent than all other diseases and trauma.
There is evidence that early recognition and treatment of squint, amblyopia, and significant ametropia will produce benefits in terms of a reduced frequency and severity of permanent amblyopia,2-6 therefore providing the justification for screening. The concept that the plasticity of the visual system decreases rapidly over the first 6 to 8 years of life1 7 8 also strongly suggests the advocation of early treatment.
The ideal screening test should be simple and quick to administer and easy to interpret by paramedical or other personnel. In considering the effectiveness of a screening examination the test must be valid—that is, be able to separate those children with, in this case, amblyopia and those without. The primary requirements for a screening programme are met insofar as vision and ocular defects represent common and serious disorders which have at least partly understood natural histories.1 9
The measurement of visual acuity is the most widely accepted indicator of amblyopia and thought by some to be the only effective screening test.10 A visual acuity test should offer three essential features if it is to provide useful information which can be used to assess vision and to direct the clinical management of remedial therapy for conditions such as amblyopia.
-
It must provide an accurate measure of visual acuity
-
It must provide a reliable measure of visual acuity
-
It must be sensitive to detecting the condition which the clinician is interested in trying to treat.
The single optotype format of the Sheridan–Gardiner test (SGT) has over the years been accepted as the method of acuity measurement in both preschool and early school age children and illiterate children, usually chosen for its simplicity, speed, and greater legibility. It has, however, several disadvantages, the most salient being the irregular progression of letter size, truncation of the measuring scale, and lack of contour interaction. Although single optotypes may have been adopted as a test of choice, the test’s ability to identify amblyopia has been questioned11-13 especially because of the lack of surrounding contours. Objects in the real world are not resolved in isolation, adjacent contours ‘crowd’ our target resolution; this is an important consideration in the clinical assessment of visual acuity and is termed the crowding phenomenon. The presence of contours adjacent to a letter will reduce visual acuity. This crowding effect is reportedly greater in both children and amblyopes,14 15 therefore the necessity for adjacent contours in a visual acuity test format becomes obligatory. Consequently, a rapid linear format test would prove more sensitive for the detection of amblyopia in children.
The aim of this study was to investigate the effect these differences in chart design have on the measurement of visual acuity using the SGT and GAC in a large number of children.
Methods
Primary 1 schoolchildren from a selection of schools in Glasgow were tested. The schools were selected to provide a representative cross section of both geographical and socioeconomic class.
SUBJECTS
Unaided visual acuity was tested randomly in both the right and left eye of all children with a mean age of 5.4 (SD 0.3) years applying both the SGT and GAC. For each child an orthoptic assessment was carried out which included near and distance cover test, ocular motility, convergence, 20 dioptre prism test, and a stereoacuity test (screening plate of Frisby).
Informed consent was obtained from the parents of all the children before testing.
LETTER CHARTS
The Glasgow acuity cards16 (see Fig 1) were designed to provide an accurate and reliable measure of visual acuity and have been shown to be useful in both adult and paediatric patients.17 Three versions of the test exist to limit any artefacts introduced by memorisation and intersession variability. The design attributes which are incorporated to overcome the problems of measuring visual acuity with Snellen charts are briefly given below.

Glasgow acuity cards. Each has four letters per line and controls contour interaction by means of a surrounding crowding bar (after McGraw and Winn16).
-
A 3 metre test distance which reduces test time18 gains patient cooperation18 19
-
The GACs are based on a linear progression of letter size, whose ratio is equal to 1010 (0.1 log units)
• Equal number of letters per line (4) ensure a constant visual demand; therefore the only variable is the change of visual angle of the letters
-
Surrounding contours, in the form of a crowding bar, have been incorporated into the test to standardise the crowding effect14 20 at each acuity level. Interletter spacing and spacing between bar and letters remains constant at 0.5 letter diameter.
A modified acuity scoring system using the log of the minimum angle of resolution was used for the GAC data16; each line changing in size by 0.1 log units, therefore each letter scoring 0.025 log units. The system designates 6/6 a score of 1 and 6/60 a score of 0 with visual acuities of less than 6/60 carrying a negative sign (GAC score = 1 − logMAR). Improvements in acuity, therefore, result in an increase in score.
The SGT is a development of the original Stycar test.19 It was originally designed for research into visual defects with physically and mentally handicapped children and, in addition, provided at the time an inexpensive portable vision screening test suitable for both near and distance acuity assessment in young preschool children.
The test is an arrangement of the Stycar symmetrical letters (X O V T A H U). The test itself comprises of three books each containing three letters of each size, 6/60–6/18, 6/18–6/6, and 6/6–6/3. The use of Snellen based charts to measure visual acuity suffers from a number of design faults which can make data obtained unreliable and inaccurate.21 Truncation effects can become apparent when the full set of booklets is not employed, all three booklets were used in this study.
PROCEDURE
SGTs were carried out at the recommended test distance of 6 metres and GACs were carried out at the recommended test distance of 3 metres. Using the SGT, vision was defined as the smallest level at which the majority of letters were correctly identified. The endpoint, and therefore, the recorded vision with GAC was reached when no further letters could be identified on a particular line, subjects having been instructed to guess up until this point. Single optotype acuity was converted to modified logMAR to allow a direct examination of the two scoring systems.
Children either responded verbally or performed the acuity tests as letter matching tests via an appropriate keycard.
The acuity measurements were carried out as a ‘blind’ assessment, where the examiner had no knowledge of either the results of previous eye tests or whether or not the child wore glasses. Where a visual abnormality was detected the school medical records were analysed to reveal if, when, and how the abnormality had previously been discovered.
Results
For the screening of distance vision, the present criteria for referral in the school system in Glasgow is a visual acuity of 6/9 or less in either eye or a difference in acuity of one line or more. Therefore, for the purpose of this study, a single optotype visual acuity of 6/6 or better was deemed normal.
VISUAL ACUITY THRESHOLDS OF POPULATION
When employing the SGT 633 children (90.2%) had a visual acuity of 6/6 or better while the remaining 69 (9.8%) had a reduced visual acuity of 6/9 or less. Of those children with reduced visual acuity, 34 children had previously been detected by the school nurse, 23 children had already attended either an optician or hospital department for treatment, and 12 children had previously undetected visual defects.
SGT is the test of choice for 5 year olds in Glasgow schools and as previously mentioned a single optotype acuity of 6/6 is termed a ‘normal’ visual acuity for this age group according to the present school screening protocol; however, 565 children with normal visual acuity achieved a single optotype acuity of better than 6/6 in either eye. Of these children 160 (25.3%) had a vision of 6/5 both eyes, 348 (55%) 6/4 both eyes, 13 (2%) 6/3 both eyes, and the remaining 44 (7%) had a combination of these visions in either eye.
A significant difference was found in the mean visual acuity (SD) measured with GAC (0.9 (0.08) modified logMAR) and SGT in the visually normal children (1.13 (0.09) modified logMAR), df=632, t=−59.08, p=0.0001. The majority of children were not able to achieve levels of 6/6 with a linear format test; this supports the suggestion that maturation of linear visual acuity is thought to occur later at around 10 years of age.22 Normal limits in the measurement of visual acuity were defined as 1.96 SD from the mean. These results can be used as criteria for detecting amblyopia for each of the acuity tests. A child’s vision was considered reduced if it was below the lower limits of normality (see Table 1). Using these criteria GAC were found to be the most sensitive in detecting children with amblyopia (100%) while SGT produced a reduced detection frequency of 74%.
Limits of normality for Glasgow acuity cards (GAC) and Sheridan–Gardiner tests (SGT) visual acuity scores
COMPARISON BETWEEN GAC AND SGT IN VISUALLY NORMAL CHILDREN
A scatterplot of the difference in acuity score against the mean acuity score is shown in Figure 2. The SD of the differences between measurements made by the two methods provides a good index of the comparability of the methods. If the mean and SD can be estimated reliably, with small standard errors, it can be said that the difference between methods will be at the most 2 SD on either side of the mean.23 These results demonstrate the mean (SD) of the differences in acuity scores between SGT and GAC was 0.23 (0.19) log units with SGT having the higher acuity than GAC.

Scatterplot of the difference in visual acuity against the mean acuity for the Sheridan–Gardiner test and the Glasgow acuity cards.
Comparison of GAC and SGT shows a bias in the mean difference between acuity scores. As GAC was subtracted from the SGT score, this indicates that SGT produces a higher or better score than GAC, with a mean difference of 0.23 log units—that is, more than 2 lines better with SGT acuity test. The standard deviation of the differences between acuity tests allows us to calculate the estimated limits of agreement between tests; in this study visual acuity scores may differ by as much as plus or minus 0.4 log units between tests, which is clearly unacceptable for clinical purposes. The extent of the discrepancies between GAC and SGT and the lack of agreement clearly demonstrate that the two visual acuity test chart formats are not interchangeable or indeed comparable.
INTEROCULAR ACUITY DIFFERENCES IN VISUALLY NORMAL CHILDREN
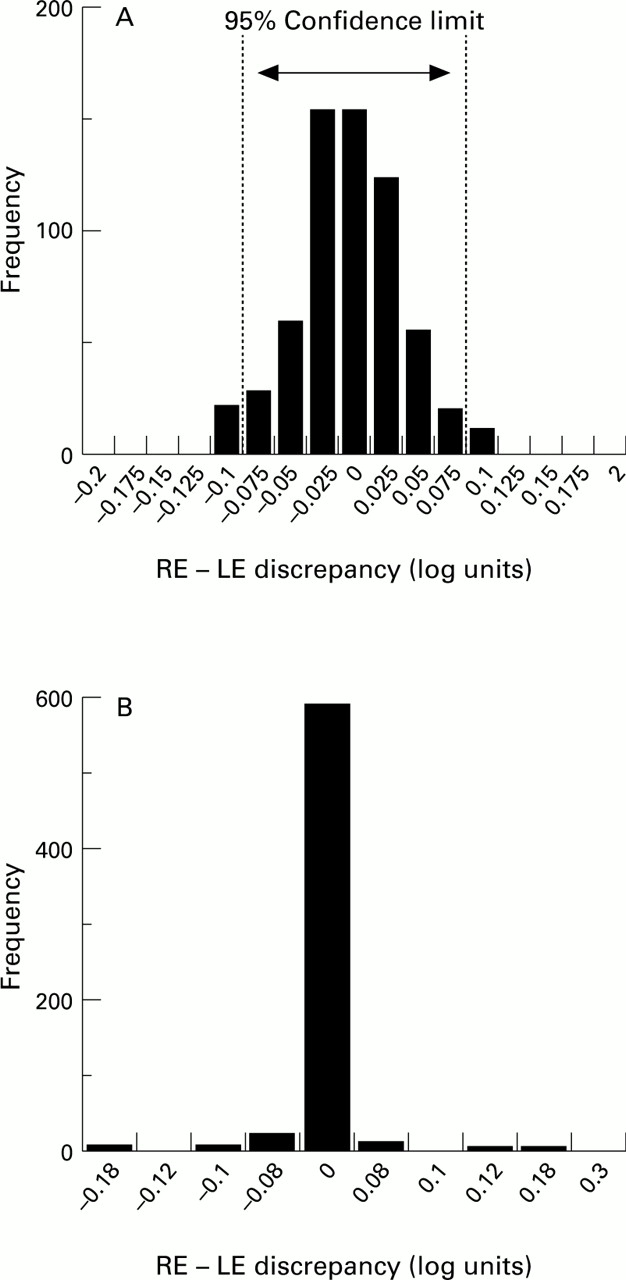
Frequency distributions plots for the right and left eye discrepancies for both GAC and SGT are shown in Figure3.

Frequency distribution plots of right and left eye discrepancies using (A) Glasgow acuity cards and (B) Sheridan–Gardiner tests of 633 visually normal children.
Examination of Figure 3A and B clearly demonstrates the effect of coarse and unequal increments in a measuring scale. GAC show a wide distribution of discrepancies and SGTs a very narrow range of discrepancies, indicating a high degree of concordance.24A significant problem in the analysis of data with unequal scale increments is the fact that a confidence interval cannot be accurately calculated as its size will depend on where you start on the measuring scale. It would be inappropriate to take the mean incremental step for SGT over the entire acuity range. As these children were all visually normal, the majority of scores are clustered around a few values; therefore, the mean scale increment was calculated for the acuity range over which the majority of population scores lay (6/6–6/3), and was found to be 0.1 log units.
The 95% confidence limits for detecting a significant interocular change provide the basis for determining criteria in the detection of an abnormal difference in visual acuity. A difference in acuity between the right and left eyes would have to be greater than the limits set by the data on visually normal children to be deemed abnormal and warrant further investigation. The 95% confidence limits may be determined by simply multiplying the standard deviation of the discrepancy by a value of 1.96.23 24 There is, therefore, less than a 5% chance that any subject who has not undergone any real change will show a change greater than that indicated by the dotted lines on the distribution graphs for these acuity tests. From these data the 95% confidence limits have been determined and are presented in Table2.
The 95% confidence limits for interocular differences, for Glasgow acuity cards (GAC) and Sheridan–Gardiner tests (SGT) in the visually normal population
If these values for a significant interocular difference in acuity are used as criteria for the detection of unilateral amblyopia, GACs are found to be the most sensitive—correctly identifying 100%, while SGTs identified 55% of the children with unilateral amblyopia.
Discussion
It is a well established fact that it is easier to recognise a single optotype than it is to identify a row of letters. This superior acuity achieved by single optotype acuity tests is well documented in children25 and confirmed in the results of this study.
The presence of contours adjacent to a letter or symbol (contour interaction) will reduce the acuity in both normal and amblyopic subjects14 20 but the difference in acuity may be as much as 2 or 3 lines if amblyopia is present. This decrease in acuity can be largely explained by the crowding phenomenon or separation difficulty which describes the clinical finding that resolution ability is related to the separation of acuity targets. With the SGT test, the finding of normal or near normal acuity in subjects with amblyopia, owing to the obvious absence of crowding with such a test, has led to concern.12 13 In this study the fact that 26% of the children with amblyopia achieved 6/6 with SGTs but were outside the 95% confidence limits for GACs, would have remained undetected if a measure of single optotype acuity was the only determining factor in the referral criteria.
Subsequent modifications of the single optotype format have taken into account the effects of the crowding phenomenon13 15 but as they are scored on a Snellen format they still incur problems which include a different number of letters per line, irregular progression of letter size, and lack of an accurate and standardised scoring system. GACs standardise the effects of crowding at each acuity level by means of a crowding bar to surround the four letter array.
The significant difference in visual acuity between GAC and SGT (0.23 log units) is not entirely due to the addition of a crowding bar. A very important consideration in the design of any acuity test is the chosen grading scale and method of scoring. Figure 3 demonstrates the effect of a coarse measuring scale and unequal increments. Equal incremental steps and increasing the number of points on a measuring scale will help to produce narrower confidence limits24 as demonstrated when the distribution of interocular discrepancies were compared for GAC and SGT. With GAC a significant interocular difference in the visually normal children was found to be 0.1 log units, in comparison with SGT where a unit change of 0.2 log units was required. If these values are used as criteria in the detection of unilateral amblyopia SGT would have failed to identify 45% of the amblyopes in this study, while GAC had a 100% detection rate. The design features of GAC allow detection of smaller interocular differences, therefore improving its ability to detect unilateral amblyopia.
Owing to the discrepancies in the Snellen format, logMAR tests have been adopted as the gold standard in visual acuity measurement for adults.26 The scoring system of GAC is also based on the minimum angle of resolution; this method of scoring by letter gives a fourfold improvement in the sensitivity to change and would be expected to display a smaller standard deviation in the discrepancy distribution.24 The larger standard deviation of the discrepancy distribution when scoring by line, as in SGT, consequently widens the confidence limits.24
An added advantage of using a log scale is that the testing distance can be easily altered with a simple calculation. To facilitate the necessary 6 metres for SGT currently recommended in schools, the location of testing will vary from noisy and busy corridors to cluttered or dimly lit medical rooms and unused classrooms. As the recommended testing distance for GAC is 3 metres in the majority of cases a quiet, private room free of distractions could be utilised for testing. Non-visual factors such as cooperation and inattention undoubtedly contribute greatly to visual acuity measurements in this age group,18 and reduced testing distance for GAC would therefore be of great practical significance.
Conclusions
The results of this study highlight several problems with both the test format and testing procedure in the present school screening system in Glasgow for primary 1 schoolchildren.
-
The use of single optotype tests may well conceal a true interocular difference and also tend to overestimate the child’s visual acuity, owing to both the lack of contour interaction and coarse incremental steps.
-
Current practice using an SGT is to accept 6/6 as normal vision. Personnel performing a visual screening test with SGTs should routinely proceed past 6/6, as the vast majority of children (89.3%) in this study achieved an acuity of better than 6/6 either eye. Changing the referral criteria, however, although increasing the sensitivity would have the potential to significantly reduce the specificity of testing.
-
GACs incorporate an equivalent task at each acuity level, apply a logarithmic progression of letter size, and control contour interaction. These considerations in design provide a greater sensitivity for interocular differences when compared with the traditional single optotype format.
-
A single optotype test based on a logarithmic progression of letter size would produce a narrowing of confidence limits, therefore improving sensitivity for the detection of a significant interocular difference or change in acuity.
Confidence limits for both unaided visual acuity and interocular differences in acuity cannot be accurately determined for the SGT owing to the non-normal distribution of visual acuity scores. The use of single optotype tests may well conceal a true interocular difference and tend to overestimate a child’s visual acuity, because of the irregular progression of letter sizes and the coarse scale. These problems can be overcome by using a test with a regular logarithmic progression of letter size, such as the GAC, which can be scored per letter. GACs would require to be performed by all pupils and the false positive rate calculated, to ensure that they would be a better overall alternative to the present visual acuity test used for visual screening in primary 1 schoolchildren.