Article Text

Abstract
AIM To assess the morphological change in retinal topography using a scanning laser tomographer following macular hole surgery. To compare the results of scanning laser tomography with clinical evaluation and visual function assessment.
METHODS The sample for this pilot study comprised four eyes exhibiting different stages of macular hole formation preoperatively. Subjects were assessed preoperatively and at 1 and 3 months postoperatively. Each assessment included visual acuity, letter contrast sensitivity, clinical examination (including automated static perimetry), and scanning laser tomography. The Heidelberg retina tomograph (HRT) was used to acquire digitised scanning laser tomography images of the macula (10° and 20° fields). Surgery essentially comprised vitrectomy, peeling of the posterior hyaloid face, if still attached, and intraocular gas tamponade. The magnitude and significance of topographic change were determined postoperatively using the HRT topographic difference facility.
RESULTS Topographic difference analysis of the right and left eyes of case 1 showed a significant reduction in the height of the retina postoperatively. Topographic difference analysis of case 2 showed no significant change in topography. Topographic difference analysis of case 3 showed a significant increase in the height of the retina postoperatively. Scanning laser tomography agreed with clinical assessment based upon fundus biomicroscopy in three of the four eyes studied; the postoperative closure of the stage 2 macular hole (as noted by clinical assessment) proved to be too small to reach statistical significance. Scanning laser tomography agreed with the assessment of visual function in two eyes; the agreement between scanning laser tomography and visual function depends, in part, on the stage of development of the macular hole.
CONCLUSION Scanning laser tomography provides an objective evaluation of the outcome of macular hole surgery. Studies employing larger sample sizes are required to fully determine the clinical worth of the technique.
- macular hole
- surgery
- scanning laser tomography
- topography.
Statistics from Altmetric.com
The surgical treatment of idiopathic macular holes, first suggested by Gass in 1988,1 2 is now an established part of vitreoretinal practice. The procedure involves vitrectomy, peeling of the posterior hyaloid face, if still attached, and intraocular gas tamponade.3 4 Surgical success is thought to be enhanced by the application of transforming growth factor-β2 to the macular hole5; alternative adjuvant agents include autologous serum,6 7 fibrin glue,8 and thrombin.9 Other variations in the procedure include the use of different intraocular gases (SF6, C2F6, or C3F8) and different postoperative posturing regimens.3 10
Current clinical methods of determining the outcome of macular hole surgery include the assessment of visual acuity, stereo photography, Goldmann contact lens and +78 dioptre lens fundus biomicroscopy (to assess the extent of subretinal fluid and the elevation of the retina), and fluorescein angiography (to assess the area of central hyperfluorescence).3 In addition, scanning laser microperimetry has been proposed as a useful technique to assess the sensitivity of the neurosensory retina surrounding macular holes.11 Reduction in visual acuity occurs as a result of an absolute loss of retinal sensitivity within the macular hole and also a relative sensitivity loss corresponding to cystoid macular oedema surrounding the hole12 and the underlying rim of subretinal fluid.11 The flattening of the rim of detached neurosensory retina surrounding the macular hole is an important surgical outcome measure. Fluorescein angiography provides no topographical information and the technique is invasive and has potentially dangerous side effects. Stereo photography, Goldmann contact lens, and +78 dioptre lens fundus biomicroscopy all rely on the subjective evaluation of retinal morphology. Methods to evaluate objectively macular topography may aid the evaluation of new strategies in macular hole surgery.
Scanning laser tomography is a non-invasive technique which permits the objective, topographic measurement of the fundus.13 It employs a confocal optical system to enable high resolution along the optical axis. The primary motivation for the development of scanning laser tomography was as an aid in the clinical management of glaucomatous optic neuropathy. A reproducibility of less than 50 μm has been found in the measurement of optic disc topography.14-21 The technique also has potential clinical application in the assessment of macular morphology.22 23A recent study has found a reproducibility of plus or minus 58.7 μm for mean height values at the macula in normal subjects.23
The aim of this pilot study was to assess the morphological change in retinal topography using a scanning laser tomographer following macular hole surgery. The results of scanning laser tomography were compared with clinical evaluation and the assessment of visual function. A consecutive series of four eyes with different stages of idiopathic macular hole formation which have undergone vitrectomy and fluid-gas exchange is presented.
Materials and methods
SAMPLE
The sample comprised four eyes of a consecutive series of three subjects exhibiting different stages of idiopathic macular hole formation (stages 2–4 as classified by Gass1) and different surgical outcomes. Exclusion criteria included any evidence of lenticular opacity and a distance refractive error greater than plus or minus 5.00 DS or 2.50 DC. Informed consent was obtained from all subjects, having had the nature of the procedures explained to them, and the study was approved by the Central Manchester Research Ethics Committee. Subjects were assessed preoperatively, at 1 month (to allow the gas tamponade to dissipate), and between 3 and 4 months postoperatively. Assessment comprised: (i) refraction, high contrast logMAR visual acuity and Pelli–Robson letter contrast sensitivity (at 100 cd m−2); (ii) clinical examination; (iii) automated static threshold perimetry; and (iv) scanning laser tomography. The pupil of the eye to be treated was dilated following refraction and assessment of visual acuity and letter contrast sensitivity. The clinical examination included Goldmann contact lens and +78 dioptre lens fundus biomicroscopy, and fundus photography.
AUTOMATED STATIC THRESHOLD PERIMETRY
Automated static threshold perimetry was carried out using program 10-2 (size III stimulus; 0.431° angular subtense) of the Humphrey field analyser (HFA) 640. Perimetry was undertaken on two occasions preoperatively in order to minimise learning effects.24 25The result of the second perimetric test was taken as baseline. Pointwise change in sensitivity was assessed using the empiric total deviation and pattern deviation probability plots of the HFA. The total deviation plot illustrates the statistical significance of pointwise differences between the measured threshold and the age-matched normal threshold. The pattern deviation plot illustrates the statistical significance of pointwise deviations in the shape of the measured visual field from the shape of the age-matched normal field.26
SCANNING LASER TOMOGRAPHY
The Heidelberg retina tomograph (HRT) (Heidelberg Engineering, Heidelberg, Germany) was utilised to acquire topographic measurements of the macula of each eye. The HRT comprises a scanning laser camera mounted on an ophthalmic stand, a headrest, an operation panel, and a personal computer. A diode laser operating at a wavelength of 670 nm provides a maximum retinal irradiance of approximately 0.5 mW cm−1.27 Single two dimensional (that is, x, y) section images, comprising 256 × 256 pixels (each with 8 bit intensity resolution), are recorded at a repetition rate of 20 Hz. Each section image therefore comprises 65 536 pixels. A 10° × 10°, 15° × 15°, or 20° × 20° scan field can be selected. Topographic fundus measurement is achieved by scanning 32 equally spaced section images (termed a series image) along the optical axis (that is, z axis) over a period of 1.6 seconds. The depth of the scan can be adjusted between 0.5 mm and 4.0 mm in 0.5 mm increments. As a result, the spacing between sections will vary between 16 and 130 μm depending on the selected scan depth. The focal plane can be changed from -12 to +12 dioptres in steps of 0.25 dioptres to correct for refractive error. The acquired series image is stored in the image database of the personal computer. The 32 section images within each series image are aligned to compensate for eye movements which occur during image acquisition. Data analysis is carried out using the menu driven HRT operation software.
The refractive error and corneal curvature of each subject were entered into the HRT database before image acquisition. A periscope device allowed subjects to fixate a distant target with the fellow eye and maintain steady central fixation. The monitor aiming cross was employed to centre the image frame on the macular hole. Seven series images were acquired for both a 10° × 10° (for maximum resolution) and a 20° × 20° (equivalent area to HFA program 10-2) scan field. Scan depth and field were kept constant at a given visit. Change in retinal topography following surgery, however, dictated that scan depth and refractive error were adjusted for some subjects between visits. Topography files were produced from individual series images and mean topography files were generated comprising seven topographic images. Mean topography files with standard deviation of greater than 50 μm were discarded. Software version 1.11 was used throughout the study.
SURGICAL PROCEDURE
Surgery comprised a three port pars plana vitrectomy with peeling of epiretinal membranes and/or the posterior hyaloid face, where attached, using a flexible silicone tipped extrusion cannula. Fluid-air exchange was then performed followed by injection of 0.5 ml autologous serum onto the macular hole for 5 minutes, removal of serum, and gas exchange with 16% C2F6. The patient was then postured face down as soon as possible for a minimum of 2 weeks.
DATA ANALYSIS
A circular contour line was drawn around the macular hole of the preoperative mean topography image. The contour line encompassed the area of detached neurosensory retina as defined by the topography and reflectivity images displayed on the monitor. Topographic difference images were generated for each subsequent visit (that is, 1 month and 3 months postoperatively) relative to baseline. The area contained within the contour line was analysed to determine the magnitude and statistical significance of topographic change. The circular contour line of the preoperative mean topography image was imported to the 1 month postoperative mean topography image. The contour line was redrawn (using the same radius as the original) if the import function of the HRT produced an obvious positioning error. Any change in topography between the 1 month and 3 month mean topography images was then assessed.
Before topographic difference image determination, the HRT calculates a relative horizontal and vertical shift and rotation of the component mean topography images to ensure correct alignment. In addition, the component mean topography images undergo height offset and tilt corrections. In order to calculate the height offset the origin of the depth measurement of each mean topography image is taken as the mean height of a plane which best fits the retinal surface within a defined reference ring (that is, the relative coordinate system). The reference ring is located at the margins of, and is concentric with, the centre of the topography image; it has an outer diameter containing 94% of the image size and a ring width of 3% of the image size. Any difference in the mean height of the reference ring between the two mean topography images is assumed to be due to a change in refractive status rather than a change in topography. The depth measurement of each mean topography image is corrected for tilt of the fundus in relation to the plane which is perpendicular to the optical axis (that is, the tilt coordinate system). The tilt correction is defined by the tilt of the plane which best fits the retinal surface within the reference ring. The two mean topography images are corrected to have the same magnitude of tilt before the determination of the topographic difference image.
The topographic difference utility calculates the mean absolute difference, mean combined SD, and no change probability (NCP) for the area within the contour line.27 Mean absolute difference represents the mean of the absolute height differences for each pixel of the two component mean topography images. In this study, a positive mean absolute difference represents a reduction in topographic height over time, while a negative mean absolute difference represents an increase in height. Mean combined SD represents the mean of the root mean square values of the standard deviations. NCP is a measure of the probability of a significant difference in absolute height between the two component mean topography (MT) images and is calculated using the equation:
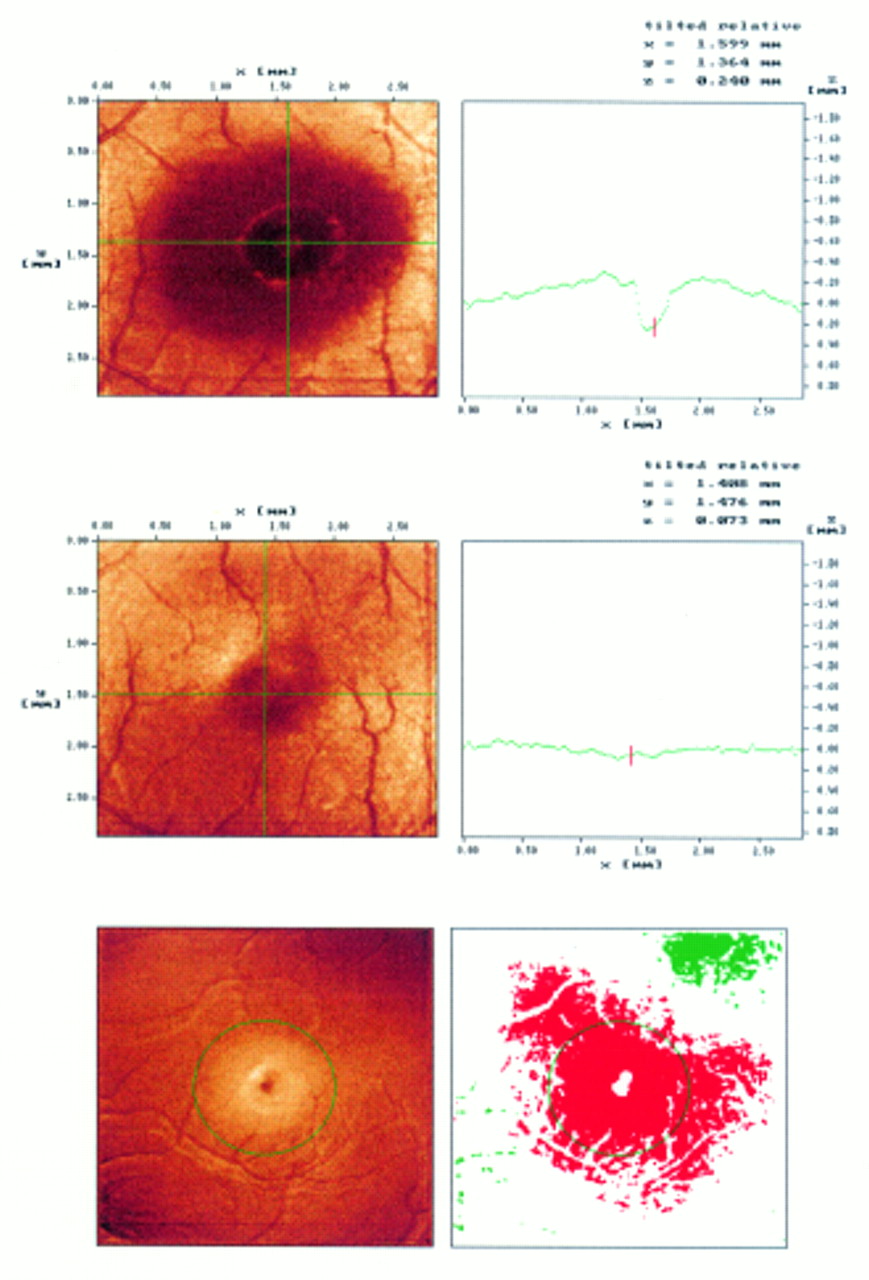
Case 1, left eye; Heidelberg retina tomograph intensity image and the corresponding horizontal retinal profile (10° scan field) preoperatively (upper) and 3 months postoperatively (middle). Topographic difference image (lower left) and significance marker (lower right) for a 20° scan field 3 months postoperatively relative to baseline (red represents significant reduction of retinal height, while green represents significant elevation).
Results
CASE 1
A 63-year-old man presented with a recent central blurring of vision in the left eye. Clinical examination revealed a left stage 3 macular hole, with vitreomacular traction around its edge such that the surrounding rim of neurosensory retina appeared elevated. Postoperatively the macular hole appeared closed with flattening of the surrounding rim. LogMAR visual acuity was 0.7 preoperatively, 0.4 at 1 month, and 0.1 at 3 months postoperatively. Pelli–Robson letter contrast sensitivity was 1.40 preoperatively, 1.50 at 1 month, and 1.70 at 3 months postoperatively. One month postoperatively, the total and pattern deviation plots of the HFA revealed a pointwise increase in sensitivity relative to baseline at the fovea (that is, 25 dB, total deviation p<0.0005 preoperatively; 37 dB, p>0.05 postoperatively) and at adjacent stimulus locations (that is, 26–28 dB, total deviation p<0.02 to p<0.05 preoperatively; 32–34 dB, p>0.05 postoperatively) (Fig 1). The postoperative increase in sensitivity at 1 month was essentially unchanged at the 3 month visit.

Case 1, left eye; Humphrey field analyser overview printout of the baseline (upper), 1 month (middle), and 3 month (lower) postoperative 10-2 results (left, grey scale; mid left, numeric decibel format; mid right, total deviation probability plot; right, pattern deviation probability plot).
The HRT was employed with a scan depth of 1.5 mm for both the 10° and 20° fields at all three visits. One month postoperatively, topographic difference analysis for the 10° scan field showed a significant reduction in the height of the retina relative to baseline (Table 1; Fig 2). The 20° scan field also showed a significant reduction in the height of the retina between the preoperative and 1 month postoperative visits. Similarly, 3 months postoperatively, topographic difference analysis showed a significant reduction in the height of the retina for both the 10° and 20° scan fields. There was no significant difference in the height of the retina, however, between the 1 month and 3 month postoperative visits.
Topographic difference analysis following macular hole surgery
The subject also had a 12 month history of visual loss in the right eye with a long standing stage 4 macular hole on clinical examination. One month postoperatively the hole was closed with no residual fluid rim. However, cystic retinal changes were visible at the edge of the hole 3 months postoperatively. LogMAR visual acuity and Pelli–Robson letter contrast sensitivity were unchanged postoperatively relative to baseline (logMAR 0.8; Pelli–Robson 1.40). The total and pattern deviation plots of the HFA revealed no marked pointwise change in sensitivity postoperatively.
The HRT was employed with a scan depth of 2.5 mm and 2.0 mm for the 10° and 20° fields, respectively, at all three visits (a greater scan depth was employed for the right eye than the left because the elevation of the neurosensory retina surrounding the macular hole was greater for the right eye). One month postoperatively, topographic difference analysis for the 10° scan field showed a significant reduction in the height of the retina relative to baseline (Table 1). The 20° scan field also showed a significant reduction in the height of the retina between the preoperative and 1 month postoperative visits (Fig 3). Three months postoperatively, topographic difference analysis showed a significant reduction in the height of the retina for the 10° scan field relative to baseline. The 20° scan field failed to show any significant difference in the height of the retina between the preoperative and 3 month postoperative visits. Conversely, there was a significant increase in the height of the retina for the 10° scan field only between the 1 month and 3 month postoperative visits.
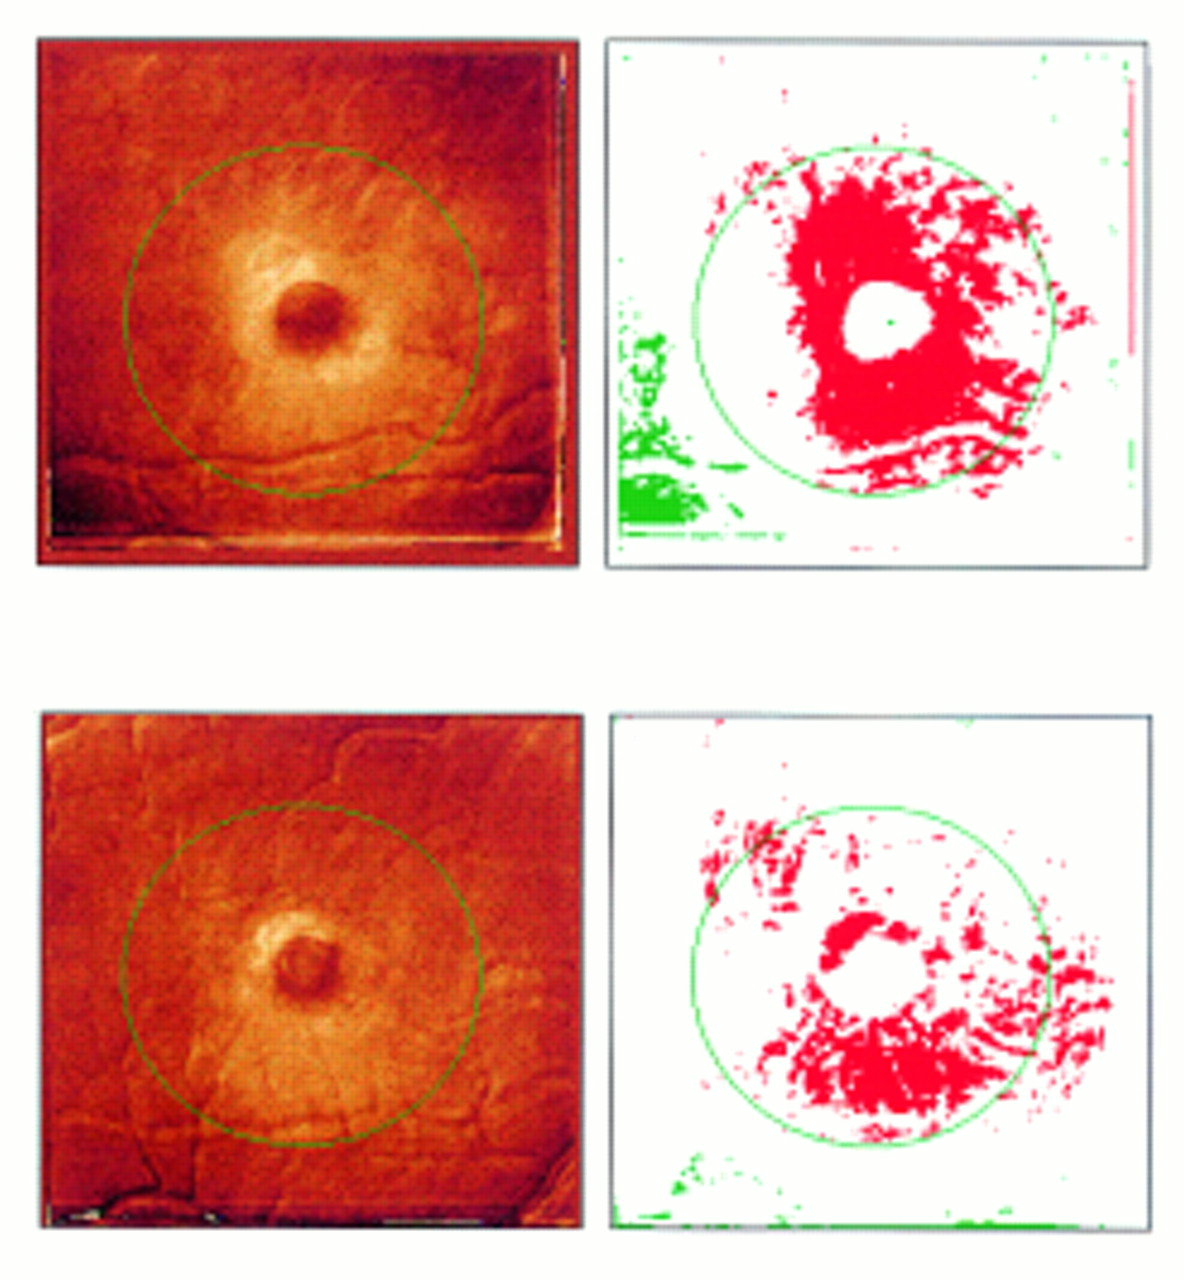
Case 1, right eye; Heidelberg retina tomograph topographic difference image (left) and significance marker (right) for a 20° scan field 1 month (upper) and 3 months (lower) postoperatively relative to baseline (red represents significant reduction of retinal height, while green represents significant elevation).
CASE 2
A 43-year-old man presented with loss of acuity in his left eye of 6 months’ duration. Clinical examination revealed a left stage 2 macular hole with a small crescent-shaped retinal defect. Postoperatively the hole became invisible to clinical examination. LogMAR visual acuity was 0.8 preoperatively and 0.6 at 1 and 3 months postoperatively. Pelli–Robson letter contrast sensitivity was 1.05 preoperatively and 1.40 at 1 and 3 months postoperatively. The total and pattern deviation plots of the HFA revealed no marked pointwise change in sensitivity postoperatively.
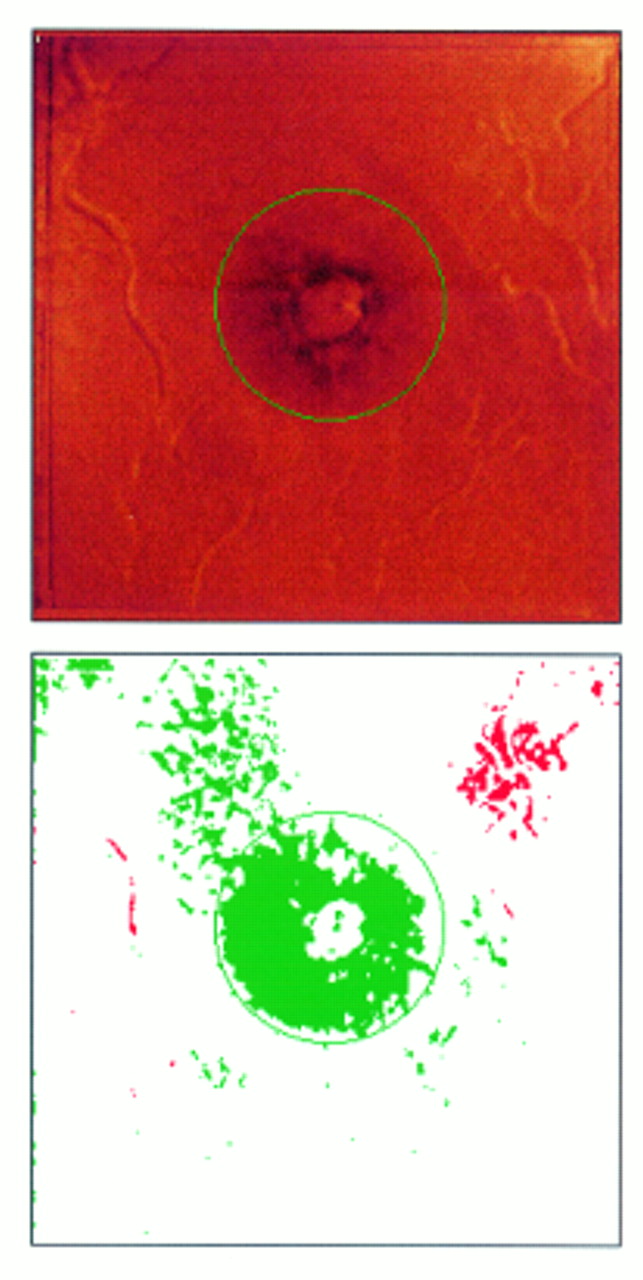
The HRT was employed with a scan depth of 1.5 mm for both the 10° and 20° fields at all three visits. One month postoperatively, topographic difference analysis for both the 10° and 20° scan fields showed no significant change in topography relative to baseline (Table 1; Fig 4). Similarly, 3 months postoperatively, topographic difference analysis showed no significant change in topography relative to baseline. In addition, there was no significant difference in the height of the retina between the 1 month and 3 month postoperative visits.

Case 2; Heidelberg retina tomograph intensity image and the corresponding horizontal retinal profile (10° scan field) preoperatively (upper) and 1 month postoperatively (middle). Topographic difference image (lower left) and significance marker (lower right) for a 10° scan field 3 months postoperatively relative to baseline (red represents significant reduction of retinal height, while green represents significant elevation).
CASE 3
A 67-year-old woman presented with blurred vision in the right eye of 2 months’ duration and clinical examination revealed a stage 3 macular hole. Postoperatively the macular hole remained open with a persisting subretinal fluid rim. LogMAR visual acuity and Pelli–Robson letter contrast sensitivity were unchanged postoperatively relative to baseline (logMAR 0.8; Pelli–Robson 1.35). One month postoperatively, the total and pattern deviation plots of the HFA revealed a pointwise increase in sensitivity relative to baseline at the fovea (that is, 19 dB, total deviation p<0.0005 preoperatively; 29 dB, p>0.0005 postoperatively), while adjacent stimulus locations exhibited a decrease in sensitivity (that is, 28–32 dB, total deviation p>0.05 preoperatively; 28–13 dB, p>0.05 to p<0.0005 postoperatively) (Fig5). The postoperative decrease in sensitivity extended from the fovea to the superior nasal edge of the area of visual field covered by HFA program 10-2. The postoperative decrease in sensitivity at 1 month was essentially unchanged at the 3 month visit.

Case 3; Humphrey field analyser overview printout of the baseline and 1 month postoperative 10-2 results (left, grey scale; mid left, numeric decibel format; mid right, total deviation probability plot; right, pattern deviation probability plot).
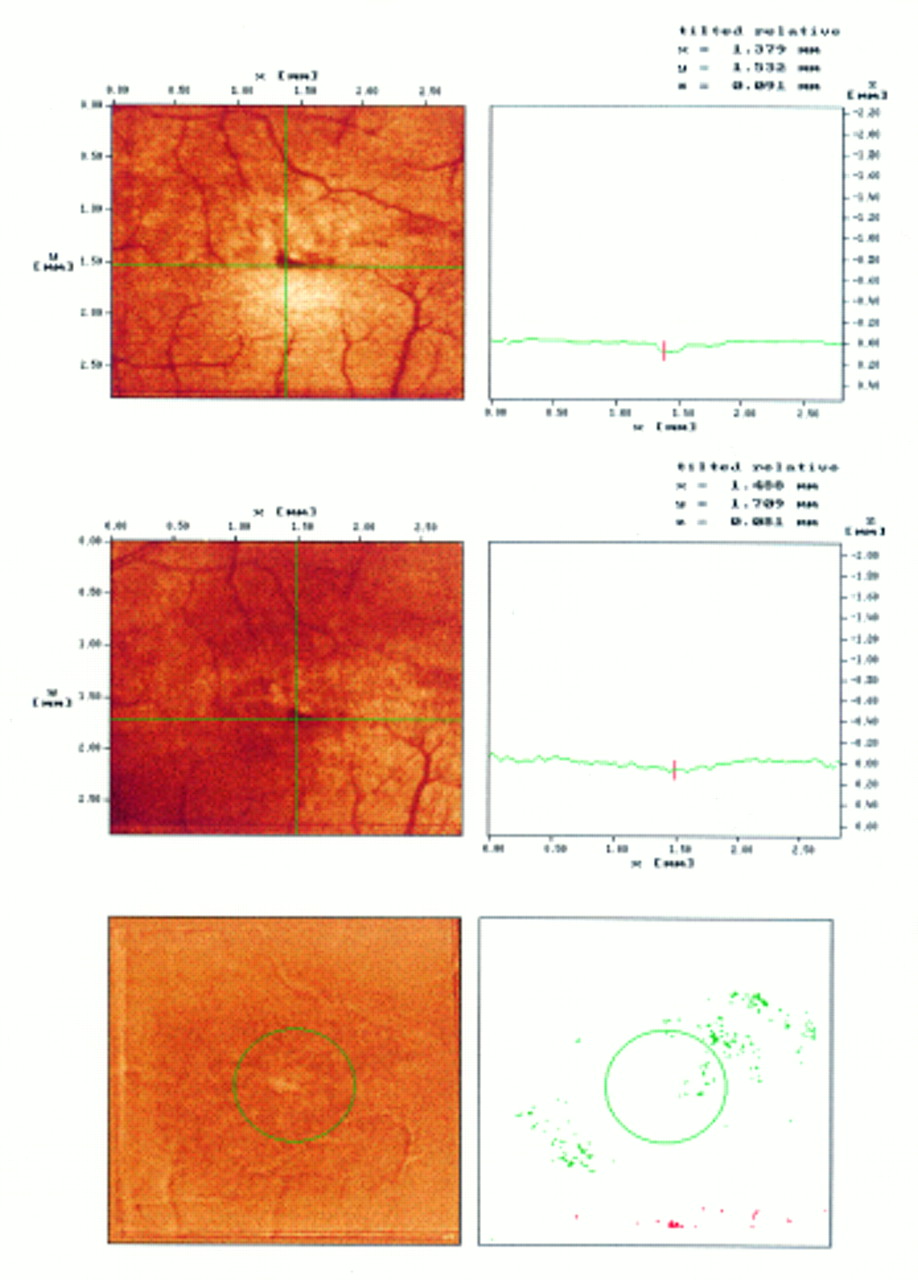
The HRT was employed with a scan depth of 1.5 mm for both the 10° and 20° fields preoperatively, while a depth of 2.5 mm was required postoperatively. One month postoperatively, topographic difference analysis for the 10° scan field showed a significant increase in the height of the retina relative to baseline (Table 1). The 20° scan field also showed a significant increase in the height of the retina at the 1 month postoperative visit (Fig 6). The increase in retinal height was not confined to the area within the circular contour line but extended into the inferior temporal corner of the 20° scan field. Three months postoperatively, topographic difference analysis for both scan fields showed a significant increase in the height of the retina relative to baseline. There was no significant difference in the height of the retina, however, between the 1 month and 3 month postoperative visits.
Case 3; Heidelberg retina tomograph topographic difference image (left) and significance marker (right) for a 20° scan field 1 month postoperatively relative to baseline (red represents significant reduction of retinal height, while green represents significant elevation).
Discussion
Change in retinal topography following macular hole surgery is difficult to grade. Various definitions of morphological success following macular hole surgery currently exist.28 In this study, the results of scanning laser tomography agreed with the subjective impression of morphological and topographical change gained from clinical assessment based upon fundus biomicroscopy for three of the four eyes studied. However, scanning laser tomography failed to show any significant change in retinal topography for case 2 despite the postoperative closure of the stage 2 macular hole noted by clinical assessment.
The results of scanning laser tomography and visual function were in agreement for the left eye of case 1, and case 3. The left eye of case 1 exhibited a postoperative increase of visual acuity and contrast sensitivity of 0.6 and 0.3 log units respectively, an increase in visual field sensitivity of stimulus locations at, and surrounding, the fovea, and a significant reduction in the height of the retina surrounding the macular hole. Similarly, case 3 exhibited a postoperative reduction in visual field sensitivity extending from the fovea to the superior nasal edge of the area of visual field covered by HFA program 10-2 which correlated with the increase in height of the retina shown on the topographic difference analysis. The right eye of case 1 failed to demonstrate any improvement in visual function despite a significant postoperative reduction in retinal height; a long standing stage 4 macular hole was noted preoperatively which probably resulted in an irreversible loss of visual function. Conversely, case 2 exhibited a postoperative increase of visual acuity and contrast sensitivity of 0.2 and 0.35 log units respectively but failed to demonstrate any significant change in retinal topography; the postoperative closure of the stage 2 macular hole (as noted by clinical assessment) proved to be too small to reach statistical significance. Caution must be exercised, however, in the interpretation of the topographic difference utility of the HRT. For example, significant change of retinal topography of 400 pixels, resulting in an NCP of 0.001 when considered alone, will be obscured if contained within a contour line containing another 9600 pixels which have exhibited no significant change in topography (NCP approximately 0.7); the resultant NCP for all the pixels contained within the contour line will be approximately 0.67. Consequently, significant localised change in topography may be missed if contained within a relatively large contour line.
The assessment of visual function is an important outcome measure of macular hole surgery (since this reflects the visual change experienced by the patient) but measures of visual acuity and contrast sensitivity do not exhibit absolute consistency in test scores when repeated. The coefficient of repeatability (COR) describes the 95% confidence limits for any discrepancy between test and retest measure.29 Any change in visual function over time must be greater than the normal COR to reach statistical significance.30 Typically, the COR for logMAR visual acuity is of the order of plus or minus 0.10 to plus or minus 0.15 log units.31 Consequently, change in logMAR visual acuity over time must exceed 2 to 3 lines to reach statistical significance (that is, p<0.05). In addition, COR values increase with decreasing contrast.31
The outcome of a single automated perimetry examination is influenced by various extraneous factors such as learning24 25 and fatigue.32 In this study, all subjects had experienced at least one previous automated perimetry examination before the baseline examination and were given frequent rest periods to minimise fatigue effects. However, the possibility of a residual learning effect cannot be excluded. The learning effect results in a generalised increase in sensitivity which is most marked for peripheral stimulus locations (that is, beyond 30° eccentricity).24 25 Conversely, the changes in sensitivity exhibited by the left eyes of cases 1 and 3 were localised and occurred within 10° eccentricity. In addition, the level of sensitivity is known to fluctuate both within (that is, short term fluctuation) and between (that is, long term fluctuation) perimetric examinations.33 Both short and long term fluctuations are known to be elevated at stimulus locations which exhibit reduced sensitivity. All of these factors confound the analysis of serial automated perimetry examinations. Furthermore, visual function tests can be influenced by motivational factors and change in fixational behaviour following surgery.
The influence of factors such as scan depth, scan field, and refractive correction on the reproducibility of scanning laser tomography measures, at this early stage in the development of the technique, is uncertain. Indeed, the right eye of case 1 demonstrated a statistically significant change of retinal height between visits 1 and 3, and between visits 2 and 3, only for the 10° field. This difference in statistical findings between the 10° and 20° fields can be explained by a greater variability of retinal height measurements with the larger field size and may be related to the reduced x, y resolution of section images with increase in field size. However, both refractive error and corneal curvature were largely unchanged postoperatively relative to the preoperative values (that is, within plus or minus 0.50 dioptres and plus or minus 0.10 mm). In addition, optical factors can result in artefactual depressions and elevations of topography.34 In particular, the normal human macula exhibits an artefactual elevation at the fovea when assessed by scanning laser tomography which is thought to occur as a result of reflections from the curved surface of the foveal pit (Fitzke FW, personal communication). This artefact is of a relatively small magnitude, however, when compared with the topographical change exhibited by the subjects described in this study (with the exception of case 2). Indeed, loss of the artefactual foveal elevation might be a relatively early sign of macular pathology since there is foveal detachment with loss of the normal foveal pit in the formation of a stage 2 macular hole.1 In addition, removal of the posterior vitreous face may affect the reflectivity of the retinal surface. Internal limiting membrane fragments have been found in epiretinal tissue removed during macular hole surgery.35 36 However, the greatest change in refractive index can still be expected to occur at the vitreous cavity/retinal interface and, therefore, the determination of retinal height in postoperative macular hole eyes will be valid.
Alternative techniques including laser biomicroscopy,37the objective measurement of retinal thickness,38 39 and optical coherence tomography40 41 offer the potential of more detailed information in the assessment of retinal morphology. Laser biomicroscopy permits the visualisation of the posterior hyaloid face, while objective measures of retinal thickness negate any assumptions concerning the stability of the reference plane. The resolution of both of these techniques, however, is limited by the intrinsic aberrations of the human eye. Interestingly, optical coherence tomography permits a depth resolution of 10 μm40 and, consequently, provides detail of the internal retinal structures. However, optical coherence tomography image acquisition time is 2.5 seconds and the influence of eye movements on image resolution is uncertain. In addition, optical coherence tomography only provides cross sectional information of retinal morphology (that is, not topographic).
Scanning laser tomography provides an objective evaluation of the outcome of macular hole surgery. Studies employing larger sample sizes are required to fully determine the clinical worth of the technique. However, the results from this pilot study would suggest that future studies of macular hole surgery should employ scanning laser tomography to define objectively the preoperative status of macular topography. As the surgical technique is further refined, the objective assessment of postoperative change in macular topography will aid the evaluation of new surgical methods and adjuvants.
Acknowledgments
This work was funded in part by a postdoctoral fellowship grant from the British Diabetic Association awarded to Dr Hudson.
References
Linked Articles
- Editorial