Article Text

Abstract
AIMS To determine if normal tension glaucoma (NTG) patients differ from age matched controls in blood flow to the peripapillary retina, as measured with confocal scanning laser Doppler flowmetry (cSLDF; “Heidelberg retinal flowmetry”).
METHODS 12 NTG patients and 12 age matched controls were compared using (a) 10 × 10 pixel boxes (the instrument default sample size), taken from the nasal and temporal peripapillary retina, (b) the average from two of these boxes, and (c) every qualifying pixel within the peripapillary retina.
RESULTS Patients and controls did not differ in blood flow measured using the default sample from a single 10 × 10 pixel box, placed in either the temporal or nasal peripapillary retina, or expressed as the average from these two boxes. However, in histograms using every pixel from the peripapillary retina, NTG patients displayed significantly higher percentages of minimal flow pixels (defined as less than one arbitrary unit of flow: 30% v 19%, p <0.01), and significantly lower flow in the 25th, 50th, and 75th percentile flow pixel (each p <0.05) than did age matched controls.
CONCLUSION NTG is characterised by reduced blood flow in the peripapillary retina, a result suggesting that blood flow deficits accompany, and perhaps may contribute to, disease development in these patients.
- glaucoma
- retina
- blood flow
- laser Doppler flowmeter
Statistics from Altmetric.com
Glaucoma may result from the programmed death of retinal ganglion cells,1 2 as initiated by complex factors that include mechanical compression and ischaemia.1-3 Seen in these terms, it is apparent that defining the level of blood flow in and around the optic nerve head is an important goal for visual science—to test hypotheses regarding blood flow and disease, to determine disease severity, and to monitor treatment interventions.
Several lines of evidence suggest that patients with normal tension glaucoma (NTG) may suffer from ocular blood flow deficits. In these people, vascular resistance downstream from the central retinal and posterior ciliary arteries is increased,4 5choroidal filling times are prolonged,6 areas of indocyanine green hypofluorescence are increased in the peripapillary region,7 and diffuse ischaemia may exist throughout the brain.8 However, these haemodynamic markers provide no direct information about perfusion of the retina or optic nerve head. In this study, confocal scanning laser Doppler flowmetry (cSLDF) was used to determine capillary blood flow in the peripapillary retina near the optic nerve head.9 Previous studies that have used this technique have failed to detect a perfusion difference between controls and patients with NTG.10 11 However, those experiments utilised the default 10 × 10 pixel sampling box, a method that exhibits a high coefficient of variation when repeated on a weekly basis.12 In this study, in addition to conventional analysis, we utilised a new methodology that includes every qualifying pixel within the entire cSLDF image.12 Besides measuring the distribution of low and high flow pixels within the sample, this novel method reduces the coefficient of variation of repeated measurements by nearly 50%.12
Patients and methods
SUBJECTS
Twelve patients (seven women, five men; mean age 54 (SD 3) years) and 12 age and sex matched controls with normal eye examinations (eight women, four men; mean age 49 (3) years) were recruited for study. A homogeneous group of patients with early stage normal tension glaucoma were recruited from the Indiana University Hospital Glaucoma Service. All patients had either substantial optic disc cupping (C/D ratio ⩾0.8), or a combination of less severe cupping (C/D ratio 0.6 to 0.7) and visual field defects measured as either mean deviation (MD) or corrected pattern standard deviation (CPSD). For the group of 12 patients, C/D ratio averaged 0.7 (SD 0.1), MD averaged 4.2 (4.9) dB, and CSPD averaged 6.37 (5.44) for the central 24-2 of Humphrey automated perimetry. All subjects had intraocular pressure less than 21 mm Hg (mean IOP 16 (2) mm Hg), with normal diurnal curve measurements. Gonioscopy indicated open anterior chamber angles in all patients, and none had a history of orbital or ocular trauma. Both patients and controls were free from any history of hypertension or diabetes. Before participating, subjects signed informed consent to procedures reviewed and approved by an institutional review board. All experimental procedures conformed to the tenets of the Declaration of Helsinki.
EXPERIMENTAL DESIGN
Patients and controls were each studied on a single occasion. The eye with the more severe visual field defect was chosen in patients; the right eye was examined in controls. Patients ceased all ocular and systemic medications for 3 weeks before study.
PROCEDURES
Examination technique
With the subject’s head and chin comfortably secured, he or she fixated on a letter on an acuity chart placed 8 feet behind the operator. When the operator had positioned the camera, the subject fixated on a single portion of a letter until measurements were complete.
Data acquisition
In video mode, the cSLDF (Heldelberg retinal flowmeter; Heidelberg Engineering; GmbH, Heidelberg, Germany) images a 2560 × 2560 μm area of retina or optic nerve head with a scanning 785 nm diode laser. Green lines on the operator screen mark the boundaries of the 2560 × 640 μm area from which flow data are derived. After this area is scanned, the cSLDF computer performs a fast Fourier transform to extract the individual frequency components of the reflected light. From each 10 × 10 μm pixel in the scan, a power spectrum is calculated: the frequency location on the x axis represents a blood velocity, while the height of the spectrum at that point represents the number of blood cells required to produce that intensity. Integrating the spectrum yields a value proportional to the total number of red blood cells times their velocity: this “blood flow” is determined in arbitrary units.
ANALYSIS FROM THE INSTRUMENT DEFAULT “SMALL BOX”
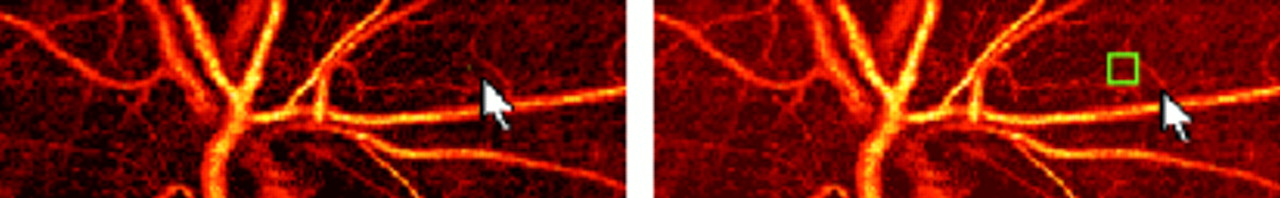
A single sample box 10 × 10 pixels in size (100 × 100 μm), free from motion artefact and major vessels, is selected within the image. During each measurement session two of these small boxes were chosen for each subject—one each within the temporal and nasal peripapillary retina. When the retinal plane is in focus the neuroretinal rim area is too dark and the cup is posterior to the focal plane and hence out of focus. A single flow value was generated from each small box, and a mean flow from the two small boxes was determined for each subject. Figure 1 (right) shows typical placement of the 10 ×10 pixel box, approximately 100 μm from the disc margin.
Confocal scanning laser Doppler flowmetry (cSLDF) of peripapillary retina. Left: arrow indicates 1 × 1 pixel (10 × 10 μm) measurement window, which, for pixel by pixel analysis, is moved over the entire image for data collection (large vessels and areas with inadequate focus (including rim and cup areas posterior to the focal plane) are excluded). Right: arrow indicates 10 × 10 pixel (100 × 100 μm) measurement window for conventional analysis, placed approximately 100 μm from the disc margin.
Analysis from the entire image
When flow histograms are generated from the entire image, flow is recorded for every pixel within the 256 × 64 pixel image. Figure 1 (left) shows the 1 × 1 pixel sampling window. After elimination of pixels that contain major vessels, are poorly focused, or are improperly illuminated, the remaining values are sorted on the basis of flow. As with the 10 × 10 pixel box, the retinal plane is in focus, while the rim and cup area, posterior to the focal plane, remain very dark and excluded from analysis. For each subject, the number of pixels with less than one arbitrary unit of flow (“minimal flow pixels”) is determined as a percentage of total pixels, and the flow in the pixel at the 25th, 50th, 75th, and 90th percentile of flow is determined.
STATISTICAL ANALYSIS
Comparisons of values obtained from patients and controls were made using two tailed unpaired t tests, with p <0.05 regarded as significant.
Results
PATIENTS V CONTROLS: DEFAULT SMALL BOX ANALYSIS
Patients and controls did not differ in cSLDF measurements of blood flow using the default 10 × 10 pixel box in either the temporal or nasal peripapillary retina. In addition, the two groups did not differ in flow when values obtained from these two areas were averaged. Group mean values for blood flow, as measured at each site, and the average from the two sites, are shown in Table 1.
Blood flow in 100×100 μm boxes in normal tension glaucoma (NTG) patients and controls
PATIENTS V CONTROLS: ENTIRE IMAGE ANALYSIS
Approximately 1200 pixels, obtained from the entire peripapillary retinal image, were included for an average subject in this phase of the study. This number, which did not differ between patients and controls, represents a sample size approximately 12-fold greater than that obtained from the default 10 × 10 pixel box. The percentage of these qualifying pixels that contained minimal flow was significantly increased in NTG patients (Table 2). In addition, flow in the pixels at the 25th, 50th, and 75th percentile of flow were significantly reduced in the patients as compared with controls (Table 2).
Pixel by pixel flow analysis in normal tension glaucoma (NTG) patients and controls
Discussion
In this study we found reduced peripapillary retinal capillary blood flow in normal tension glaucoma (NTG) patients compared with age matched controls, using analysis of the entire confocal scanning laser Doppler flowmeter (cSLDF) image. These reductions presented as increased areas of minimal flow in NTG patients. The preponderance of minimal flow and other low flow areas, compared with the age matched controls, indicates reduced flow within pixels at the 25th, 50th, and 75th percentile flow in NTG patients. These capillary perfusion differences were not detectable using “default” analysis of 10 × 10 pixel boxes, as placed within either the nasal or temporal peripapillary retina, or as averaged from these two areas.
The cSLDF was developed to measure capillary perfusion of tissue close to the site of nerve damage in glaucoma patients.9 13 14 Our findings directly document blood flow reductions within the peripapillary retina in NTG. These results are consistent with more indirect estimates of ocular perfusion (from indocyanine green angiography, colour Doppler imaging, and whole brain magnetic resonance imaging) suggesting that vascular dysfunction characterises this illness.4-8 Recent studies also suggest that primary open angle glaucoma (POAG) patients may suffer from blood flow reductions at the optic nerve head and in the peripapillary retina, further suggesting that blood flow deficits may be a consistent finding in glaucoma, independent of IOP.15 16
The cSLDF accurately measures blood flow in an artificial capillary tube (r = 0.97, p <0.0009), providing results similar to commercially available laser Doppler flowmeters.17 The method also displays coefficients of reliability near 0.85 for immediately repeated volume, velocity, and flow measurements from 10 × 10 pixel sampling sites.17However, long term reproducibility from these small sampling boxes is less adequate, with the coefficient of variation of measures repeated each week18 for 4 weeks averaging 30% of the mean.12 A smaller sampling area (for example, a 4 × 4 pixel box19) exacerbates these problems, and is even less reproducible than the larger box.19 However, broadening the analysis to include every qualifying pixel within the entire image (in this study, every qualifying pixel within the peripapillary retina) improves test/retest reliability, reducing the coefficient of variation of repeated weekly measurements to ∼15% of the mean for selected portions of the flow histogram.12 This increase in sensitivity likely results from a simple increase in data density: even after elimination of data from large vessels and pixels that are inadequately focused, the number of pixels included in entire image analysis in this study was approximately 12-fold higher than that obtained from the default small box. The reduction in coefficient of variation from 30% to 15%, obtained by shifting from default small box analysis to pixel by pixel analysis, reduces the sample sizes required for a given statistical power by a factor of four.18
Consequently, in this study comparing 12 controls with 12 NTG patients, measurements from the default small box detected no differences in blood flow, while histograms generated from the entire image found significant differences between the two groups. Previous studies of peripapillary retinal and optic disc rim flow in glaucoma have found conflicting results, with some authors finding reduced flow in (POAG) patients,16 while others find similar levels of perfusion in POAG and NTG patients, and control subjects.10 11 Although these earlier studies involved relatively large sample sizes (up to 40 in a group10 11 16), the use of the default 10 × 10 pixel box suggests that prior conflicting results may arise in part from low reproducibility of this method.
Some earlier work suggests that cSLDF may occasionally detect vessels and blood flow in the choroid.11 This inference, drawn from finding focal areas of high blood flow in many glaucoma patients,11 could not be supported by the results of this study. Rather, blood flow readings were consistently decreased in NTG patients. Perhaps, in these patients with early stage illness free from severe retinal thinning, sampling depth is insufficient for detection of choroidal perfusion. Of course, these speculations do not rule out the possibility that vascular dysfunction in NTG may also include overall or regional aspects of the choroidal circulation itself.6
Although our results directly show reduced peripapillary retinal capillary perfusion in NTG, they do not prove that vascular insufficiency causes pathology in this disease. Rather, while these results find reduced perfusion associated with disease, they cannot distinguish cause from effect. It is possible that factors unrelated to blood flow (for example, mechanical compression that alters transport of neurotrophins20) accelerate ganglion cell apoptosis, while vascular deficits appear later,1 20 although the normal IOP seen in these patients argues against a purely mechanical causation. Consequently, the possibility remains open that blood flow deficits are at least in part cause, rather than entirely consequence of disease: chronic, low grade ischaemia in the brain does stimulate neural cell apoptosis,2 and in vivo models show that induced optic nerve ischaemia leads to glaucomatous optic neuropathy.21
In summary, in this study cSLDF entire image analysis detected substantial reductions in capillary perfusion of the peripapillary retina in NTG patients compared with controls. The increase in minimal and low flow regions in these tissues in NTG show that reduced perfusion is certainly a correlate, and possibly a contributing cause, of the retinal ganglion cell death that defines this disease.
Acknowledgments
Supported in part by NIH grant EY10801 (Dr Harris), by an unrestricted grant from Research to Prevent Blindness, and the CS First Boston Research Fund of the Glaucoma Foundation. Dr Harris is the 1995 William and Mary Greve International Research Scholar.