Article Text

Abstract
AIMS To investigate the intraobserver and interobserver repeatability of optic disc measurement using a new digital optic disc stereo camera.
METHODS 112 consecutive new patients presenting to a glaucoma service had dilated optic disc photography performed using a new digital stereo camera (Discam, Marcher Enterprises Ltd, Hereford). The images were analysed by two masked observers using a stereo viewer and computer simulated stereopsis. Vertical and horizontal cup:disc ratios (CDR), cup area:disc area, and cup circumference:disc circumference were computed. Intraobserver and interobserver repeatability analyses were performed. Intraclass correlation coefficients (ICC) and 95% tolerance for change (TC) were computed.
RESULTS 220 optic discs were photographed, of which 196 were suitable for analysis (10 were of poor image quality and 14 had anomalous discs). Mean age of patients was 65 years, 60 were male and 48 female. For intraobserver measurements of: horizontal CDR, ICC = 0.94, TC = 0.11 (15% of range); vertical CDR, ICC = 0.92, TC = 0.14 (16% of range); cup area:disc area, ICC = 0.95, TC = 0.10 (13% of range), and cup circumference:disc circumference, ICC = 0.95, TC = 0.09 (14% of range). For interobserver measurements of: horizontal CDR, ICC = 0.89, TC = 0.14 (19% of range); vertical CDR, ICC = 0.90, TC = 0.14 (16% of range); cup area:disc area, ICC = 0.92, TC = 0.13 (16% of range), and cup circumference:disc circumference, ICC = 0.90, TC = 0.12 (17% of range). Systematic bias between observers was within acceptable limits.
CONCLUSIONS Digital stereo disc photography and analysis provide repeatable measures of optic disc variables. The results compare favourably with ophthalmoscopic and stereophotographic methods of assessment of the optic disc.
- computerised image analysis
- optic nerve head
- cup:disc ratio
- glaucoma
Statistics from Altmetric.com
It is generally believed that the progression of glaucomatous visual field defects follows changes in the optic disc morphology.1-6 As such, a great deal of recent interest has centred upon the search for a reliable method of optic disc assessment which will allow detection of early and progressive optic disc damage.
Since the early 1980s a variety of new imaging tools have appeared which attempt to evaluate quantitatively the topography of the optic disc and nerve fibre layer. Although some appear promising, none as yet has gained wide acceptance within the clinical setting. Subjective stereophotographic evaluation of optic disc, therefore, remains the clinical gold standard against which the newer technologies are compared. However, it too is not without problems as interobserver agreement is variable and sometimes poor (Table 1).7-13 A recent study has even questioned whether stereophotographs are any better than disc drawings in detection of progressive optic nerve damage.19
Magnitude and percentage disagreement for intraobserver and interobserver assessments of cup-disc ratios
Of paramount importance when looking to identify temporal optic disc change is the repeatability/variability of the measurements performed. The whole process of assessment from image collection, through processing, to the data output must be tested and proved in appropriate study populations in order to be useful in the clinical setting.
A new digital stereodisc camera (Discam, Marcher Enterprises Ltd, Hereford) has recently become available. The machine provides a convenient method for obtaining and storing a digital monochromatic sequential stereophotographic electronic record of the optic disc with a software package to enable the operator to define and compute those optic disc variables commonly used in the clinical setting (vertical and horizontal cup to disc ratios and cup area to disc area ratios). We have investigated the intraobserver and interobserver repeatability of these measurements in a new referral glaucoma clinic.
Methods
A total of 112 consecutive new patients presenting to the glaucoma service at Bristol Eye Hospital between 5 August 1998 and 14 October 1998 had digital optic disc stereophotography of both eyes performed using a new digital stereo camera (Discam, Marcher Enterprises Ltd, Hereford). An important feature of this stereo camera is a moving shutter which allows a single monochromatic charge coupled device to take sequential disparate images of 512 × 512 pixels of resolution of the optic disc and peripapillary retina. All images were acquired by a single experienced operator following pharmacological mydriasis.
Ocular fixation was achieved using a combination of an internal and external light emitting diodes. Several images (typically three to four) were taken of both eyes until it was judged that an optimal image had been obtained—that is, little movement between the sequential frames, equal image illumination, contrast, and clarity. Where it was not possible to obtain a good quality image of the disc the reason was recorded.
Images of both eyes were used in the analysis in order to provide large and approximately equal numbers of left and right discs. Optic discs of anomalous configuration—tilted, colobomatous, highly myopic—were excluded from analysis.
The images were analysed by two observers masked to the diagnosis (GNS, CHK). The first observer defined which images were to be used in subsequent analysis on the basis of movement between the sequential frames, image illumination, contrast, clarity, and stereoscopic appearance, and evaluated each image on two separate occasions over a 2 week period. A second observer then analysed the same images.
An initial impression of the optic disc topography was gained by “flickering” the two stereo images on a high resolution computer screen. Subsequently, a hand held stereo viewer (Screen-Vu Stereoscope, USA) was used to view simultaneously displayed monochromatic stereo images (Fig 1) while first the edge of the optic disc and then the optic cup were drawn using a computer mouse. The edge of the optic disc was defined as the inner edge of the scleral ring while the edge of the cup was defined on the basis of neuroretinal rim contour (the point at which the cup first seems to deviate posteriorly).
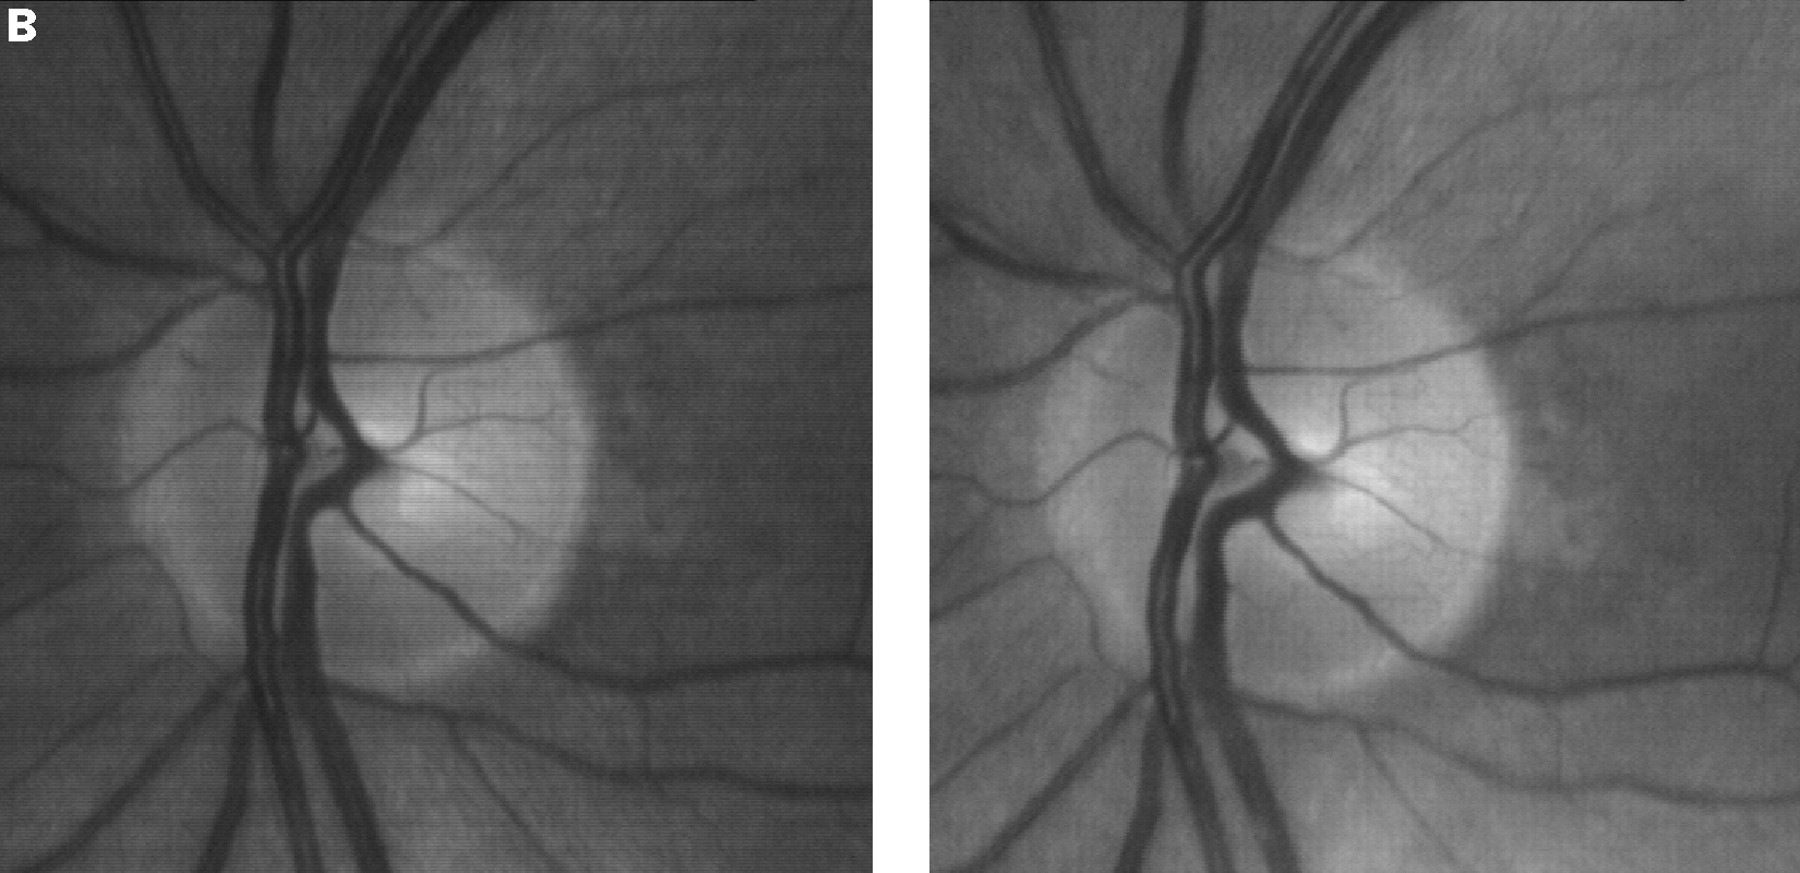

Two examples of the stereo images obtained.
Vertical and horizontal cup:disc ratios (CDR) were computed using the software supplied. A feature of these computed ratios is that they are measured along the vertical and horizontal meridians centred upon the centre of gravity of the delineated disc rather than along the maximum vertical and horizontal disc dimensions. In addition, cup area to disc area ratios and cup circumference to disc circumference ratios were computed.
A statistical analysis of the variability of both intraobserver and interobserver measures was then performed. Histograms showing the distribution of the difference between measurements were produced to demonstrate the normality of the data. Scatter plots of repeated measurements and of measurement differences plotted against measurement averages were produced to determine whether variability was related to the size of the absolute measurements. Statistical analyses employed to analyse measurement variability were 95% tolerance limits for change (TC) and the intraclass correlation coefficient (ICC).
The 95% tolerance limits for change are derived by multiplying the standard deviation of the difference between repeated measurements by 1.96 (t (df) for 95%). Dividing this figure by the range of all measurement values expresses the tolerance for change as a percentage of the data range, allowing for more meaningful comparisons between different measurement variables. The intraclass correlation coefficient produces a measure of the consistency or agreement of the repeated values within cases. The remainder is attributable to intraclass variability or error.
A variety of other statistics have been used by investigators when analysing variability including Pearsons's correlation, confidence limits of differences, coefficients of variation (CV = standard deviation/mean), kappa statistics, and percentage disagreements. To allow some form of comparison with other studies, CVs have been computed and disagreements of ⩾0.2 CDR units have been expressed in percentages.
Results
A total of 220 optic discs were photographed in 112 patients. Three eyes were not imaged because the pupil was not pharmacologically dilated and one because the pupil would not dilate because of the presence of posterior synechiae.
Of these 220 optic discs, 196 from 108 patients (60 males and 48 females, mean age 65 (median 66)) were deemed suitable for analysis; 10 were of poor image quality owing to moderate to severe lenticular opacity and a further 14 had an anomalous configuration (myopic, tilted, colobomatous discs).
In total, 11 of 221 eyes (5.0%) either could not be photographed or the images obtained were of too poor quality for analysis. Of the 196 discs analysed, 98 (50.0%) were from normal, 48 (24.5%) from glaucomatous, and 49 (25.0%) from glaucoma suspects eyes (including ocular hypertension). One other had an ischaemic optic neuropathy.
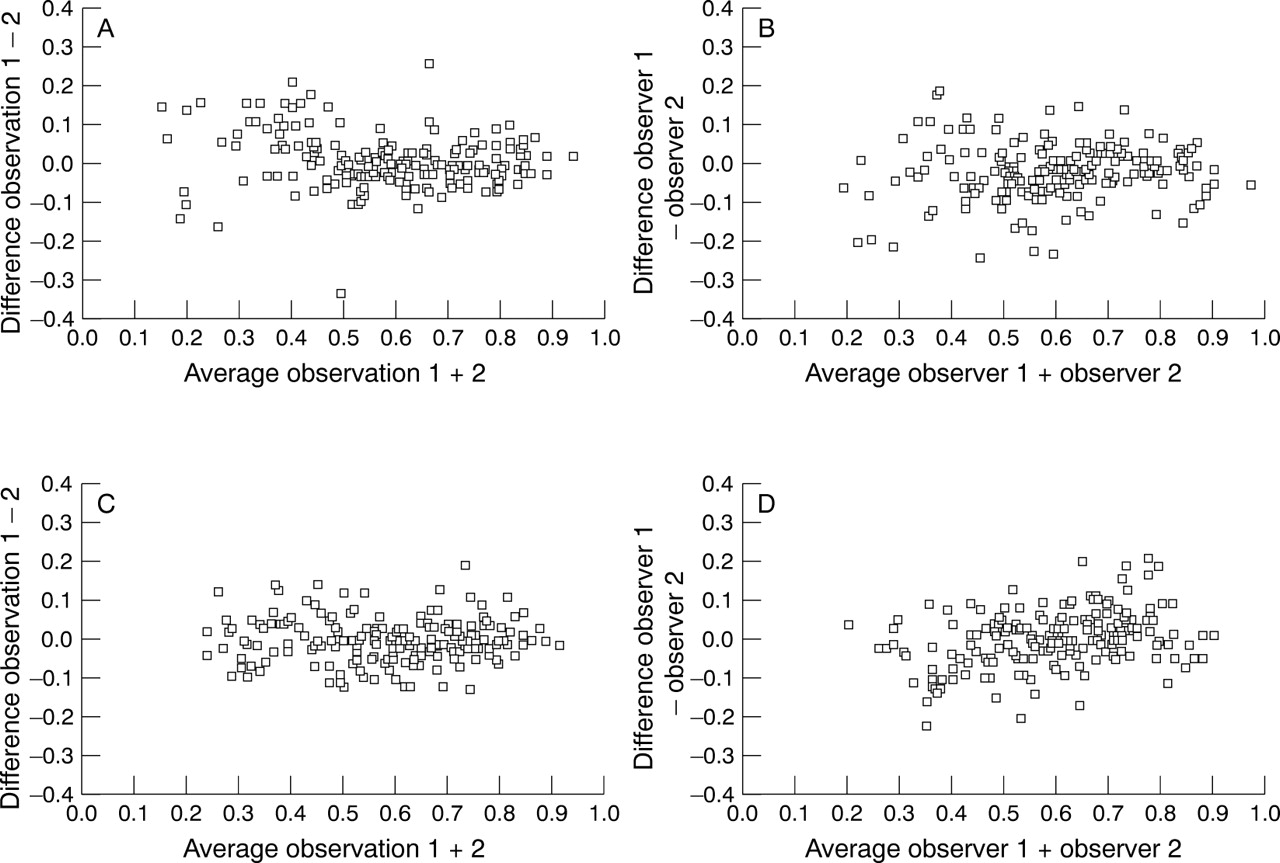
Intraobserver and interobserver variability results are shown in Table2. The distributions of the difference between observations plotted as histograms were all approximately normal and scatter plots of repeated measurements showed close agreement. Scatter plots of measurement difference plotted against measurement average showed that the magnitude of any difference was unrelated to the size of the measurements with perhaps the exception of vertical CDR differences (Fig 2).
Intraobserver and interobserver variability statistics
Scatter plots of intraobserver and interobserver vertical CDR measurement difference plotted against measurement average demonstrating that the magnitude of any difference is inversely related to the size of the measurements. (A) Intraobserver scatter plot of difference in vertical CD ratios plotted against the average CD ratio. (B) Interobserver scatter plot of difference in vertical CD ratios plotted against the average CD ratio. (C) Intraobserver scatter plot of difference in horizontal CD ratios plotted against the average CD ratio. (D) Interobserver scatter plot of difference in horizontal CD ratios plotted against the average CD ratio.
Analysis of intraobserver variability revealed no systematic bias between the two sets of measurements. For horizontal CDR the ICC = 0.94 and the 95% tolerance limit for change = 0.11 (15% of range). For vertical CDR the ICC = 0.92 and the 95% tolerance limit for change = 0.14 (16% of range). For cup area: disc area ratios the ICC = 0.95 and the 95% tolerance limit for change = 0.10 (13% of range), and for cup circumference:disc circumference the ICC = 0.95 and the 95% tolerance limit for change = 0.09 (14% of range).
Analysis of interobserver variability revealed a very small systematic bias between the two observers apparent for both vertical cup:disc ratio (difference = 0.017 units, p = 0.001) and area cup:disc ratio (difference 0.001, p = 0.045). Interobserver variation was similar but slightly larger than the intraobserver variation. For horizontal CDR the ICC = 0.89 and the 95% tolerance limit for change = 0.14 (19% of range). For vertical CDR the ICC = 0.90 and the 95% tolerance limit for change = 0.14 (16% of range). For the cup area:disc area ratio the ICC = 0.92 and the 95% tolerance limit for change = 0.13 (16% of range), and for cup circumference:disc circumference the ICC = 0.90 and the 95% tolerance limit for change = 0.12 (17% of range).
Discussion
Stereoscopic methods of photographic optic disc assessment are considered to be better than monoscopic methods,11 while simultaneous fixed angle stereo images show less variation than pseudo stereo images (sequential or non-fixed angle).20-22However, both clinical and photographic methods of optic disc assessment involve a subjective evaluation of the optic disc topography by a clinician and as such are not always reliable (Table1).7-13 Despite these difficulties, stereo optic disc photography remains the standard against which new technology is compared.
This study has shown that the Discam digital stereo disc camera, when used by two experienced observers, appears to be as reliable as conventional stereophotographic assessments (Table 1) and better than clinical optic disc assessment.13 The monochromatic nature of the images does not seem to detract from the stereoscopic assessment of optic discs. In only 5% (11/221) of eyes were disc images unobtainable or of too poor quality for analysis. Of these, 10 were of poor image quality because of the presence of moderate to severe lens opacities, while in one other the pupil would not dilate because of the presence of posterior synechiae. Given the age of the sample studied this figure would seem reasonable.
The variability that this study measures relates only to the measurement process and only to two observers. In particular, it does not assess the variability associated with repeated image acquisition. This may be important given that the stereo images are captured sequentially and are subject to some degree of eye movement and hence variable stereo angle. However, this study provides useful information relating to those processes that are likely to be the most observer dependent.
Although there was no systematic intraobserver bias, a small systematic bias was apparent between the observers (for vertical cup:disc ratio and area cup:disc ratio). However, these were small and unlikely to be of clinical significance.
The scatter plots of repeated measurement difference plotted against measurement average for the vertical CDR (Fig 2) showed a slight tendency for the differences to be greater towards the lower end of the measurement range. This may reflect greater difficulty in determining the margins of small cups and may be analogous to the progressively decreasing CVs reported for normal discs, ocular hypertensive discs, and glaucomatous discs by other investigators.16 However, the same tendency was not apparent for horizontal CDR scatter plots. An alternative explanation which may account for this finding relates to the method used to determine the CDRs. The software computes the CDRs along vertical and horizontal meridians through the centre (of gravity) of the optic disc centre. As the centre of the optic cup is probably prone to more horizontal than vertical variation, small variations in the horizontal location of the centre of disc would be accentuated in the vertical CDR measurements. This would be particularly apparent with small cups.
Intraobserver (repeatability) tolerance limits for change were smaller than the corresponding interobserver (reproducibility) limits for all measurement variables, while intraclass correlation was very significant for all. The magnitude of these limits, however, suggests that in the population studied, a change of approximately 13–16% in any variable would be required before a single observer could decide that this change is real and beyond measurement noise with 95% confidence. The change would need to be in the order of 16–19% to allow different observers to do the same. CDR differences of 0.2 CDR units or more were more common between interobserver than intraobserver measurements but were infrequent and compare favourably with similar sized CDR differences derived from other work (Table 1).
The use of conventional measures of cup to disc ratios to describe optic disc morphology is convenient and obviates the need for measurements of refraction, axial length, and keratoetry which are required for calculations of absolute disc measurements. However, large optic discs have larger optic cups and simple ratios will fail to differentiate between normal and abnormal.23 This is less important if we are interested in optic cup changes with time but will weaken the ability of the instrument to determine abnormality in cross sectional study.
Discam allows rapid acquisition of sequential stereodisc photographs with measurement of those optic disc variables that are commonly used in the clinical setting. Moreover, measurements can be undertaken in “real time” while the patient is still in the clinic. This study suggests that Discam generates usable images from the majority of glaucoma clinic patients and that subjective evaluation of the images demonstrate favourable intraobserver and interobserver repeatability. Furthermore, the results compare favourably with ophthalmoscopic and stereophotographic methods and clinical assessment of the optic disc. Modifications to cup to disc ratio calculations may lead to further improvements. The clinical utility of this new camera requires further investigation and longitudinal analyses are awaited.
Acknowledgments
We would like to acknowledge the statistical guidance of Mr J M Sparrow, Bristol Eye Hospital.