Article Text

Abstract
AIMS To examine the changes in the retinal nerve fibre layer (NFL) thickness with age and myopia in normal population.
METHODS Retinal nerve fibre layer thickness was measured with a scanning laser polarimeter (NFA-I) in 180 normal subjects of varying age (range 7–83 years) and in 110 eyes of 85 patients with myopia of varying degrees (range −1.00 to −15.00D). They were all voluntary Anatolian people. Superior to nasal (S/N), inferior to nasal (I/N), and the superior to inferior (S/I) ratios were used for the assessment of retinal NFL thickness.
RESULTS The mean superior NFL ratio was 2.96 and the mean inferior NFL ratio was 2.93 in normal subjects. There was a gradual decrease in NFL ratio with increasing age (simple regression analysis, p<0.05). The mean S/I ratio was 1.01 with a large variation. In patients with myopia, the mean superior NFL ratio was 2.60 and the mean inferior NFL ratio was 2.72. Superior and inferior NFL retardations, and S/I ratio in myopic patients were significantly (15.5%, 10.8%, and 4.9% respectively) lower than that of age matched normals (ttest, p<0.05). There was also a gradual decrease in NFL thickness with increasing degree of myopia (simple regression analysis, p<0.05).
CONCLUSIONS Nomograms we obtained for retinal NFL thickness may serve as reference points for the assessment of normal Anatolian people and myopic patients in future studies. NFL thicknesses gradually decreased with increasing age. Patients with myopia had significantly lower NFL thicknesses than normal subjects and, although weakened by wide age range of myopic group, there is a linear relation between severity of myopia and NFL thickness in myopic patients.
- scanning laser polarimeter
- age
- myopia
Statistics from Altmetric.com
Scanning laser polarimeter (Nerve Fibre Analyser I (NFA-I); Laser Diagnostic Technologies Ltd, San Diego, CA, USA) is one of the first clinical devices for quantitative assessment of the retinal nerve fibre layer (NFL) thickness in the living human eye. It measures the amount of retardation that is caused by the specific arrangement of the microtubules of the retinal ganglion cells. When a polarised light beam passes through the microtubules in the retinal NFL, the light is shifted from phase. The amount of phase shift is called retardation and is correlated linearly with the thickness of the retinal NFL.1 2 Each degree of retardation was found to correspond with an NFL thickness of approximately 7.4 μm in two enucleated monkey eyes.1
Weinreb and associates found significant differences in retardation between normal and glaucomatous eyes in the superior and inferior arcuate regions in their first studies with this instrument.3 Previous studies on the reproducibility of measurements with the scanning laser polarimeter suggest that it provides reproducible measurements especially if performed by the same operator.4-6 The specificity and sensitivity for detection of glaucoma have been reported to be 93% and 96% respectively with the NFA-I.7 A new study by Choplinet al, using the newest version of the instrument, the NFA-GDx, suggested that there was a clear delineation between normal subjects and glaucoma patients with no overlap between the 95% confidence intervals using some variables like the superior maxima.8 The NFA was suggested to be used for glaucoma screening studies.7 8
Nomograms for retinal NFL thickness of different ages, ethnic groups, and different refractive stages are needed to define the normals. Many studies have been done on variation of NFL thickness measurements with age and ethnicity by scanning laser polarimetry,9-12 but the effect of refractive changes on NFL thickness measurements with the scanning laser polarimeter is still not clear.
It is widely known that primary open angle glaucoma, pigmentary glaucoma, and low tension glaucoma are more prevalent in highly myopic patients than in others.13 14 The occurrence of a defect in retinal NFL in severe myopia (8%) was also shown to be greater than that in either emmetropia or hyperopia (1%).15 NFL retardation in myopes may therefore be different from that in emmetropes.
In the present study, we aimed to obtain nomograms for the retinal NFL thickness of different ages in healthy Anatolian people and of patients with different degrees of myopia by using scanning laser polarimetry.
Patients and methods
Polarimetric measurements were obtained in randomly selected eyes in each of 180 healthy volunteers and in 110 eyes of 85 myopic patients during a 7 month period. Only one eye of the myopic subjects was included in the study when the refractive errors were same in both eyes. The subjects in the study groups comprised hospital personnel, students in the medical faculty, and volunteers who applied for the correction of their refractive errors or for minor problems (for example, blepharitis, allergic conjunctivitis). They were all Anatolian people. All individuals were examined for visual acuity (corrected and uncorrected), refractive error, intraocular pressure (IOP), and anterior and posterior segment pathologies. Individuals with a family history of glaucoma or any history of ocular disease were excluded from the study. Subjects suspected of glaucoma because of the disc appearance (cup/disc (C/D) ratio of ⩾0.4 or asymmetry in C/D ratio between fellow eyes greater than 0.2) or because of the high IOP measured (IOP >21 mm Hg), were examined for the visual field defects and they were excluded from the study.
Healthy volunteers with a refractive error of less than plus or minus 1.00D or presbyopia are included in the normal subject group. The mean age of the normal subjects was 40.3 years (range 7–83 years) and of the patients with refractive errors was 30.2 years (range 7–63 years). An age matched control group was formed by a random selection from the normal population of the same ages in this study. Myopic patients had a mean spherical equivalent refractive error of –4.56D (SD 2.72D) (range −1.00 to −15.00D); 21 of them had a myopia over −6.00D.
We measured the retinal NFL thickness by using a scanning laser polarimeter (NFA-I, NFA version 2.1.17) which uses a light source consisting of a near infrared diode laser (wavelength 780 nm). The field of view is 15° and retardation was measured within a 10 pixel wide band located concentrically with the disc margin at 1.75 disc diameters. Mean absolute retardation was calculated for superior (120°), inferior (120°), and nasal (50°) regions. We used the relative ratios to increase the precision of the instrument (because the NFA-I does not supply an absolute calibration) which were obtained by dividing the superior and inferior values with the nasal value, as suggested by Tjon-Fo-Sang et al.6 Multiple images were obtained for each eye and the best one was selected for measurement. Our criteria for a good image were a sharply focused image, centrally located optic disc, and equal illumination in all segments of the image. All of the measurements were performed by the same operator (SCÖ) who was masked for the refractive state of the subjects.
We had difficulty in obtaining good quality images from eyes with myopia over −15.0D because the axial length of these globes exceeded the range of the focus adjustment knob of the instrument. We were not able to get a good focused image of these eyes.
Simple regression analysis was applied to determine the effect of age and myopia on NFL ratios, and the Student'st test was used for the comparison of NFL ratios of age matched normal subjects with those of myopic patients.
Results
The recorded NFL thickness in each randomly chosen eye of the 180 normal subjects is presented as a function of age in Figure 1. On average, the superior NFL ratio was 2.96, with a 95% confidence interval (CI) of between 2.87 and 3.06 (range 1.54–4.63). Similarly, the mean inferior NFL ratio was 2.93, with a 95% CI of between 2.86 and 3.01 (range 1.60–4.08).

(A) Nomogram for the ratio of superior to nasal nerve fibre layer (NFL) thickness plotted against the age of the subject. Equation for the regression line: superior NFL= 3.531 − 0.014 × age R2= 0.154 (p<0.0001). (B) Nomogram for the ratio of inferior to nasal NFL thickness. Equation for the regression line: inferior NFL= 3.407 − 0.012 × age R2= 0.159 (p<0.0001).
To assess any asymmetries between the superior and inferior NFL, we determined the S/I NFL ratio for each eye. The S/I NFL ratio averaged 1.01 with a large variation: a total range of 0.66 to 1.91 (95% CI, 0.98 to 1.03). There was no consistent change with age.
We also found that the superior and inferior NFL gradually decreased with age. Simple regression analysis of superior NFL ratios yielded a gradual and significant decline with age (p<0.0001) (Fig 1A). The equation for the regression line was superior NFL = 3.531–0.014 × age (years) (R 2= 0.154). Regression analysis of inferior NFL ratios yielded a similar decline with age (p<0.0001) (Fig 1B). The equation for the regression line was inferior NFL = 3.407–0.012 × age (years) (R 2= 0.159). The slope of the regression line of the superior NFL was −0.014 and, that of the inferior NFL was −0.012 which indicated a linear correlation of the NFL thickness with age. There was no consistent change in S/I ratio with age.
The superior and inferior NFL ratios in subjects with myopia and in age matched control group were recorded. The mean superior NFL ratio for the matched control subjects was 3.08 (range 2.11–4.63), whereas for patients with myopia, this was significantly lower at 2.60 (range 1.12–4.08) (t=−6.75, p<0.0001). Similar results were obtained for the inferior NFL ratio. The mean inferior NFL in the matched controls was 3.05 (range 2.08–4.08), as opposed to a mean of 2.72 (range 1.44–4.01) in patients with myopia, which was also statistically significantly lower (t=−4.91, p<0.0001). The mean S/I ratio in the myopic group (0.96) was found to be significantly (4.9%) lower than that of the age matched control group (1.01) (t=−2.803, p=0.0062).
Totally, the mean RNFL ratios in myopic group were 15.5% and 10.8% less than the control group in the superior and the inferior parts respectively.
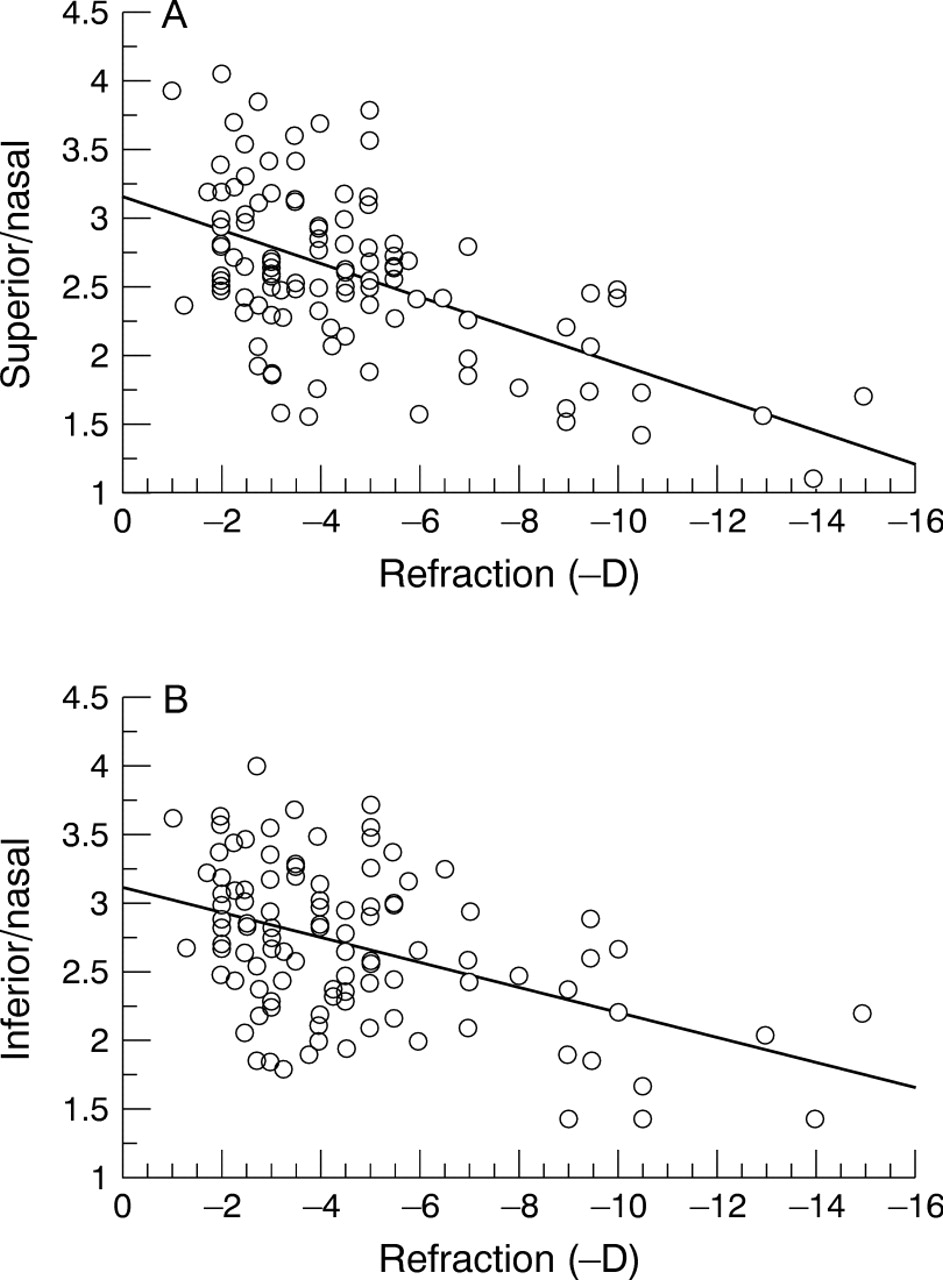
We also investigated the effect of degree of myopia on NFL thickness and found a gradual decrease of NFL with increasing myopia. The recorded superior and inferior NFL ratios in myopic patients are presented in Figure 2 as a function of degree of myopia independent of age. The relation between degree of myopia and NFL ratio was linear and the equation for the regression line was superior NFL = 3.158–0.122 × myopia (D) (R 2= 0.306) (p<0.0001). The equation for the regression line of inferior NFL was inferior NFL = 3.142–0.092 × myopia (D) (R 2= 0.204) (p<0.0001). There was no consistent change in S/I ratio with myopia.

(A) Nomogram for the ratio of the superior to nasal NFL thickness plotted against the refraction (minus dioptres) of the myopic subject. Equation for the regression line: superior NFL= 3.158 − 0.122 × refraction (D) R2= 0.306 (p<0.0001). (B) Nomogram for the inferior to nasal NFL thickness plotted against the refraction of the myopic subject. Equation for the regression line: inferior NFL= 3.142 − 0.092 × refraction R2= 0.204 (p<0.0001).
Discussion
Nomograms for the NFL thickness in white and black subjects have been presented before10 11 but since the present study is the first one which has been performed on Anatolian people, these nomograms may serve as a reference for recordings in eyes with glaucoma in this population. Data from our population showed a great variability in NFL thickness between individuals, even between individuals of the same age. This variability in NFL thickness between normal subjects is speculated to be the result of individually variable prenatal regression of retinal ganglion cells.16 This may be the most important factor against the use of the NFA, and possibly any other device measuring NFL thickness, for glaucoma screening purposes. NFL thickness measurements, on the other hand, may have an important role in follow up of glaucoma patients to show any minor progress.
In our normal subjects, we found a relative NFL thinning with age at the superior and inferior poles (slope of regression line = −0.014 and −0.012 respectively) (Fig 1A, B) which is in accordance with the literature.9 10 12 Although a mean S/I ratio of 1.01 indicates a good symmetry between superior and inferior poles, there was a large range (0.66 to 1.91) and variability (95% CI, 0.98 to 1.03).
We found a mean superior NFL ratio in myopes (2.60) that was 15.5% less than that in matched control subjects (3.08). Difference in the mean inferior NFL ratios was less; the mean inferior NFL in myopes (2.72) was 10.8% less than that in control subjects (3.05). Myopic patients had lower NFL ratios which probably make them susceptible to glaucoma. This finding is supported by some other studies.14 15 17-19
Chihara et al described severe myopia as a risk factor for progressive visual field loss in primary open angle glaucoma.17 They also reported higher prevalence of focal NFL defects in high myopes with oblique insertion of the optic disc.18 Glaucoma patients, on the other hand, have a longer axial length than people without glaucoma, and visual field defects are more pronounced in glaucoma patients with long axial lengths than in those with short axial lengths.19 Some have even hypothesised that it is the intraocular pressure, combined with biomechanically weak sclera, that causes elongation in the progressive myopia.20 The present study also supports a relation between glaucoma and high myopia.
This study has shown a significant linear relation between the degree of myopia and the NFL thickness. This linear relation, however, is weakened by the large age range of myopic group in the study. We could more reliably check the effect of the degree of myopia on NFL thickness if we could study on different degrees of myopic patients of the same age group.
Myopic eyes have some special features which may contribute to their difference in nerve fibre layer thickness. The axial length is greater in myopic eyes, and the optic discs are frequently abnormal in shape; they are mostly much larger than normal,21 horizontally oval, have cyclotorsion, or are obliquely inserted.22 A large disc size, tilted disc, or thin and abnormal collagen fibres may be predisposing factors for abnormal nerve fibre layer defects. All these factors also add to the difficulties in measurements with NFA, in locating the band concentrically with a disc margin with indistinct borders.
Myopic patients had a mean S/I ratio of 4.9% lower than that of matched normals. We may suggest that NFL thinning in myopia is more evident in the superior half and inferior part is better preserved, which is contrary to previous reports in which inferior temporal thinning of the neuroretinal rim was reported to occur first as an early finding in primary open angle glaucoma.23 Increased incidence of the inferior defects was also reported in myopic eyes with deformed discs and inferior parapapillary chorioretinal atrophy.18 This controversy may be explained by the birefringence of the visible sclera caused by the inferior parapapillary chorioretinal atrophy, which causes increased retardation measurement mimicking thick retinal NFL. This topic needs further study.
In conclusion, NFL thickness in healthy Anatolian people gradually decreased with increasing age. Patients with myopia had a significantly lower NFL thickness than normal subjects and NFL thickness in myopic patients decreased with increasing degree of myopia. This linear relation between severity of myopia and RNFL thickness, however, is weakened by the wide age range of myopic subjects in the study. The nomograms we obtained for retinal NFL thickness may serve as reference points for the assessment of normal subjects and myopic patients in future studies.