Article Text

Abstract
AIMS To determine whether parasol retinal ganglion cells (magnocellular pathway) are selectively lost in the primate model of glaucoma.
METHODS Ocular hypertension was induced in one eye of six Macaca fascicularis monkeys for 6–14 weeks. The retinal ganglion cells in these eyes were labelled retrogradely with the tracer horseradish peroxidase (HRP) implanted into the optic nerve and subsequently examined in retinal whole mount preparations. The degree of retinal ganglion cell loss was estimated from Nissl stained tissue by comparison with the contralateral untreated control eye.
RESULTS In the three glaucomatous retinas with the best labelling 1282 cells could be classified, of which 182 were parasol cells and 1100 were midget cells. Linear regression analysis did not demonstrate a significant reduction in the proportion of parasol to midget cells with increasing cell loss (regression slope 0.023, 95% CI −0.7 to 0.11). Compared with the control eye the cell soma of the remaining retinal ganglion cells in glaucomatous eyes were reduced in size by 20% for parasol cells (p=0.003) and by 16% for midget cells (p <0.001).
CONCLUSION The results of this study do not support the hypothesis that selective loss of parasol retinal ganglion cells occurs in experimental glaucoma. In addition, the change in cell soma size distributions following ocular hypertension suggests that both parasol and midget retinal ganglion cells undergo shrinkage before cell death.
- retina
- ganglion cell
- glaucoma
- optic nerve
- intraocular pressure
Statistics from Altmetric.com
The hypothesis that larger retinal ganglion cells are selectively lost in the early stages of glaucoma1-4 has received considerable support. This is important in terms of our understanding of the mechanisms of retinal ganglion cell death and is also clinically relevant since psychophysical tests that are tuned to the properties of these cells should reveal the earliest signs of disease.
Evidence for selective cell death has come from anatomical studies of the retinal ganglion cell layer and optic nerve in the human and primate. Analysis of retinal ganglion cell soma distribution shows a selectively greater reduction in the proportion of larger retinal ganglion cells2-4 with a corresponding loss of larger axons1 5 in the optic nerve. Since the retinal ganglion cell size and axon size correlate broadly with retinal ganglion cell type6 it is reasonable to conclude that the observed changes in the distribution of cell sizes reflect changes in the distribution of cell types. Indeed, anterograde transport of radioactive tracer to the lateral geniculate nucleus (LGN) shows a selective decrease in labelling to the magnocellular layers7 that would be expected if these were selectively denervated. A postmortem study of the LGN in glaucomatous patients has also been interpreted as consistent with selective damage to those retinal ganglion cells comprising the magnocellular pathway.8
Anatomical evidence for preferential loss of a class of retinal ganglion cells rests on the assumption that the relation between cell type and cell size is preserved in glaucoma. A recent study, based on intracellular labelling of retinal ganglion cells in experimental glaucoma, has revealed changes in dendritic morphology and a reduction in retinal ganglion cell volume that precede cell loss.9If this finding holds true, inferences about the pattern of retinal ganglion cells death in experimental glaucoma based on cell soma or axon size distributions should be viewed with caution.10
One possible shortcoming with intracellular techniques is that selection bias can occur when labelling individual neurons. In the present study, we therefore adopted a different approach to studying changes in the parasol and midget retinal ganglion cell population in experimental glaucoma by labelling retinal ganglion cells with the tracer horseradish peroxidase (HRP) applied to the optic nerve. Large populations of retinal ganglion cells can be labelled with this technique6 though uniform labelling may be compromised in glaucomatous animals because of the effects of ocular hypertension on retrograde axonal transport.11 The proportions of identified parasol cells (relative to the parasol and midget cell population) were measured in retinal areas with different degrees of retinal ganglion cell loss. Soma sizes were measured in these cells and compared with the soma size distribution for HRP labelled cells in an untreated (non-glaucomatous) retina.
Methods
Seven adult Macaca fascicularismonkeys were used in this study. Animal use conformed to the ARVO statement for the use of animals in research. The study was approved by the animal care and use committee at Alcon Laboratories Inc (Fort Worth, TX, USA). All animals had baseline examinations that included tonometry, slit lamp, and fundus examinations and colour fundus photography. Ocular hypertension was induced in the right eye of six animals by argon laser to the trabecular meshwork with an established method.12 Intraocular pressures were measured twice weekly with a pneumotonometer (Alcon Applanation Pneumatograph, Alcon, Inc) after laser treatment and weekly once a stable increase of intraocular pressure had been achieved. The seventh animal was left untreated as a control for cell soma size studies.
Intraocular pressures were last measured on the morning of surgery and then reduced to less than 22 mm Hg with a combination of topical apraclonidine 0.5%, levobunolol 0.5%, and pilocarpine 4% as required. Retinal ganglion cells were labelled retrogradely following direct implantation of HRP into the optic nerve.6Horseradish peroxidase (type VI, Sigma) was dissolved in sterile water and absorbed onto small pieces of Gelfoam (Johnson and Johnson, Inc). Once dry, the Gelfoam could be trimmed to the appropriate size for implantation. Animals were sedated with ketamine (10 mg/kg intramuscularly) and deep anaesthesia maintained with sodium thiopentone (0.25–0.5 ml intravenously every 15–20 minutes). Oral secretions were minimised with atropine 60 μg/kg intramuscularly. The airway was maintained via endotracheal intubation and respiration monitored with an apnoea alarm. Core temperature was monitored with a rectal probe and kept in the range of 37–38°C with a heating pad.
The optic nerve was exposed with a lateral orbital approach. The overlying dura was incised and a diagonal cut made in the nerve to permit implantation of the HRP gel. Once the gel was buried in the nerve, the incision was sealed with a patch of wax paper fixed in place with cyanoacrylate adhesive applied to the external surface. The periorbital tissues and incision in the temporalis muscle were closed in layers. Incision sites were infiltrated with 2% xylocaine at the end of the procedure.
The IOP was checked as soon as the animal had recovered and at 24 hours. Topical ocular medications were administered as required to keep the IOP at less than 22 mm Hg. The optic nerve head was examined on the first postoperative day by slit lamp stereomicroscopy. Clinical assessment showed the retinal circulation to be normal in all animals selected for detailed analysis.
At 36–48 hours after labelling, the animals were deeply anaesthetised with a lethal dose of sodium thiopentone and perfused transcardially with chilled 0.9% saline followed by 1% paraformaldehyde in phosphate buffer (pH 7.4). The retina was rapidly dissected from the eye under phosphate buffer and then mounted ganglion cell side up in a dish of chilled 2% glutaraldehyde in 0.1M phosphate buffer under a coverslip, on top of which was placed a 4 g weight. Following 45 minutes of additional fixation, the retina was washed several times over 2 hours in 0.1 M phosphate buffer. The retina was then reacted for HRP using the modified Hanker Yates protocol of Perry and Linden.13 14
HRP labelled retinas were initially analysed in phosphate buffer under a sealed coverslip. Cell soma outlines were drawn at ×400 with a camera lucida and digitised for the calculation of cell soma size (Image Pro 1.0, Media Cybernetics). The slide was mounted on a microscope stage equipped with digital micrometers that permitted the location of any retinal area to an accuracy of 10 μm; individually labelled cells could be relocated with ease using this system. The retinal sampling grid was chosen to approximate the 24-2 field of the Humphrey visual field analyser. The relation between retinal distance and visual angle is not linear and for the macaque, sampling intervals on the retinal surface were determined using a second order polynomial equation y = 0.1 +4.21x + 0.03x,2 15 16 where y is the visual angle and x the distance in mm at the retinal surface with points measured from the centre of the fovea. A 240 × 353 μm sampling grid was then placed at 700 μm intervals. The sampling frequency was increased in more central retina as shown in Figure1.
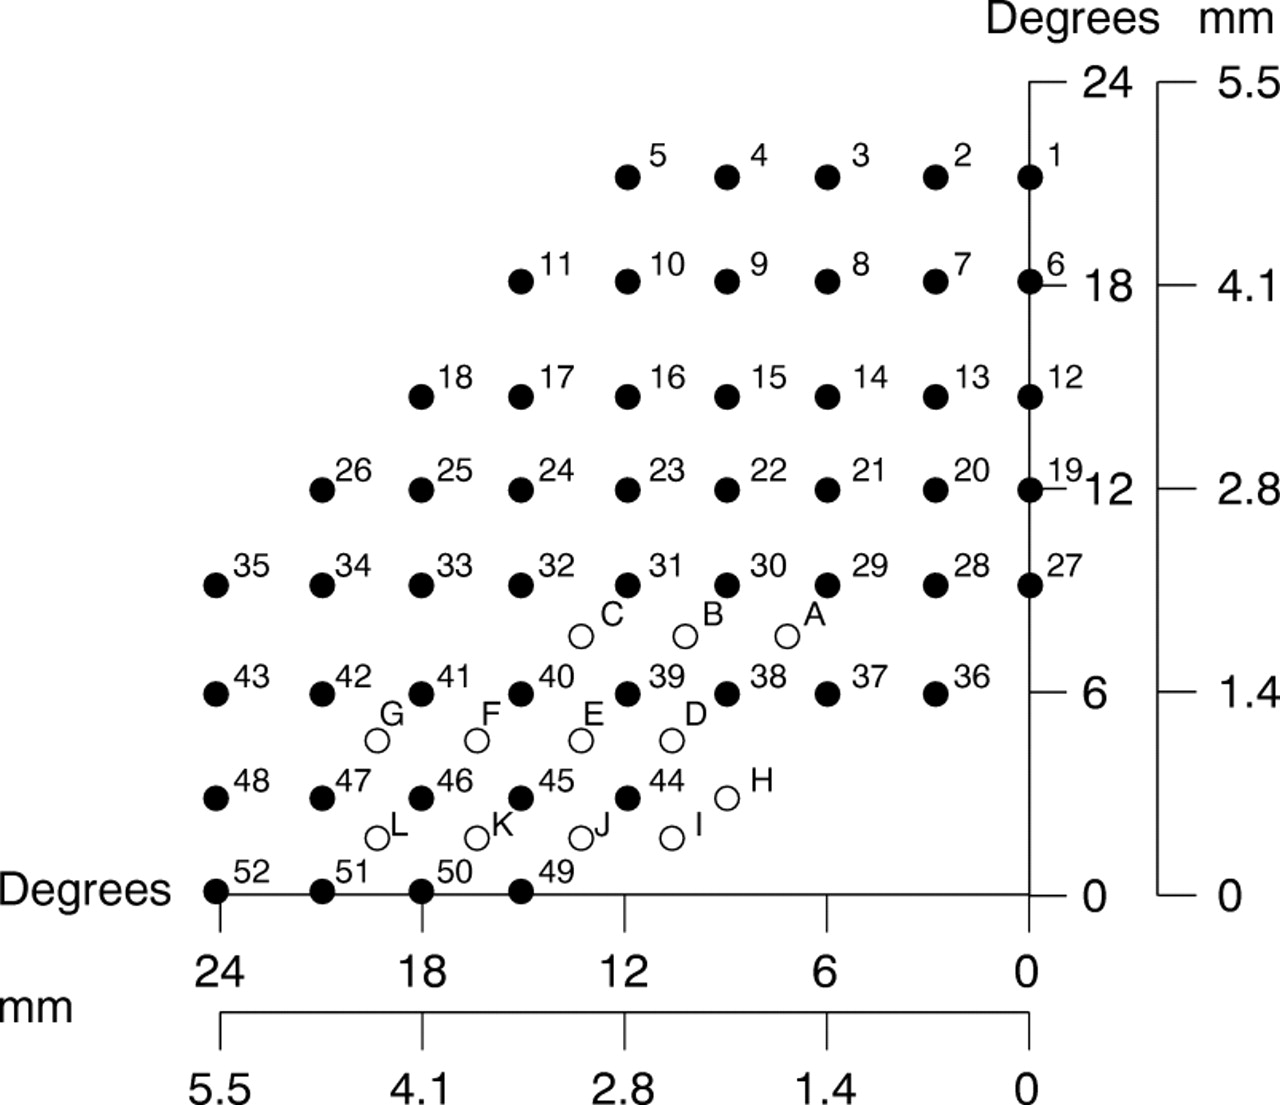
Sample grid used to count numbers of labelled and unlabelled cells. Spacing of sample points approximates in degrees the spacing of stimuli presented in automated perimetry with a Humphrey visual field analyser. The same areas have been numbered 1–52. Additional sample areas for more central locations are also shown (A–L). The visual field location corresponding to these retinal locations is given in degrees. The equivalent distance on the retinal surface is given in mm. On each axis, 0 corresponds to the centre of the fovea.
Labelled retinas were dehydrated and cleared to permit better identification of dendritic morphology. In any sampled area, labelled cells were marked as midget, parasol, or untyped when cell classification was not possible; in each case, the observer was masked with respect to the degree of retinal ganglion cell loss. Cell identification required sufficient dendritic filling to identify at least the primary and secondary dendritic branching patterns. Parasol cells were identified by their stout primary dendrites, radiate dendritic tree,6 17 18 and prominent axon hillock. Midget cells were identified by the presence of one, sometimes two, primary dendrites which gave rise to a compact dendritic tree that terminated at a deeper level in the inner plexiform layer.17
Both retinas from each animal were finally counterstained with 0.05% cresyl violet19 and the degree of cell loss in the labelled retina estimated by comparison with corresponding areas in the contralateral retina matched to within 250 μm of retinal eccentricity. Differences in eccentricity of this magnitude do not result in significant differences in cellular characteristics.6 Retinal ganglion cells were identified by their well stained cytoplasm and distinct nucleus.2Amacrine cells were distinguished by their darker staining nuclei and cytoplasm. Statistical analyses were performed withsigmastat (2.03) (SPSS Science). Weighted regression analysis was performed using S-Plus (3.0) (Mathsoft, Cambridge, MA, USA).
Results
The HRP labelling and retinal histology were of sufficient quality in the untreated control animal and three of the ocular hypertensive animals to allow cell classification and provide the data described in this study. The changes in intraocular pressure over time for the treated animals are summarised in Table 1.
Summary of cells counted and characterised in the three (ocular hypertensive) retinas studied in detail
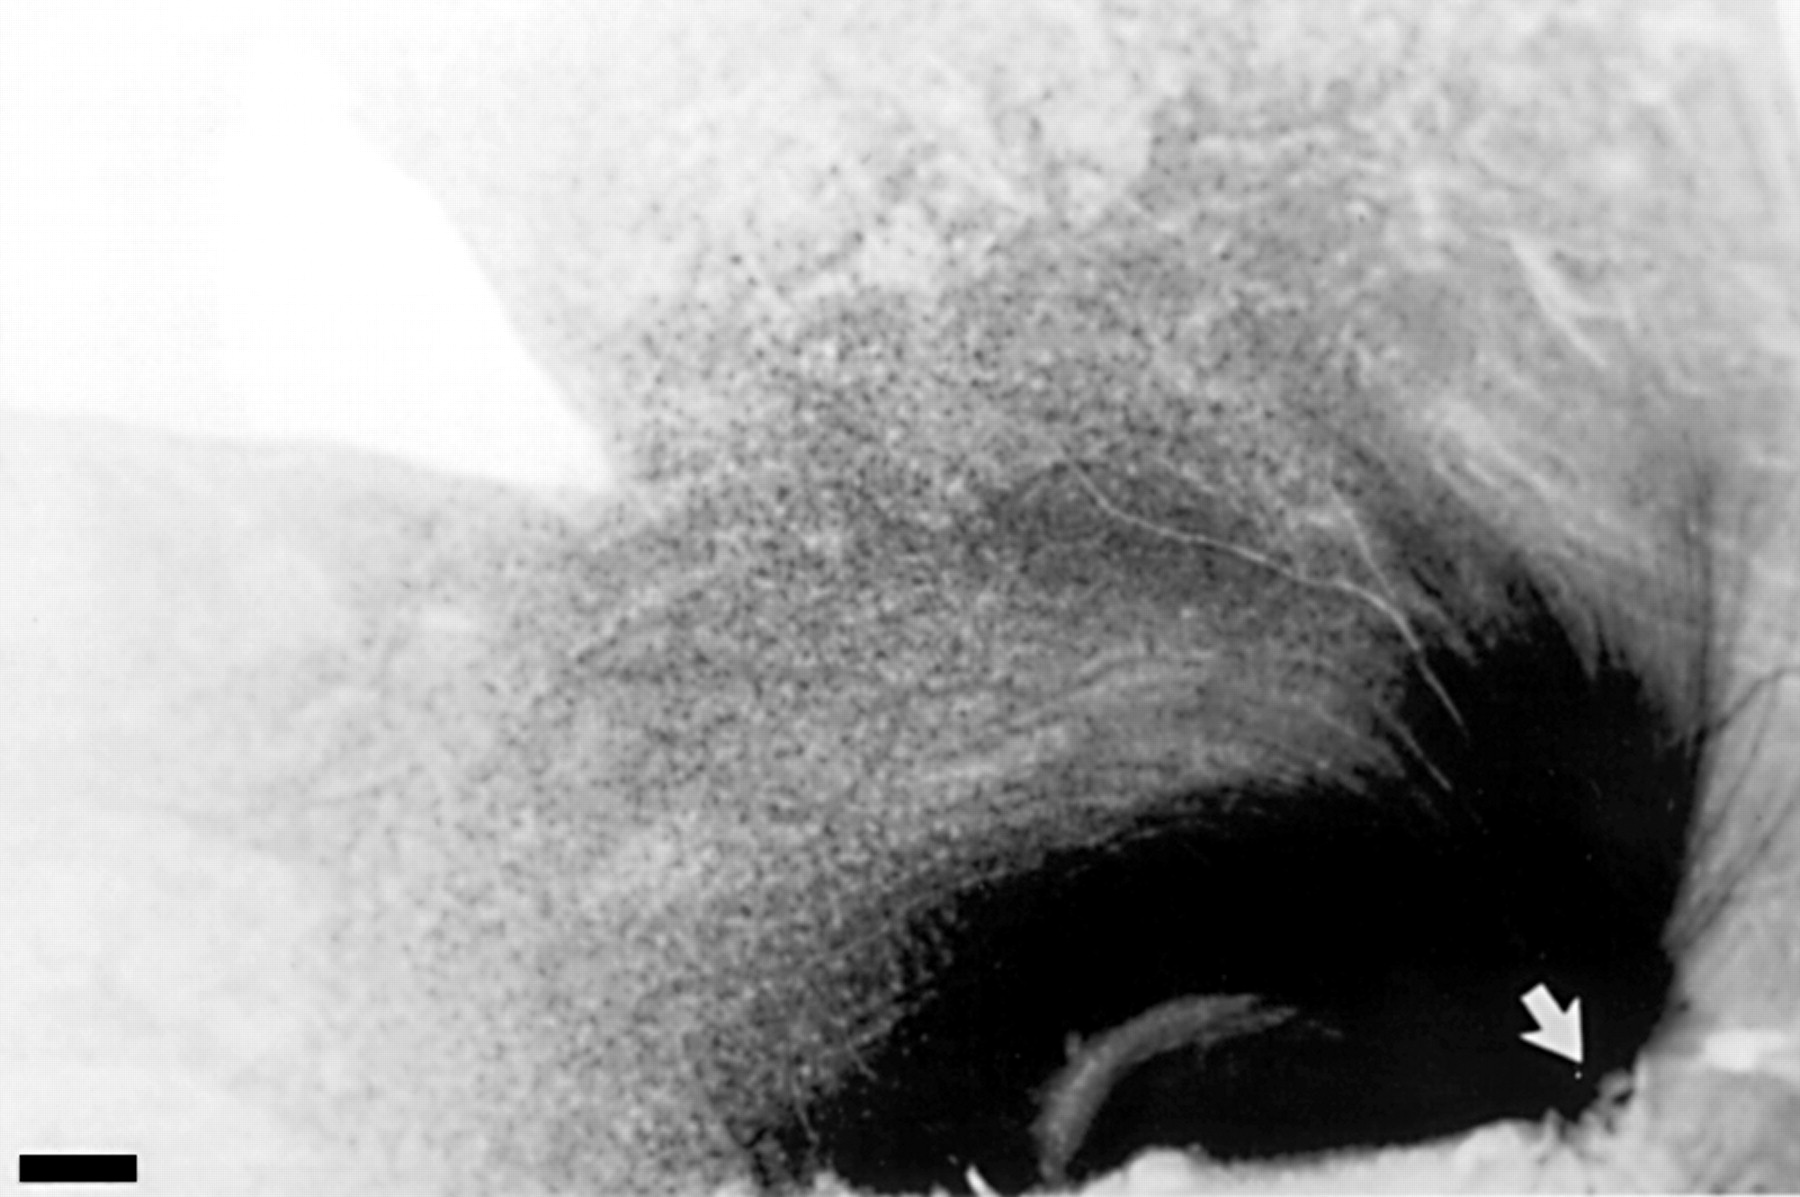
The characteristic distribution of HRP label following optic nerve implantation corresponded, in terms of visual field, to a region that is examined with the 24-2 testing program of the Humphrey perimeter (Fig 1) and can be seen in a low power photomicrograph of the retina (Fig 2). HRP implants were made in the dorsolateral part of the optic nerve which is easily accessible with the lateral orbital approach. In two animals, clinically visible optic nerve head damage was slight when measured in terms of cup to disc ratio (<0.8). In the third animal (1491), a notch developed in the neuroretinal rim (superotemporal quadrant, Fig 3) that coincided, topographically, with the location of the HRP gel deposit and with a zone of retinal ganglion cell loss. We observed that the cup-disc ratio was reduced when the IOP was lowered, in agreement with reports that the optic disc is compliant in the primate glaucoma model.9 20 We therefore estimated the extent of retinal ganglion cell loss by comparison with retinal ganglion cell counts in the contralateral retina rather than on the basis optic disc appearance.

Low power photomicrograph showing the pattern of retinal ganglion cell labelling in a macaque (animal 1487) with experimental glaucoma. The arrow indicates the focus of HRP labelling at the optic nerve head. Labelling was confined to the superotemporal retinal quadrant. Scale bar 1 mm.

Optic disc photograph showing thinning of the superior neuroretinal rim following ocular hypertension 4 days before HRP labelling (animal 1491). The arrow shows thinning of the neuroretinal rim and the quadrant of the optic nerve in which the HRP implantation was made. The contralateral normal disc is shown for comparison.
A high power photomicrograph of typical parasol and midget cells in ocular hypertensive eyes is shown in Figure 4. With both cell types, characterisation of a dendritic tree required focusing throughout the tissue section to provide details of dendritic morphology that are not apparent on a single photomicrograph. This is shown in Figure 5 in which many of the dendritic processes are out of the plane of focus of the cell bodies. The primary dendrites and dendritic tree of parasol cells had a radial distribution, typically with three to four primary dendrites per cell. By contrast, midget cells had a solitary primary dendrite (Fig 5) with a dendritic tree that was more compact and not symmetric about the cell body.6 21 Beading was noted in the dendrites of parasol and midget cells as reported for both normal and glaucomatous primate retina.6 9

Labelled cells in animal 1487. Eccentricity 7.35 mm. Typical parasol and midget cells are indicated (large and small arrows respectively). Scale bar 100 μm.

High power photomicrograph of retinal ganglion cells labelled with HRP in animal 1487. Eccentricity 2.4 mm. Large arrow indicates typical parasol cells. Small arrow indicates typical midget cells. Scale bar 50 μm.
Cell characterisation was easiest at eccentricities (relative to the centre of the fovea) above 2–6 mm; at less than 1.4 mm, retinal ganglion cells were very densely packed, making classification difficult. Cell sampling was made at eccentricities ranging from 1.4 mm to 5.5 mm to match the Humphrey visual field grid shown in Figure 1. In total, 2496 labelled cells were inspected in retinas with ocular hypertension and, on average 58.4% (range 22.8–100%, 1282 cells) could be classified as belonging to either parasol (182 cells) or midget (1100 cells) classes (Table 1). In the animal in which the untreated retina was labelled with HRP, 3719 cells were analysed, of which 57.6% (range 34.2–81.6%) could be classified in this way.
Figure 6 shows the relation between the relative proportion of classified parasol and midget cells (expressed as the ratio of parasol to the combined population of parasol and midget cells at any sample location) and retinal ganglion cell loss. In six sample areas the percentage cell loss was negative because the cell count in the contralateral control retina was below that in the experimental retina. The regression lines for the parasol cell proportion on the percentage cell loss have been weighted either for the total number of classified cells (that is, parasol and midget cells) at each location (mean 24.7 (SD 15.3)), 52 sample locations across three eyes) or for the number of Nissl stained cells (mean 873.6 (225.7)) used to calculate the degree of cell loss. All the regression lines showed a small positive slope (0.023, 95% confidence interval 0.07 to 0.11, weighted for the numbers of typed cells size) indicating that this study did not demonstrate a selective reduction in the size of the parasol cell population with increasing cell loss. As cell loss increased the proportion of parasol cells did not decrease and remained in the region of 13–19%. When cell loss is plotted against the parasol cell proportion (relative to all labelled cells, typed and untyped) we were also unable to see a significant decrease with increasing cell loss (r = 0.06, slope = −0.017, 95% confidence interval −0.09 to 0.06, unweighted regression).

Plot of the proportion of parasol cells to the sum of identified parasol and midget cells against cell loss. Samples were taken from 52 locations in three eyes. The unweighted regression line is continuous. The broken regression line is weighted for the number of typed cells (that is, P+M). The dotted line is weighted for the numbers of stained retinal ganglion cells used to estimate the degree of cell loss. Points corresponding to the animals providing these data (1487, 1491, and 1494) have been plotted with different markers.
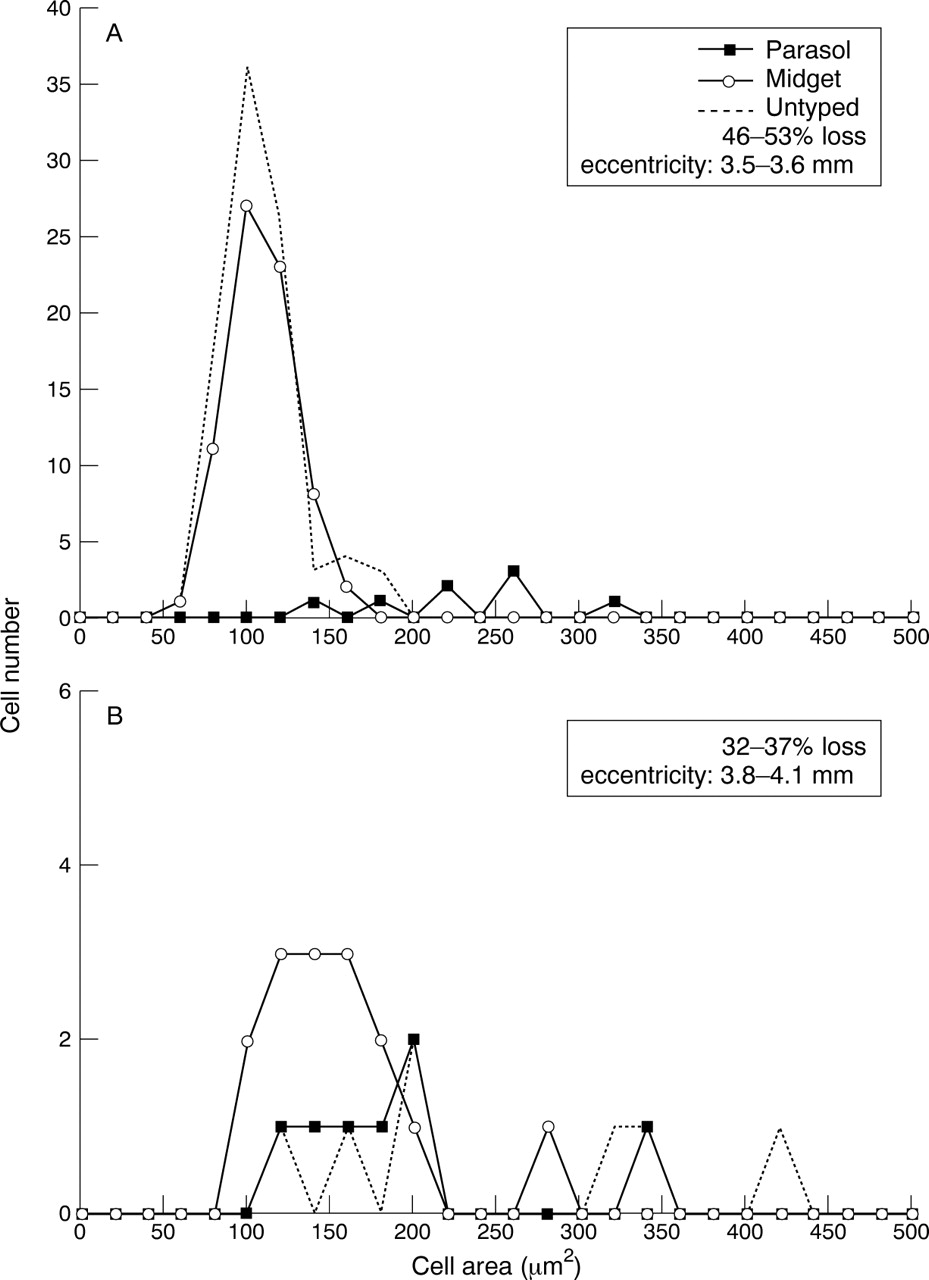
Analysis of the changes in cell soma size with various degrees of cell loss showed a number of patterns. Figure 7 shows an example of the cell soma size distribution in the untreated retina in which retinal ganglion cells were labelled with HRP. The distribution of soma sizes for the untyped labelled cells is also shown and can be seen to overlap the distribution of typed parasol and midget cells. When expressed relative to all labelled cells (typed and untyped) the mean proportion of parasol cells was 5.2% (range 1–10.8%) in the control retina. If the untyped cells are removed from the calculation the parasol cell proportion increases to 8.8% (range 2.7–18.2%). Typical cell soma size distributions for the retinas from the ocular hypertensive eyes for cell loss ranging from 32% to 53% are shown in Figure 8. Figure8A shows the distribution of cells soma sizes pooled from three sample areas in one retina with eccentricities in the range 3.5–3.6 mm and shows a clear population of parasol cells for retinal areas with up to 50% cell loss. The ratio of parasol cells to all typed cells (parasol and midget) for this population is 7.5%. The lower plot in which the corresponding ratio is 30% (Fig 8B) is interesting for the number of parasol cells with cell soma sizes that are much smaller than would be expected in the normal retina. In all plots there is a tendency for cells to have smaller soma sizes than the control population.

Histogram of cell soma size from for the normotensive eye. Sample areas were pooled with eccentricities in the range 3.5–3.8 mm. The broken line shows the soma sizes of cells that were insufficiently filled with HRP to be typed. Open circles = midget cells; solid squares = parasol cells.

Histogram of cell soma size from for eyes with ocular hypertension. Samples have been pooled in each case for the eccentricity ranges shown on the plot. The range of cell loss for the regions in which these cells were analysed is also shown. The broken line shows the soma sizes of cells that were insufficiently filled with HRP to be typed. Open circles = midget cells; solid squares = parasol cells.
In order to observe the overall change in cell soma size as a function of ocular hypertension, we pooled the cell soma sizes for cells in the eccentricity range 3.5–4.5 mm, the interval in which all the control cell soma sizes were obtained. The mean cell soma sizes are shown in Figure 9 for parasol and midget cells in the control and glaucomatous retinas. Cell soma size was reduced by 20% in parasol cells (p = 0.003, t test) and by 16% in midget cells (p <0.001, Mann-Whitney) relative to cells in the control retina. In Figure 10, in which parasol cell areas have been subdivided on the basis of cell loss, the greatest reduction in cell area was seen with cell loss below 20% (p <0.05 ANOVA). For regions with cell loss greater than 40%, cell areas were not statistically significant from the control retina. A similar picture was seen with the midget cell population in which significant reductions in cell area were seen with cell loss up to 60% (p <0.05, ANOVA). With cell loss exceeding 60%, cell soma sizes did not differ significantly from the control retina.

Comparison of mean cell soma sizes for parasol and midget cells in normal and glaucomatous retinas. Cells were pooled from eccentricities in the range 3.5–4.5 mm. The numbers on the bars indicate the number of cells to derive the mean soma area. Error bars show the standard deviation of the mean. Asterisks indicate that the difference in means is statistically significant (p <0.05).

(A) Mean cell soma size for parasol cells relative to the degree of cell loss relative to the contralateral eye. Error bars show the standard deviation of the mean. The numbers on the bars indicate the number of cells comprising the mean. Cells were pooled from eccentricities in the range 3.5–4.5 mm. NS = not statistically significant from control. (B) Mean cell soma size for parasol cells from the same range of eccentricities.
Discussion
A number of studies have reported the selective loss of larger retinal ganglion cells in glaucoma.1-4 Analysis of changes in the axon size distribution and cell soma size distribution show a reduction in the proportion of cells with larger soma sizes, suggesting a selective loss of cells belonging to the magnocellular (parasol) cell class. The results of the present study, based on the proportion of identifiable parasol to midget retinal ganglion cells in the primate model of experimental glaucoma, were not consistent with this being the predominant pattern of retinal ganglion cell death. Cell soma size analysis also revealed populations of large retinal ganglion cells in areas of high cell loss. These findings warrant consideration of the technical aspects of the present study.
The principal advantage of implanting tracer directly into the optic nerve is that it allows for non-selective labelling of retinal ganglion cells and permits an estimate of the proportion of relative cell types6 without the potential for bias that can occur when cells are labelled using intracellular techniques.9 21The disadvantage is that it relies on retrograde axoplasmic transport which can be disrupted in glaucoma.11 22-24 Our interpretation of the relative proportions of typed retinal ganglion cells assumes that the ratio of parasol cells to all the typed cells provides a reasonable approximation of the true ratio of the cell types. Since our estimate is based on the fraction of retinal ganglion cells that were sufficiently labelled to permit identification, it is important to consider the factors that could have biased the labelling of any particular cell population. For example, if axons were segregated on the basis of cell type in the retrobulbar optic nerve, this would influence the extent to which HRP was taken up by the different cell populations. Although this has been shown to occur in the optic tract,25 there is no evidence that this occurs in the optic nerve.26 27 The degree of cell filling may also influence the ease with which cells can be categorised. Parasol cells with their larger dendritic trees might require more label for categorisation compared with midget cells, but this would have resulted in an underestimation of the true parasol cell ratio.
The cell soma size data are interesting in that they show a reduction in the mean size of the surviving retinal ganglion cells. Taken on its own, this could be interpreted as evidence for selective loss of larger retinal ganglion cells belonging to both the parasol and midget cell classes. Two points argue against this conclusion. Firstly, the proportion of parasol cells relative to the population of typed (or typed and untyped) cells did not show a significant reduction with increasing cell loss. Secondly, we also found evidence in some cell distribution histograms of parasol cells that were smaller than expected at a given eccentricity (see Fig 8B). Recently, Weberet al 9 reported on the basis of large numbers of retinal ganglion cells labelled intracellularly in primates with experimental glaucoma, that cells in the glaucomatous retinas had smaller soma sizes compared with eccentricity matched normal retinal ganglion cells. For the eccentricity range in which we made our soma size comparisons (3.5–4.5 mm) we found a 20% reduction in parasol cell soma size and a 16% reduction in midget cell sizes compared with non-glaucomatous controls. By comparison, at 4 mm eccentricity, Weber et al 9found a reduction in the mean size of parasol cells of approximately 15% compared with 16% for midget cells. It is unlikely that this change in cell size is an artefact from histological processing since cell areas were measured in undehydrated retinas. Evidence for cell shrinkage is important since it is consistent with the concept that cells undergo a period of compromise before cell death in which they may be amenable to rescue by neuroprotective agents. The other important aspect of cell shrinkage is that since the relation between cell size and cell type is altered in glaucoma, caution should be exercised when inferring changes in the relative proportions of cell types from cell soma size measurements. According to previous estimates,10 data consistent with a selective effect could be produced if there were cell shrinkage on the order of 5–10%. This is well within the range of shrinkage reported by Weber9and that detected in the present study.
The novel finding from our data is that when cell loss exceeded 60%, cell areas did not differ significantly from those in the control retina. Although these plots represent relatively small cell populations, this trend was seen in both the parasol and midget cell populations when the retinas were analysed separately. It is possible that this relative increase in cell soma size represents a loss of cell volume regulation secondary to neuronal ill health. For example, in the rat, retinal ganglion cell soma sizes will increase following axotomy before returning to near normal cell size.28 It is also possible, that the relative increase in cell size reflects attempts by the remaining retinal ganglion cell to increase retinal coverage, a phenomenon that has been described in developing retina.13 29 Consistent with this, some increase in dendritic field size has been reported in the primate model during early glaucomatous damage,9 though this is slight.
Other attempts to identify distinct populations of retinal ganglion cells have suggested some selective susceptibility to experimental glaucoma. Vickers et al 30showed a selective reduction of retinal ganglion cells immunostained for neurofilament proteins in the primate. The staining technique identified cells with neurofilament proteins but also labelled many more cells (24–43%) in normal retina than would be expected if this stain were specific for parasol cells. Selective loss of neurofilament immunostaining is consistent with the loss of the larger parasol and midget cells but since midget cells would have contributed 50%–75% of the staining in this study the question still remains as to the selective vulnerability of these cell types. When the LGN is examined in these animals, neurochemical changes (synaptophysin and cytochrome oxidase labelling) are seen in both the magnocellular and parvocellular laminae.31 This could be interpreted as evidence of non-selective damage but it is difficult to relate this to the numbers of surviving or dead cells. Histological analysis of the changes in neuronal density in the human LGN8 has shown a decrease in neuronal density in affected laminae that may be consistent with selective damage to the magnocellular pathway. Such analysis is complicated by the volume changes that can occur in the geniculate laminae after denervation, resulting in either increases or decrease in the density of laminar neurons.32 This point has been discussed in more detail elsewhere.10 33 34Electrophysiological studies of the LGN in primate experimental glaucoma did not show any difference in the sampling frequency of M and P type neuronal responses in the magno and parvocellular laminae.35
Support for selective magnocellular damage from psychophysical studies is mixed. Tests that focus on magnocellular function can detect early damage in glaucoma and ocular hypertension36 but do not test whether that damage is selective for the magnocellular pathway. Psychophysical studies in which the two pathways were distinguished using flickering or stationary sinusoidal gratings, have suggested selective damage to the magnocellular pathway.37 However, comparison of the contrast sensitivity functions at differing sensitivities might generate apparent selective damage to the magnocellular pathway because of the different shape of the contrast sensitivity profiles for these pathways.38 When a battery of tests has been used, comparable defects are seen in both magno and parvocellular function in early glaucoma.39 Motion detection and flicker contrast testing, which should be sensitive to magnocellular function, were both poor discriminators of glaucomatous damage.39 Patients with early glaucoma show defects with both short wavelength and motion automated perimetry, consistent with non-selective damage to the magnocellular and parvocellular pathways.40 The discrepancies between the anatomical and psychophysical data may reflect the difficulties in relating damage at the cellular level to defects that are detectable with psychophysical methods.41 42 Damaged retinal ganglion cells may reach a threshold (which may differ for parasol and midget cell types) where they fail to respond to a stimulus but have yet to die43; these cells would be detected using histological methods but would be excluded in any psychophysical study. To complicate matters further, it is also possible that different patterns of cell loss (selective and non-selective) may occur in the retina at different stages in the disease.44 Differences between the psychophysical studies may simply reflect the range of patterns of retinal ganglion cell death and the stage at which the disease is studied in any particular eye.
Evidence for non-selective damage does not undermine the rationale for selective testing of those pathways with the least redundancy.45 Frequency doubling perimetry, which is sensitive to defects in the non-linear responses of My cells (a subset of the magnocellular pathway46), has high sensitivity and specificity for the discrimination of normal from glaucomatous eyes.47 48 The retinal ganglion cells that mediate the blue-yellow signal comprise approximately 1% of the retinal ganglion cells in central retina,49 and are therefore also suitable targets for selective psychophysical testing. The ability of blue on yellow perimetry to detect visual field loss earlier than white on white perimetry50 is consistent with this hypothesis.
The present study has shown that it is possible to categorise large numbers of cells into parasol and midget types with established criteria in primates with experimental ocular hypertension. Although this study does not find robust evidence for selective cell death in the primate model, it is important to stress that it has not shown that it cannot occur. Small differential effects on parasol and midget cells could be missed by our technique. Our data and those of others9 suggest that cell shrinkage occurs in experimental glaucoma as a prelude to cell death. If this is the case, it suggests that a population of compromised retinal ganglion cells may exist in early glaucoma that would benefit from neuroprotective therapies.
Acknowledgments
We thank Peter Green (Department of Mathematics, University of Bristol) for performing the weighted regression analysis. Alan Cowey (Department of Experimental Psychology, Oxford) provided advice with cell labelling. Marsha McGloughlin (Alcon Labs, Fort Worth, TX, USA) supervised the measurement of intraocular pressures. Mike Chandler (Alcon Labs, Fort Worth) performed the argon laser trabeculoplasty in the experimental eyes.
Supported in part by grants from the National Institutes of Health EY09114 (Dr Caprioli), Research to Prevent Blindness, Inc, Connecticut Lions Eye Research Foundation, and The Alcon Research Institute Award, and Alcon Laboratories, Inc. Dr Morgan was supported by the Medical Research Council, UK.
Proprietary interest: none.