Article Text

Abstract
Aim: To assess the prevalence and demographic associations of moderate visual impairment in the population of the southern Indian state of Andhra Pradesh.
Methods: From 94 clusters in one urban and three rural areas of Andhra Pradesh, 11 786 people of all ages were sampled using a stratified, random, cluster, systematic sampling strategy. The eligible people were invited for interview and detailed dilated eye examination by trained professionals. Moderate visual impairment was defined as presenting distance visual acuity less than 6/18 to 6/60 or equivalent visual field loss in the better eye.
Results: Of those sampled, 10 293 (87.3%) people participated in the study. In addition to the previously reported 1.84% prevalence of blindness (presenting distance visual acuity less than 6/60 or central visual field less than 20° in the better eye) in this sample, 1237 people had moderate visual impairment, an adjusted prevalence of 8.09% (95% CI 6.89 to 9.30%). The majority of this moderate visual impairment was caused by refractive error (45.8%) and cataract (39.9%). Increasing age, female sex, decreasing socioeconomic status, and rural area of residence had significantly higher odds of being associated with moderate visual impairment.
Conclusions: These data suggest that there is a significant burden of moderate visual impairment in this population in addition to blindness. Extrapolation of these data to the population of India suggests that there were 82 million people with moderate visual impairment in the year 2000, and this number is likely to be 139 million by the year 2020 if the current trend continues. This impending large burden of moderate visual impairment, the majority of which is due to the relatively easily treatable refractive error and cataract, would have to be taken into account while estimating the eye care needs in India, in addition to dealing with blindness. Specific strategies targeting the elderly population, people with low socioeconomic status, those living in the rural areas, and females would have to be implemented in the long term to reduce moderate visual impairment.
- cataract
- India
- visual impairment
- refractive error
Statistics from Altmetric.com
We conducted the population based Andhra Pradesh Eye Disease Study (APEDS) in one urban and three rural populations of the southern Indian state of Andhra Pradesh. The objectives of APEDS were to assess the prevalence and causes of blindness and other levels of visual impairment, prevalence and risk factors for eye diseases, effect of visual impairment on quality of life, and barriers to eye care services.1
Andhra Pradesh is one of the larger states of India accounting for 8.4% of the country's area with a population of 75.7 million in early 2001, which was 7.4% of total population of India.2 The age distribution of the population of the state is pyramidal like the rest of India with an estimated 35.6% of the total population below 16 years of age, 25.7% between 16–29 years, and 38.7% 30 years of age or more.3 The rural population comprises a little less than three fourths of the total population of the state, and the male to female sex ratio is 100:98.2 This state is also one of the seven states selected by the government of India under the World Bank assisted cataract blindness control project to deal with cataract blindness.4
We have previously reported data on blindness from the urban and rural study areas of APEDS.5,6 The prevalence of blindness (presenting distance visual acuity <6/60 or central visual field <20 degrees in the better eye) was estimated at 1.84% for this population.6 We have also previously reported data on moderate visual impairment from the urban study area of APEDS.7 In this article, we report the population based data on moderate visual impairment for the four areas of APEDS, including the three rural study areas, which could be used for planning eye care services in the long term.
METHODS
Various aspects of the study design of APEDS have been described previously.1,5–8
Briefly, a multistage sampling procedure was used to select 24 urban clusters and 70 rural clusters from one urban and three rural areas from different parts of the southern Indian state of Andhra Pradesh, with the aim of having a study sample representative of the urban-rural and socioeconomic distribution of the population of this state. These four areas were located in Hyderabad (urban), West Godavari district (“well off” rural), and Adilabad and Mahabubnagar districts (poor rural). APEDS was conducted from October 1996 to February 2000. The sampling strategy for APEDS has been described earlier.1,5–8
In brief, the major difference between the urban and rural sampling was that the former was selected from blocks stratified by socioeconomic status and religion, whereas the latter were selected from villages stratified by caste as described previously.5–7 A total of 94 clusters were selected for APEDS using stratified random sampling, such that the proportion of each socioeconomic status in the sample would be similar to that in the population of the state.1,5–8 These clusters were mapped and the number of households and members in each household listed. The households were then systematically selected within each cluster to obtain roughly equal number of households in all clusters. The systematic selection of households ranged from every second to fifth household in a cluster depending on the size of the cluster. Approximately half the clusters in each of the four areas were randomly assigned to have people of all ages in the selected households eligible for the study, and the other half to have only those 30 years of age or more eligible for the study. This was done to obtain similar number of participants in the less than and more than 30 year old age groups.1,5–8 A total of 11 786 people were sampled in all the four areas of APEDS of which 8832 were sampled in the three rural areas. Eligible people were interviewed by trained investigators.1,5–8 The participants were then invited for detailed eye examination at a local site. Written informed consent was obtained from participants before examination. For the participants who could not read and write the consent was read aloud for these participants by the receptionist at the examination site in the presence of all the participants on that day. These participants gave their thumb impression after understanding and agreeing with the content of the consent. This study was approved by the ethics committee of the LV Prasad Eye Institute, Hyderabad, India.
The eye examination conducted in APEDS has been described in detail previously.1,5–10 In brief, the eye examination included measurement of presenting and best corrected distance and near visual acuities under standardised conditions with logMAR charts,11 external eye examination, assessment of pupillary reaction, anterior segment examination using slit lamp biomicroscope, measurement of intraocular pressure using Goldmann applanation tonometer, gonioscopy, and lens, vitreous, and posterior segment examination (involving examination with the indirect ophthalmoscope using 20 dioptre lens and at the slit lamp using 78 dioptre lens) after dilatation unless contraindicated because of risk of angle closure. Automated visual fields were done with the Humphrey visual field analyser12 using the threshold central 24-2 strategy in those participants assessed to have any suspicion of glaucoma, any other optic nerve pathology, higher visual pathway lesion, or significant macular pathology according to uniform predefined criteria.1,5–7,9,10 Photographic documentation was done for any anterior or posterior segment pathology and this was used to confirm diagnoses.1,5–7 Examination was done at home, using portable equipment, for the participants who were physically debilitated and were unable to come to the examination centre. This examination was essentially similar to the one at the examination centre except that gonioscopy, posterior segment examination using 78 dioptre lens, automated visual fields, and photography were not done.1,5–7,9,10
We have previously reported the data on moderate visual impairment from the urban area of APEDS using two definitions of moderate visual impairment.7 Moderate visual impairment, for this present article, was defined using the more conservative definition as presenting visual acuity <6/18–6/60 or equivalent visual field loss in the better eye. The visual field loss criteria for moderate visual impairment have been described in detail previously,7 and are listed in Table 1. The cause of moderate visual impairment was classified as described previously.7 In brief, if cataract was present along with a posterior segment lesion and it was considered by the examining ophthalmologist that removal of cataract would not restore vision, the cause of visual impairment was considered to be the posterior segment lesion. This was confirmed later by the principal investigator (LD) and co-investigator (RD) by assessing the photographs. If nuclear cataract of LOCS III grade No 3.5 or more was present, and vision improved from moderate visual impairment to no visual impairment category with myopic correction in the absence of myopic fundus changes, the cause of visual impairment was considered to be cataract and not refractive error as the former was the underlying cause of this index myopia.7 If the two eyes of a subject had visual impairment from two different causes, both were given 50% weight as the cause of low vision, rather than arbitrarily choosing one or the other as the cause for that subject. If visual impairment was present with both visual acuity and visual field loss criteria in an eye, the cause responsible for the higher grade of visual loss was considered if acuity and visual field loss grades were different, and the cause of acuity loss was considered if the grades of acuity and visual field loss were similar.7
Criteria for moderate visual impairment due to visual field loss
Data were entered on self coded forms by the investigators and the examiners which were then entered into a computer by two data entry operators using foxpro program with internal consistency checks.1 Data entered by one data entry operator were checked by the other data entry operator after completion of each cluster. This was done randomly on 10% of all the data entered for each cluster. To determine and verify outliers, monthly range, and consistency checks were done using spss (Windows). Analyses were done using the spss software (spss for Windows, Rel 10.0.5. 1999. Chicago: SPSS Inc). The prevalence of moderate visual impairment was adjusted for the age, sex, and urban rural distribution in India for the year 2000,3,13 to obtain composite estimates for the overall prevalence of moderate visual impairment. The design effect of the sampling strategy was calculated using the moderate visual impairment prevalence in each cluster,14 and the 95% confidence intervals of the estimates were adjusted accordingly.
The demographic associations of moderate visual impairment with age, sex, socioeconomic status, and area of residence were assessed with univariate analysis using χ2 test followed by multivariate analysis using multiple logistic regression. The effect of each category of a multicategorical risk factor variable was assessed by keeping the first or the last category as the reference. The 275 participants in this study population reported earlier as blind6 were excluded from the univariate and multivariate analyses for moderate visual impairment.
These data on moderate visual impairment were extrapolated to the population of India for the year 2000.3,13 In addition, the prevalence of moderate visual impairment was estimated for the years 2010 and 2020 if the current age-sex specific rates continue, by applying these rates to the estimated age, sex, and urban-rural distribution of the population of India in 2010 and 2020.3,13
RESULTS
Study population
A total of 10 293 (87.3%) subjects participated in the study in the four areas of APEDS of the eligible 11 786 subjects. Of these 7775 (75.5%) were from the three rural areas and 5439 (52.8%) were female. A total of 122 (1.2%) subjects were examined at home of whom 23 (18.9%) were in the urban study area. The results that follow are for moderate visual impairment defined as presenting distance visual acuity <6/18–6/60 or equivalent visual field loss as described previously.7
Prevalence and causes of moderate visual impairment
In addition to the 201 people reported previously with moderate visual impairment from the urban area,7 1036 (10.3%) in the three rural areas had moderate visual impairment. The prevalence of moderate visual impairment adjusted for age, sex, and urban-rural distribution was 8.1% (95% confidence interval 6.9 to 9.3; design effect 5.2) for the four areas combined. Visual field loss was responsible for 0.96% of the moderate visual impairment. On considering only the three rural areas of APEDS, the age and sex adjusted prevalence of moderate visual impairment was 8.9% (95% confidence interval 7.5 to 10.3; design effect 4.7). Visual field loss was responsible for 0.72% of the moderate visual impairment in the rural areas.
The distribution of the causes of moderate visual impairment is shown in Table 2. The leading cause of moderate visual impairment was refractive error (45.8%) followed by cataract (39.9%). Comparison between the prevalence of moderate visual impairment due to various causes for the urban area and the rural areas of APEDS is shown in Figure 1. Prevalence of moderate visual impairment due to refractive error, cataract, amblyopia, and corneal diseases was higher in the rural areas compared with the urban area whereas that caused by retinal diseases, optic atrophy, and glaucoma was similar. The category of “others” includes endophthalmitis, higher visual pathway lesion, posterior capsule opacity following cataract surgery, and indeterminate cause of visual impairment. Refractive error and cataract were responsible for majority of the moderate visual impairment. The prevalence of moderate visual impairment caused by refractive error and cataract was 2.90% (95% confidence interval 1.83 to 3.97%) and 2.16% (95% confidence interval 1.00 to 3.32%) respectively in the urban area, and was 4.0% (95% confidence interval 3.3 to 4.7%) and 3.6% (95% confidence interval 2.9 to 4.4%) for refractive error and cataract respectively in the three rural areas combined.
Distribution of causes of moderate visual impairment for the four areas of APEDS
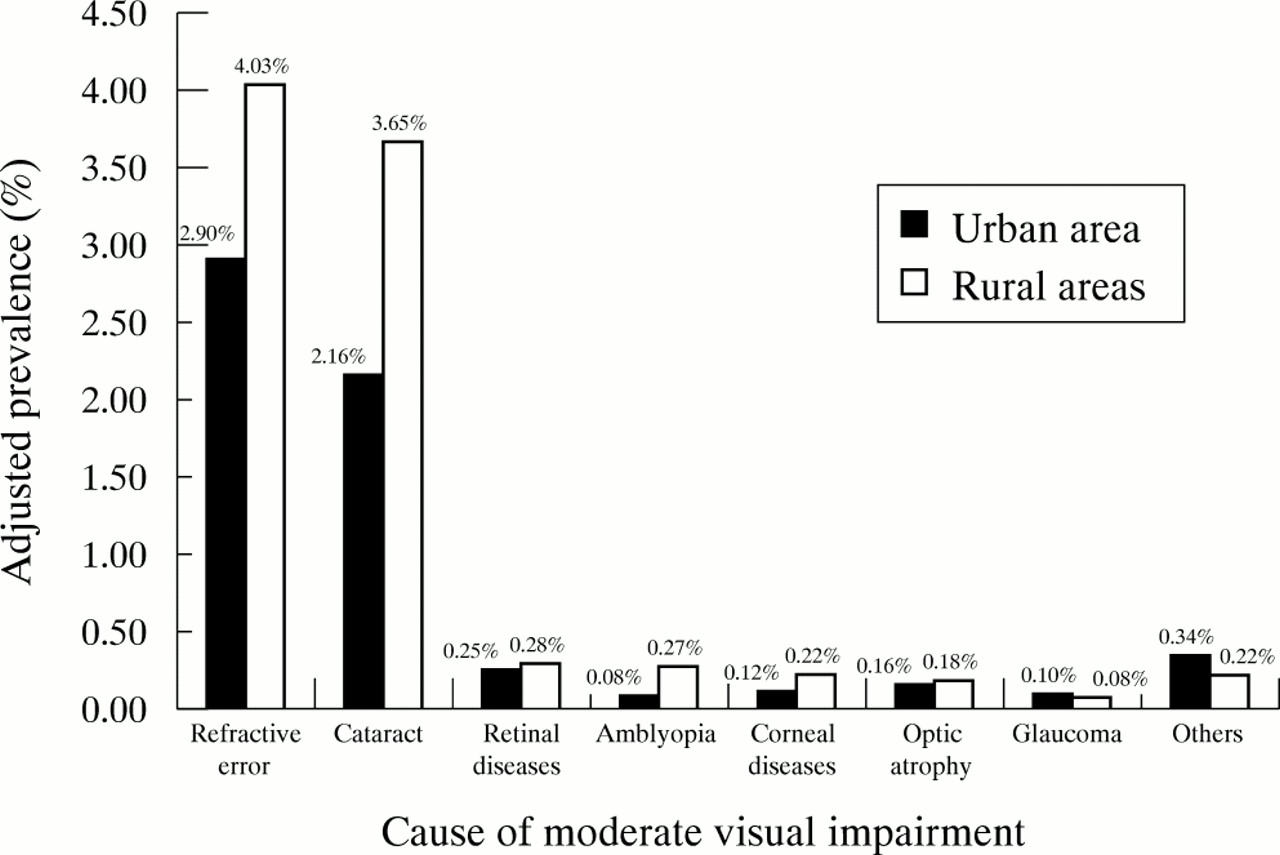
Prevalence of moderate visual impairment for the different causes of moderate visual impairment for the urban and rural areas (three rural areas of APEDS combined). The prevalence adjusted for age and sex distribution of the population of India in the year 2000.
Figure 2 shows the age specific prevalence of moderate visual impairment for the causes of moderate visual impairment for the four areas of APEDS combined. Refractive error was the most frequent cause of moderate visual impairment below 60 years of age and cataract was the most common cause 60 years of age onwards.

Age specific prevalence of moderate visual impairment for the different causes of moderate visual impairment for the four areas of APEDS combined. The prevalence adjusted for sex and urban-rural distribution of the population of India in the year 2000. The prevalence of moderate visual impairment due to cataract in 16–29 and 30–39 years of age was 0.02% which are not represented in the figure because of the scale used to show prevalence.
Demographic associations for moderate visual impairment
After excluding the 275 people reported as blind (presenting distance visual acuity <6/60 or central visual field less than 20 degrees in the better eye) in this study population,6 the sample considered for the demographic association analysis for moderate visual impairment was 10 018. Of these 10 018 people, 7545 (75.3%) were from the three rural areas, 5322 (53.1%) were 30 years of age or more, and 5281 (52.7%) were female.
Distribution of those with moderate visual impairment by age, sex, socioeconomic status, and area of residence is shown in Table 2. On applying multiple logistic regression (Table 3), the odds of having moderate visual impairment increased with increasing age and with decreasing socioeconomic status. Females (odds ratio 1.47; 95% confidence interval 1.27 to 1.71) compared with males and those living in the rural areas (odds ratio 2.12; 95% confidence interval 1.75 to 2.57) compared with the urban area had significantly higher odds of having moderate visual impairment.
Association of moderate visual impairment with age, sex, socioeconomic status, and area of residence
Extrapolations to the population
Extrapolating these data from APEDS to the estimated 76 million population of Andhra Pradesh in the year 2000, 6.1 (95% confidence interval 5.2 to 7.0) million people would have moderate visual impairment. If these data are extrapolated to the estimated 1014 million population of India in the year 2000,3 82.1 (95% confidence interval 69.9 to 94.3) million people would have moderate visual impairment. If the current age-sex specific rates of moderate visual impairment continue, the prevalence in the years 2010 and 2020 would be 9.2% (95% confidence interval 7.9 to 10.5%) and 10.7% (95% confidence interval 9.3 to 12.1%) respectively. These prevalence rates suggest that of the estimated 1168 million population of India in 2010,8 107 (95% confidence interval 92 to 122) million people would have moderate visual impairment, and of the 1312 million population in 2020,3 140 (95% confidence interval 122 to 158) million people would have moderate visual impairment if the current trend continues.
DISCUSSION
APEDS was a population based study representative of the population of the Indian state of Andhra Pradesh with a good participation rate.
We have previously reported data on moderate visual impairment from the urban area of APEDS using two definitions of moderate visual impairment.7 In the previous report, the prevalence of moderate visual impairment in the urban area was estimated at 7.2% with definition one (presenting distance visual acuity <6/12–6/60 or equivalent visual field loss), and 4.8% with the other more conservative definition two (presenting distance visual acuity <6/18–6/60 or equivalent visual field loss).7 These estimates were adjusted for the population distribution of India available from the year 1991 census.7 For this report, we have adjusted the estimates for the most recent data for the estimated population distribution of India in the year 2000.3,13 On adjusting the urban area estimates for the estimated population distribution of India in the year 2000, the prevalence of moderate visual impairment in the urban area is estimated at 8.9% with definition one and 6.0% with definition two. In this report on the combined results from four areas of APEDS, we have used only the latter more conservative definition as three of the four areas of APEDS were rural.
We have reported the prevalence of blindness at 1.84% for this population.6 In addition to the high prevalence of blindness in this population, these data suggest that there is also a significant burden of moderate visual impairment.
The main finding is the higher prevalence of moderate visual impairment in the rural areas (8.9%) compared with the urban area (6.0%). Though this finding is not surprising as we have also found blindness higher in the rural areas compared with the urban area in the same population, it does indicate the poor eye care scenario in the rural areas of the state.6 The higher prevalence in the rural areas is possibly related to less availability of eye care services in these areas compared with the urban area. Based on the data presented in this paper, it is not possible for us to comment on whether there are reasons other than availability of eye care services for high prevalence in the rural areas. The majority of the moderate visual impairment in the urban and rural areas was treatable, as refractive error and cataract were responsible for 85% of the moderate visual impairment. We have previously reported 60% of blindness in this population was caused by cataract or refractive error.6
Among the younger age groups, refractive error was the main cause of moderate visual impairment. Refractive error has also been reported as a significant cause of visual impairment from the developed world.15–17 Treatment of refractive error is perhaps the most simple and effective form of eye care. To deal with the burden of refractive error related moderate visual impairment certain issues that need to be addressed are adequate infrastructure to facilitate the logistics of providing affordable reasonable quality spectacles; availability of adequate number of trained personnel to perform reasonable quality refraction; creating demand and awareness for refractive services; and implementation of vision screening programmes on a large scale to detect those suffering from refractive error.
Cataract was the main cause of moderate visual impairment in the older population. There was a notable increase in the prevalence of moderate visual impairment due to cataract in people 60 years of age and older. The Baltimore Eye Survey also documented an increase in cataract as cause of visual impairment in people 60 years of age and older,17 and the Visual Impairment Project in Melbourne documented an increase in people 70 years of age and older.15 The issues regarding reducing moderate visual impairment due to cataract are: adequate infrastructure to facilitate the logistics of providing good quality cataract services; affordability of cataract services by the population at large; availability of adequately trained staff to provide cataract services; and creating demand for cataract surgical services.
We have reported the demographic associations for moderate visual impairment. Knowledge about these associations can help in identifying the groups in the population, which need particular attention in the strategies to reduce moderate visual impairment. The demographic associations of moderate visual impairment are not very different from those of blindness reported earlier.6 The chances of having moderate visual impairment increased with increasing age. Females and those belonging to the extreme lower and lower socioeconomic strata were more likely to have moderate visual impairment. These groups are disadvantaged in our society. As ours is a patriarchal society, females are socially and financially dependent on the male members of the family for their needs, which results in their disadvantaged position. Those belonging to the extreme lower and lower socioeconomic strata are disadvantaged with regard to access to healthcare services, including eye care services, mainly for economic reasons. Therefore, an attempt has to be made to actively target these groups to reduce moderate visual impairment. Attention of the eye care programmes needs to be more actively in the rural areas as these data suggest a higher prevalence of moderate visual impairment in the rural areas. In addition, these data also suggest variation within the rural areas themselves, as those living in Adilabad, a poor rural area, were less likely to have moderate visual impairment as compared with the other two rural areas. This variation within the rural areas needs to be understood further.
The World Health Organization has previously defined blindness as best corrected visual acuity less than 3/60 or corresponding visual field loss in the better eye, and low vision as best corrected visual acuity less than 6/18–3/60 in the better eye.18 The World Health Organization has also estimated previously that the burden of low vision is three times that of blindness.19 The prevalence of visual impairment in the less than 6/18–3/60 category, using the presenting visual acuity definition and equivalent visual field loss, is 8.59% in our population. This includes 8.09% prevalence of less than 6/18–6/60 category reported in this article, plus the 0.50% prevalence of less than 6/60–3/60 category reported earlier.6 The prevalence of blindness, defined as presenting visual acuity less than 3/60 or central visual field less than 10 degrees in the better eye, from our data is 1.34%.6 These data suggest that the burden of less than 6/18–3/60 category of visual impairment in our population is six times higher than that of blindness of less than 3/60. This six times higher burden is twice that estimated by the World Health Organization with the definitions using best corrected visual acuity.
The implications of these data on planning of eye care services are noteworthy. The extrapolations of these data to the years 2010 and 2020 estimate the burden of moderate visual impairment if effective strategies are not put in place. It should be noted, however, that the projection of 107 million in 2010 and 140 million in 2020 for India if current trends continue have 95% confidence intervals of 30 and 36 million people respectively. Therefore, specific data would be required for more precise planning at the state and district levels. However, in the background of the enormous burden of blindness, scanty infrastructure, and inadequate staff for provision of eye care services, especially for our rural population, it may not be justifiable to put resources into dealing with moderate visual impairment at this time. It would be necessary, however, to take into account these data on moderate visual impairment when planning for eye care services in the long term. The current strategies already focus on blindness, but the long term strategies should include moderate visual impairment in addition to blindness.
In conclusion, there is a significant burden of treatable moderate visual impairment in this population in addition to blindness. The predominant causes of moderate visual impairment change with age. Refractive error is the main cause of moderate visual impairment among the younger groups and cataract in the older age groups. These data could help in planning long term strategies for eye care services in India.
Acknowledgments
Financial support for this study was provided by the Hyderabad Eye Research Foundation, Hyderabad, India and Christoffel-Blindenmission, Bensheim, Germany. Rakhi Dandona was supported in part by the R B McComas and Hugh Noel Puckle scholarships from the University of Melbourne, Melbourne, Australia.
REFERENCES
Footnotes
Series editors: WN Good and S Ruit