Article Text

Abstract
Background/aim: There is evidence suggesting the occurrence of neurovisual abnormalities in patients with diabetes without retinopathy. However, the determination of abnormalities in the neural and glial elements in vivo is difficult. The aim of this study was to investigate whether a retinal nerve fibre layer (RNFL) defect (as determined by scanning laser polarimetry, SLP) is present in patients without clinical manifestations of diabetic retinopathy.
Methods: 12 patients with type 1 diabetes mellitus (DM) without retinopathy or other diabetes induced microvascular complications, underwent a complete ophthalmological examination, including automated perimetry and RNFL measurements with a nerve fibre layer analyser GDx. The data were compared with a normal control group matched for age and sex.
Results: The superior segment retardation in patients with diabetes was lower than in the control group, based on the superior integral (0.19 (SD 0.06) v 0.23 (0.04) mm2, p=0.03) and the superior average (71.0 (11.05) v 84.27 (10.56) μm, p=0.007) parameters.
Conclusion: This finding may be indicative of significant nerve fibre loss in the superior segment of the retina in patients with type 1 diabetes mellitus but without retinopathy. The meaning of intraretinal differences in RNFL retardation, indicating asymmetric NFL loss, in patients with diabetes is yet not understood.
- diabetes
- diabetic retinopathy
- nerve fibre layer
- polarimetry
- CPSD, corrected pattern standard deviation
- DM, diabetes mellitus
- DR, diabetic retinopathy
- ERG, electroretinography
- GHT, glaucoma hemifield test
- MD, mean deviation
- RNFL, retinal nerve fibre layer
- SLO, scanning laser ophthalmoscope
- SLP, scanning laser polarimetry
- VEP, visual evoked potentials
Statistics from Altmetric.com
- diabetes
- diabetic retinopathy
- nerve fibre layer
- polarimetry
- CPSD, corrected pattern standard deviation
- DM, diabetes mellitus
- DR, diabetic retinopathy
- ERG, electroretinography
- GHT, glaucoma hemifield test
- MD, mean deviation
- RNFL, retinal nerve fibre layer
- SLO, scanning laser ophthalmoscope
- SLP, scanning laser polarimetry
- VEP, visual evoked potentials
The initial pathological changes in diabetic retinopathy (DR) are presumed to occur in small vessels, and involve endothelial cell and pericyte loss.1,2 However, the documentation of these early morphological findings in vivo is limited and their pathogenic importance is controversial.3
There is increasing evidence that functional impairment precedes the earliest clinical manifestations of diabetic retinal vasculopathy. Sensitive psychophysical examinations, such as contrast sensitivity4–6 and colour vision,7,8 and also electrophysiological methods including electroretinography (ERG)9–11 and visual evoked potentials (VEP),12–15 clearly show early abnormalities to be a potential primary consequence of hyperglycaemia before the onset of the retinopathy. These observations raise the question of the extent of involvement of neural and glial cellular elements in the pathogenesis of DR.
Ischaemia, reduced protein synthesis, depleted myoinositol, and high sorbitol levels have been demonstrated in patients with diabetes and may result in nerve fibre loss in peripheral nerves.16 Hence, it is possible that retinal nerve fibres also suffer from these diabetes induced changes. Studies of the retinal nerve fibre layer (RNFL) using green filter photographs have detected focal loss in diabetic patients.17,18 Recently, Chihara and Zhang19 used a three dimensional scanning laser ophthalmoscope (SLO) to study the optic nerve topography in patients with diabetes and in normal subjects. These authors found that the tissue volume of the neuroretinal rim area was increased in eyes with pre-proliferative and proliferative retinopathy. Scanning laser polarimetry (SLP) is a method designed to quantitatively determine RNFL thickness in humans. The technique is based on the specific arrangement of the microtubules in the RNFL.20 In SLP, the phase shift of the reflected light beam (equal to its retardation) is linearly correlated with the NFL thickness.21,22 Histological confirmation of SLP measurements has been provided in an experimental study with monkey eyes,22 which showed that each degree of retardation corresponds to 7.3 μm of RNFL thickness.
In this study, SLP was used to investigate whether there is RNFL defect in patients with diabetes mellitus who have no ophthalmoscopically detectable retinopathy (level 1 of the modified Airlie House classification).23
PATIENTS AND METHODS
Patients
To detect a difference of 13% in the mean values of RNFL measurements between the control group and patients with diabetes, as reported in the literature for healthy subjects and patients with glaucoma,24 a sample size of six patients per group was calculated to give a power of 90% with a two tailed significance level of 0.05.
The criteria for inclusion in the study were type 1 diabetes mellitus (DM) (defined as an age at diagnosis of less than 35 years, a history of sudden onset of severe hyperglycaemic symptoms, marked weight loss, spontaneous sustained ketosis or ketonuria loss, and insulin therapy in the first year of diagnosis), an age ranging from 18 to 45 years old, white, with DM for at least 10 years (to allow enough time for the development of diabetic retinal disease23) and the absence of any endocrine, hepatic, metabolic, or cardiovascular disease (determined by a history of cardiovascular disease if there was a physician verified history of angina, heart attack, or stroke, or if the patient was taking cardiovascular medications) or of hypertension and non-diabetic renal disease. Patients with blood pressure measurements above 140/90 mm Hg were excluded from the study, as were those with any degree of diabetic retinopathy (levels 2 or above from the Airlie House classification),23 high myopia, chorioretinitis scars, posterior uveitis, ocular hypertension (intraocular pressure (IOP) higher than 21 mm Hg), or glaucoma and who had undergone previous ocular surgery were also excluded, since such events may influence the development of diabetic retinopathy25 or damage the RNFL.26 Of the 80 potential patients for the study attending the diabetic outpatient clinic at the university hospital of the State University of Campinas, 68 (85%) were excluded, based on the above criteria: 34 (42.5%) had any DR, 18 (22.5%) had DM for less than 10 years, 12 (15%) were non-white, two (2.5%) had thyroid disease, one (1.25%) had undergone a cataract extraction and developed PDR only in the corresponding eye, and one (1.25%) was taking drugs for glaucoma.
Twelve patients with type 1 DM with a normal fundus (level 1 of the modified Airlie House classification)23 and normal and reliable visual fields were included in this study. A visual field was considered reliable when showing less than a 20% fixation loss and less than 33% false negative or false positive errors. The visual field was considered normal when the GHT (glaucoma hemifield test) was “within normal limits,” and the MD (mean deviation) and the CPSD (corrected pattern standard deviation) were not followed by p<5%. All of the patients included had a visual acuity of 20/25 or better with the best optical correction. The tested eye of each patient was selected randomly. Patients with diabetes were compared to 12 normal volunteers matched for sex and age, with no history of eye disease, optic nerve compression, cerebral ischaemia, demyelinating disease, family history of glaucoma, or ocular hypertension. The study was carried out to conform with the tenets of the Declaration of Helsinki, and informed consent was obtained from all subjects before participating in the study, which was approved by the ethics committee of the university hospital.
Ophthalmological measurements
The eye examination consisted of measuring the refractive error and the best corrected visual acuity for distance. The intraocular pressure was measured by applanation tonometry. Slit lamp examination was used to determine the anterior chamber depth and the presence of iris neovascularisation. The subject's pupils were fully dilated with a 2.5% solution of phenylephrine hydrochloride and 1% cyclopentolate hydrochloride for indirect fundus ophthalmoscopy and stereoscopic colour fundus photographs of seven standard fields of both eyes. To qualify patients for further analysis, automated perimetry was determined using a Humphrey field analyser II, program 24-2, full threshold strategy (Humphrey Systems, Dublin, CA, USA).
Scanning laser polarimetry measurements
The subject's head was placed as upright as possible on the chin rest, the pupils were left undilated, and the ambient lights were left on. RNFL measurements were obtained with the nerve fibre analyser (NFA/GDx, Laser Diagnostic Technologies, San Diego, CA, USA), which consists in a confocal SLO with an integrated polarisation modulator. Briefly,24 the light source, a polarisation modulated laser beam (wavelength 780 nm), is directed to one point of the retina by the optical media of the eye, and the reflected light that double passes the RNFL is detected to obtain the retardation at that point. The laser beam is sequentially directed over each of the 256 × 256 retinal locations to obtain a retardation map in which each retinal location (pixel) has a corresponding retardation value. In order to be included, each image had to pass the software's criteria of quality, which evaluate image vignetting, intensity, illumination, contrast, percentage of image used, optic nerve centration, and temporal to nasal thickness. Three images of the peripapillary retina of each eye were acquired, and a baseline map was created automatically and used for analysis by averaging the three retardation values corresponding to each pixel. The disc margin was delineated by a single examiner (HR) in a masked fashion.
For the analysis described here, the GDx normative database program was not used. A total of 1500 pixels per quadrant peripheral to an ellipse situated 1.75 disc diameters from the centre of the disc were used to calculate the ratio and maximum measures. The following parameters were collected for analysis—superior, inferior, temporal, nasal, and total averages (μm), and also superior, inferior, temporal, nasal, and total integrals (mm2). The superior integral is equivalent to the total area under the curve and within the superior portion of the elliptical band surrounding the optic nerve. Figure 1 illustrates the acquisition of the integral parameters from the nerve fibre analyser. The data were analysed by one of the authors (VPC) who was unaware of the patient's status (masked fashion).
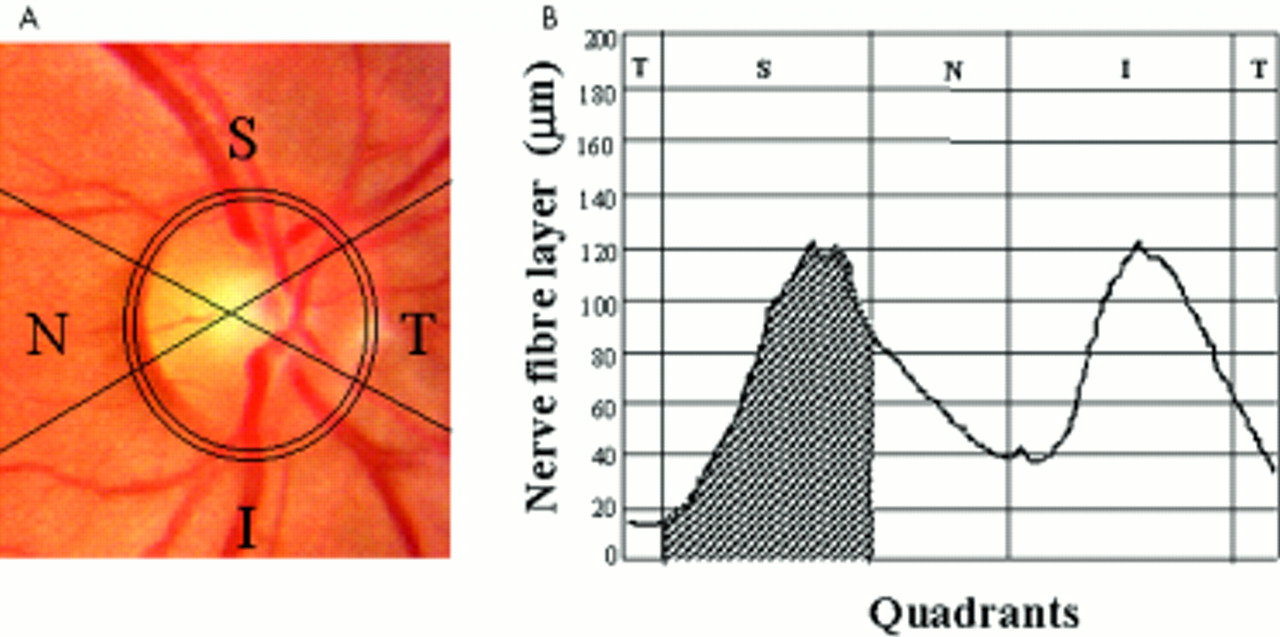
(Left) The field of view was a 15° × 15° image obtained with the SLP, including a centred optic disc and the 10 × 10 pixel ellipse situated at 1.75 disc diameters from the centre of the disc. Note that the image is divided into four quadrants (superior, temporal, inferior, and nasal) by four lines originating from the centre of the optic disc. (Right) Diagram illustrating the calculation of the superior integral, which corresponds to the total area under the curve (mm2) and within the superior portion of the elliptical band surrounding the optic nerve. T = temporal, S = superior, N = nasal, I = inferior.
Laboratory measurements
The percentage of the A1c component of glycosylated haemoglobin (HbA1c) was assessed by high performance liquid chromatography (normal values in our laboratory were 5.6% (SD 1.3%)). Overnight urine samples were collected for the measurement of albumin excretion by nephelometry (expressed in μg/min), and serum creatinine was measured by an automated method.
Statistical analyses
The data are expressed as mean (SD). Student's t and χ2 tests were applied as appropriate to parametric and discrete variables respectively, using a commercial software package (SPSS for Power Macintosh). The null hypothesis was rejected below the conventional (two tailed) 0.05 level.
RESULTS
The age, sex, and systolic and diastolic blood pressures were similar in patients with diabetes and in the control group (Table 1). The mean duration of DM was 14 years (range 10–28 years). All of the patients were in reasonable glycaemic control, and there was no evidence of diabetic related complications such as nephropathy, as estimated by urinary albumin excretion (UAE) (Table 1) or cardiovascular disease. There was a lower NFL retardation in the superior segment of the retina but not in other segments (Table 2). The superior segment retardation in patients with diabetes was significantly lower than in the normal control group, when expressed by the superior polar integral (0.19 (0.06) v 0.23 (0.04) mm2, respectively, p=0.03) and the superior polar average (71.0 (11.05) v 84.27 (10.56) μm, respectively, p=0.007) (Table 2). There were no statistically significant differences between the parameters in the remaining quadrants in both groups.
Characteristics of the patients with type 1 diabetes mellitus and the normal control group
Retinal nerve fibre layer measurements patients with diabetes and normal controls
The individual measurements of superior segment retardation, as determined by the superior polar average (μm), are represented in the Figure 2. The mean superior NFL thickness in patients with type 1 DM was significantly lower than in the normal control group (71 (11) μm; 95% confidence interval (CI): 67 to 85 μm; and 84 (10) μm; 95% CI: 77 to 91 μm, p=0.007, respectively), indicating a substantial loss of axons in patients with DM without retinopathy.

The individual values for the RNFL retardation measurements obtained by scanning laser polarimetry (SLP) of the superior quadrant in patients with DM and in normal controls.
DISCUSSION
This is the first quantitative report of a loss of RNFL in humans with diabetes based on measurements in vivo. The results suggest that neurodegeneration may be an event in the pathogenesis of DR. Asymmetric RNFL loss was observed in patients with type 1 DM with no ophthalmoscopically detectable retinopathy. The superior quadrant showed lower retardation values (expressed by the superior polar integral and superior polar average) when compared with the normal control group, thus indicating significant nerve fibre loss in the superior segment of the retina in these patients. Focal RNFL defects in patients with type 2 DM and a normal fundus have been reported by Chihara and colleagues17 based on green filter photographs, but without a quantitative evaluation. By contrast, Chihara and Zhang,19 studying patients with advanced diabetic retinal disease using scanning laser ophthalmoscope, have demonstrated the increasing of neuroretinal tissue around the optic nerve head. Because of the cross sectional design of the present study, the predictive value of the SLP test in patients with diabetes but without retinopathy was not assessed. A prospective observational study is needed before further conclusions can be drawn.
In DR, microaneurysms and acellular capillaries are twice as common in the superior than in the inferior retina.27 The mechanisms underlying these distinct disease specific regional differences have not been defined. Recently, Chung and colleagues28 demonstrated that blood flow in the superior temporal retina increased in response to hypercapnia, but did not decrease in response to hyperoxia. In contrast, hyperoxia led to decreased blood flow in the inferior retina, whereas hypercapria did not result in increased blood flow in this area. In the present study, SLP revealed a significant RNFL loss in the superior quadrant in patients with type 1 DM. The lack of a normal vasoconstrictor response in this quadrant could explain why the region is more susceptible to microaneurysms and acellular capillaries in DM,27 and also why retinal nerve fibres are preferentially lost in this region, even before clinically detectable DR.
This lack of responsiveness could also explain the existence of abnormalities revealed by psychophysical and electrophysiological tests before the onset of retinopathy.4–15 The relevance of intraretinal differences in NFL retardation is still not understood. The uptake of glucose from the circulation, its metabolism, and the transfer of energy to neural cells in the retina are crucial functions which were recently recognised to be under glial cell (Müller cells, astrocytes, and microglia) control. In addition, the enhanced permeability of the blood-retinal barrier, an early phenomenon in the pathogenesis of the DR, may anticipate the hyperglycaemic state in the neural parenchyma of the retina.29 The involvement of neuroglial elements before the onset of clinical diabetes has been demonstrated by several investigators,30–32 and suggests that vascular cells are not the only retinal cells affected by diabetes. As demonstrated by Barber and colleagues,29 the number of cells in apoptosis (TUNEL positive cells) was increased in retinal neural cells from humans with diabetes. The significant reduction in the number of retinal ganglion cells and the reduction in the thickness of the inner plexiform and nuclear layers suggest that apoptotic cells are likely to include ganglion cells and other neurons in the retina.29
In summary, patients with type 1 DM without retinopathy show lower SLP retardation measurements in the superior segment of the retina, suggesting retinal nerve fibre loss in this segment. This finding corroborates previous studies showing that the early events of diabetic retinal disease (microaneurysms and acellular capillaries) occur preferentially in the superior temporal quadrant, and suggests that there may be a greater susceptibility of this area to diabetes induced changes.
Acknowledgments
Grant support: Fundação de Amparo à Pesquisa do Estado de São Paulo (FAPESP, grant number 96/98692).
The authors thank Newton K José, MD, PhD, head of the Department of Ophthalmology, and Elizabete J Pavin, MD, PhD, Department of Internal Medicine, Faculty of Medical Sciences, State University of Campinas, for supporting this project, and Stephen Hyslop for editing this manuscript.
Proprietary interest: None.