Article Text

Abstract
Aim: To estimate the number of people with open angle (OAG) and angle closure glaucoma (ACG) in 2010 and 2020.
Methods: A review of published data with use of prevalence models. Data from population based studies of age specific prevalence of OAG and ACG that satisfied standard definitions were used to construct prevalence models for OAG and ACG by age, sex, and ethnicity, weighting data proportional to sample size of each study. Models were combined with UN world population projections for 2010 and 2020 to derive the estimated number with glaucoma.
Results: There will be 60.5 million people with OAG and ACG in 2010, increasing to 79.6 million by 2020, and of these, 74% will have OAG. Women will comprise 55% of OAG, 70% of ACG, and 59% of all glaucoma in 2010. Asians will represent 47% of those with glaucoma and 87% of those with ACG. Bilateral blindness will be present in 4.5 million people with OAG and 3.9 million people with ACG in 2010, rising to 5.9 and 5.3 million people in 2020, respectively.
Conclusions: Glaucoma is the second leading cause of blindness worldwide, disproportionately affecting women and Asians.
- ACG, angle closure glaucoma
- GEE, generalised estimating equations
- IOP, intraocular pressure
- LCL, lower confidence limit
- OAG, open angle glaucoma
- UCL, upper confidence limit
- glaucoma
- prevalence
- open angle
- angle closure
- ACG, angle closure glaucoma
- GEE, generalised estimating equations
- IOP, intraocular pressure
- LCL, lower confidence limit
- OAG, open angle glaucoma
- UCL, upper confidence limit
- glaucoma
- prevalence
- open angle
- angle closure
Statistics from Altmetric.com
- ACG, angle closure glaucoma
- GEE, generalised estimating equations
- IOP, intraocular pressure
- LCL, lower confidence limit
- OAG, open angle glaucoma
- UCL, upper confidence limit
- glaucoma
- prevalence
- open angle
- angle closure
- ACG, angle closure glaucoma
- GEE, generalised estimating equations
- IOP, intraocular pressure
- LCL, lower confidence limit
- OAG, open angle glaucoma
- UCL, upper confidence limit
- glaucoma
- prevalence
- open angle
- angle closure
Public health planning requires accurate estimation of disease burden for major disorders. We previously estimated the number with open angle glaucoma (OAG) and angle closure glaucoma (ACG),1 but since then, further surveys have appeared.2,3,4,5,6,7,8,9,10,11,12,13,14,15,16,17,18,19,20,21,22,23,24,25 In addition, a standardised definitional structure of OAG and ACG was proposed to compare prevalence in glaucoma studies.26 We estimate the number with OAG and ACG for 2010 and 2020 using prevalence models constructed by age, sex, and ethnicity.
METHODS
Age and sex specific population projections by 5 year grouping of adults over age 40 years were obtained (http://esa.un.org). We selected the dominant ethnic group for each of eight regions: (1) Middle East/North Africa group (Armenia, Azerbaijan, Bahrain, Cyprus, Georgia, Iraq, Jordan, Kuwait, Lebanon, Palestine, Oman, Qatar, Saudi Arabia, Syria, Turkey, United Arab Emirates, Yemen, Algeria, Egypt, Libya, Morocco, Sudan, Tunisia, Western Sahara); (2) European derived group (Europe including Russian Federation and Ukraine, Bermuda, Canada, Greenland, United States, Australia, New Zealand, Israel); (3) Latin American group (Mexico, Central and South America); (4) African group (countries south of the Sahara, excluding North African states included in Middle East/North Africa, but including the Caribbean States); (5) South East Asia group (Oceania, Brunei, Cambodia, Indonesia, Laos, Malaysia, Burma, Philippines, Singapore, Thailand, Vietnam); (6) Indian group (Afghanistan, Bangladesh, Bhutan, India, Iran, Kazakhstan, Kyrgyzstan, Maldives, Nepal, Pakistan, Sri Lanka, Tajikistan, Turkmenistan, Uzbekistan); (7) China group (China, Hong Kong, Macao, North Korea, South Korea, Mongolia); and (8) Japan.
The literature search yielded 2158 items, including 111 reports identified before 1995.1 Included studies satisfied the following criteria: (1) random population based sampling; (2) >50% examination rate; (3) >50% had visual field testing; (4) disc evaluation by an ophthalmologist; (5) definition of OAG independent of intraocular pressure (IOP); (6) definition of ACG compatible with Foster et al26; and (7) definition of glaucoma included both optic disc and visual field damage. Thirty four studies satisfied the criteria (new studies since 1995.2,3,4,5,6,7,8,9,10,11,12,13,14,15,16,17,18,19,20,21,22,23,24,25 and 11 studies included in previous report27–37).
Ten studies included previously1 were excluded, owing to: (1) no population based sample38–40; (2) majority not visual field tested41–44; or (3) IOP level used to define OAG.45–47 Normal tension glaucoma and exfoliation syndrome were included as OAG. We included “definite” and “probable” cases as OAG.
The age specific prevalence for the eight population groups was derived by regional models separately for OAG and ACG. The reports used were: Europe OAG,2,3,7,12,15,24,27,28,30–32,34,35 Europe ACG,5,7,27,28,30,32,35 Africa OAG,6,19,20,29,33,35 Africa ACG (Europe estimate used), India OAG,8,14,17,18,22 India ACG,9,14,17,23 China and South East Asia OAG,4,10,11 China and South East Asia ACG,4,10,11,37 Japan OAG,13,25,36 Japan ACG,36 Latin America OAG,16,21 Latin America ACG (Europe estimate used), and Middle East/North Africa OAG and ACG (Europe estimates used).
We assessed age specific prevalence with generalised estimating equations (GEE), assuming a binomial probability distribution to model prevalence, and exchangeable correlation structure,48 accounting for different number of people among studies. For the Japan ACG group with only one study, a logistic regression model was used. The logit estimate from the GEE or logistic regression models was used to estimate age specific prevalence rates and upper and lower 95% confidence intervals. Prevalence was set to zero at age 35.
The age specific prevalence by region was multiplied by the number of people estimated in each 5 year age group to give the total number with OAG and ACG. For OAG, there was no preponderance of evidence that prevalence was related to sex. For ACG, women were more often affected and the sex adjustment for ACG cases varied regionally (male/female ratio) as follows: Africa = 7/17, Europe = 3/15 (used for Latin America and Middle East), China = 11/17 (used for South East Asia and Japan), and India = 1/3.
The ACG prevalence model for European people was constructed from seven available studies. This model was also applied to Latin America, Africa, and Middle East.
Glaucoma blindness was estimated from proportions suggested by Foster et al49—that is, 10% of those with OAG and 25% of those with ACG were assumed to be bilaterally blind.
RESULTS
The average percentage of people examined among those in the selected sample was 80.9% (10.3%) (mean (SD); 32 studies). The percentage known to have glaucoma before survey was 26.0% (21.5%) for OAG (n = 25 studies) and 28.6% (38.4%) for ACG (n = 7). The OAG previous diagnosis rate in developed countries was 34%, while in developing countries it was 8%. The previous ACG diagnosis rate was 67% in developed countries and 0.1% in developing countries.
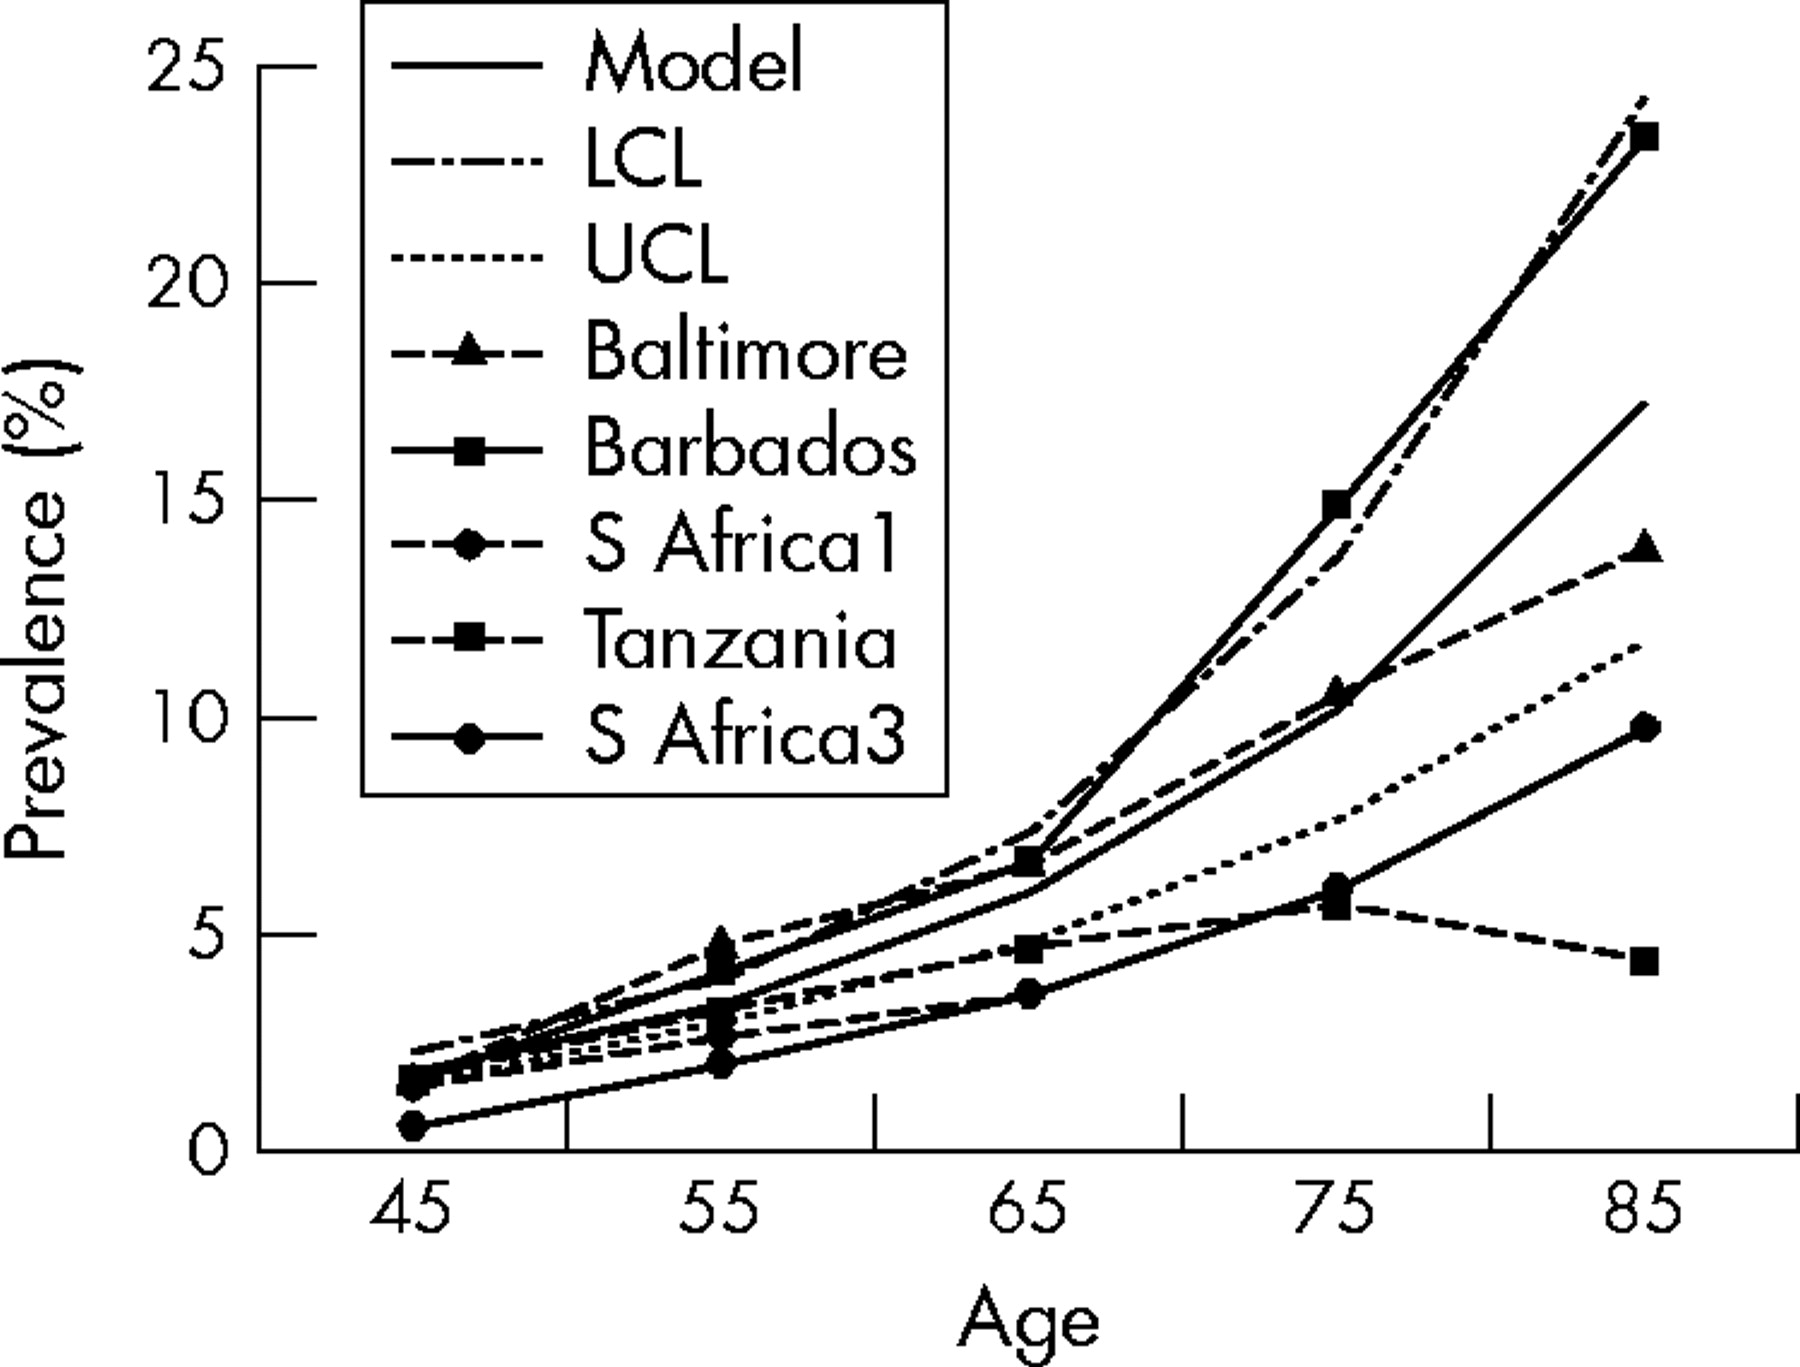
OAG was most prevalent among African derived people (fig 1). In both Latin American and Chinese regions, prevalence approached that of African people in the oldest age groups. OAG prevalence for Indian, European, and Japanese people was lower and similar to each other. ACG prevalence was highest among Chinese people, intermediate in Japanese, and lower in Europeans and Indians (fig 2). The model confidence limits were relatively narrow for the Africa OAG group (fig 3), while India ACG confidence limits were wider (fig 4).

The prevalence model data showing age specific prevalence of open angle glaucoma (OAG) for the six major ethnic groups (as defined in Methods) among whom qualifying studies have been performed. Prevalence is highest among the African and Latin American groups.

Prevalence model data for the age specific prevalence of angle closure glaucoma (ACG), highest in the China group, second highest among Japanese, and lowest in European and Indian groups (as defined in Methods).

Prevalence model for Africa group: open angle glaucoma (OAG) data are relatively closely grouped among the studies in age specific prevalence. This, combined with the relatively large number of studies of this ethnicity, results in narrow confidence limits for the prevalence estimates (only five of six qualifying studies are shown). (LCL, UCL = lower and upper 95% confidence limit of model estimate, respectively).

Data for India group and its prevalence model: angle closure glaucoma (ACG) prevalence shows large differences among the three studies shown, with consequently wide confidence limits for the model prevalence estimate. (LCL, UCL = lower and upper 95% confidence limit of model estimate, respectively).
The estimated number with both OAG and ACG was 60.5 million for 2010 (95% CI: 44.4, 85.4 million; table 1). The largest absolute number with OAG and ACG was in China, followed by Europe and India. Africa had the highest ratio of glaucoma to adult population, followed by Japan and Latin America. Regions with many affected by glaucoma had either higher prevalence (Africa, Japan), proportionately more older people (Europe), or both (China, India).
Number of people with OAG and ACG combined, 2010
The absolute number with OAG in 2010 was highest among European derived people (table 2). The European group represented 23.9% of those with OAG worldwide, while Asian regions had 47% of OAG people.
Number of people with OAG, 2010
The greatest number with ACG in 2010 were in China (47.5% of the total), and 86.5% of those affected by ACG were in Asia (table 3). In 2010, 74.0% of those with glaucoma had OAG and 26.0% had ACG (95% CI OAG: 70.4% to 76.4% and ACG: 23.6% to 29.6%).
Number of people with ACG, 2010
We found that the mean prevalence for OAG worldwide in 2010 was 1.96%, while that for ACG was 0.69% (table 4). Women were disproportionately affected by glaucoma, representing 59.1% of all people with glaucoma (95% CI: 59.0% to 59.2%), substantially more than the 51.5% of the world population over age 40 that will be female in 2010. For OAG, the greater number of women affected derived from their greater longevity. For ACG, both higher prevalence and greater longevity contribute to sex disproportion. Women comprised 55.4% of OAG (95% CI: 55.3% to 55.5%) and 69.5% of ACG (95% CI: 67.8% to 71.2%).
Percentage >40 years of age by region with OAG and ACG, 2010
The bilateral blindness rate from all eye diseases including the glaucomas was 1.5% (1.8%) (n = 11 studies). In developed countries, 0.37% of adults over age 40 were blind (n = 6), compared to 4.2% in three African countries. The number estimated blind from OAG in 2010 was 4,472,083 (95% CI: 3,389,534 to 6,018,289) and from ACG 3,936,241 (95% CI: 2,623,271, to 6,312,805), for a combined total of 8,408,324 (95% CI: 6,012,805 to 12,331,095). While only 24% of those with primary glaucoma have ACG, the number of ACG blind is nearly equal to that of OAG because of the greater estimated morbidity of this disease.
For 2020, the model calculations show that OAG and ACG will increase by 20 million people over the decade (table 5).
Number of people with OAG and ACG combined, 2020
By 2020, India will become second overall in number with glaucoma, surpassing Europe. There will be six million more Chinese people with glaucoma. In 2020, the Europe region will still contain the greatest number of people with OAG (table 6), and the proportion of all those with ACG that live in Asian regions will increase further to 87.6%. The total with OAG will be 58.6 million, while the number with ACG will rise to 21.0 million (table 7). The number estimated to be bilaterally blind from glaucoma in 2020 will increase to 11,114,117 (95% CI: 7,947,390 to 16,230,278), comprising 5,863,953 blind from OAG and 5,250,164 blind from ACG.
Number with OAG in 2020
Number with ACG in 2020
DISCUSSION
The present analysis more precisely estimates the number with glaucoma worldwide. By 2010, 60 million people will have OAG and ACG, and glaucoma will be the second leading cause of world blindness. These estimates could be improved with surveys from regions such as North Africa and the Middle East. OAG was estimated to affect 2.22 million people in the United States in 2002.50 Our model predicts that there will be 2.79 million people with OAG in the United States in 2010. The difference may be explained by increases in the number of older people in the 8 year period and by differences in the models. Likewise, it was predicted that 9.4 million Chinese people had OAG and ACG in 2001.49 Our models predict for 2010 that 9.2 million will have either OAG or ACG in China. We used only population based studies, defined OAG without regard to IOP level,26 required both disc and field tests to define glaucoma, and compared the definitions reported to a standard definitional structure. Wolfs et al evaluated this definition for OAG,51 determining that it was likely to specify those with definite disease. Failure to test the field can miss up to one third of those with OAG.52 Disc examination alone is not specific enough and studies that use “expert” subjective assessment of disc and field may not be reproducible.53–57 To permit comparison among studies, those who prefer expert assessment might report data by a standard method to place their work in perspective.
We divided the world into regions whose specific groupings could be criticised as arbitrary. The designation of a region as representing people derived from Africa understates the variety of ethnicities making up each African nation state. Designations such as “Hispanic” may be sociocultural designations rather than definable entities. We did not subdivide populations within individual countries by ethnicity, since sensitivity analyses showed that world estimates would be affected little (data not shown).
Over 80% of those with ACG live in Asia, while OAG disproportionately affects those of African derivation. Women are more affected by glaucoma because of their greater prevalence of ACG, as well as their relatively greater longevity. Since women are estimated to have twice as much visual impairment and blindness overall compared to men,58 more attention should be placed on the delivery of eye care services to women. From 2010 to 2020, the most detectable change in glaucoma worldwide will be its increase in India. As the proportion of those over age 40 increases, the proportional increase in glaucoma will challenge our resources and ingenuity.
Over 8.4 million people will be bilaterally blind from primary glaucoma in 2010, rising to 11.1 million by 2020. Previous estimates based on blindness prevalence surveys58 suggested that 12% of world blindness (4.4 million people) was caused by glaucoma. The two estimates differ because of methodological issues. Blindness prevalence surveys often assign the most “treatable” disease as the primary cause of blindness. It is often assumed that cataract is more treatable than glaucoma. This leads to underestimation of glaucoma blindness.
In summary, glaucoma is second only to cataract among visual disorders. There are glaucoma treatments available in the developed world that reduce glaucoma disability. It is important to improve diagnostic and therapeutic approaches to OAG and ACG that can be applied worldwide.
Acknowledgments
The authors thank Karen Bandeen-Roche, PhD, for biostatistical consultation, and are appreciative of data shared by Paul Foster, Rupert Bourne, and L Vijaya.
REFERENCES
Footnotes
-
Supported in part by PHS Research Grants 02120 (Dr Quigley), 01765 (Core Facility Grant, Wilmer Institute), and the Leonard Wagner Trust, New York.
-
Competing interest: none declared
Linked Articles
- Editorial
- BJO at a glance