Article Text

Abstract
Background: Phacoemulsification, day case surgery and Action on Cataracts have increased the national capacity for cataract surgery in England.
Aims: To examine time trends and geographical variation in rates of cataract surgery, and to determine whether there is evidence of overcapacity in current levels of surgical provision.
Methods: Hospital episode statistics (HES), the hospital inpatient enquiry (HIPE) and the Oxford record linkage study (ORLS) were analysed for cataract admissions between the 1960s and 2003.
Results: Annual rates of admission for cataract surgery in England rose 10-fold from 1968 to 2003: from 62 episodes per 100 000 population in 1968, through 173 in 1989, to 637 in 2004. The overall increase in cataract surgery was reflected by increases in every age group for both men and women. Geographical analysis showed that there was wide variation across local authority areas in annual rates of cataract surgery, from 172 to 548 people per 100 000 population in 1998–2003. The rate of surgery by local authority was positively correlated with the index of multiple deprivation (r2 = 0.24).
Conclusion: The huge increase in cataract surgery over time and the wide geographical variation in rates, raise the question of whether there is now overcapacity for cataract surgery. High levels of social deprivation are associated with high rates of cataract surgery; this may be due to an increased prevalence of cataract or differences in referral patterns.
- HES, hospital episode statistics
- HIPE, hospital inpatient enquiry
- IMD, index of multiple deprivation
- ISTCs, Independent Sector Treatment Centres
- LA, local authority
- NHS, National Health Service
- ORLS, Oxford record linkage study
- cataract surgery
- phacoemulsification
- surgical capacity
- social deprivation
- geographical variation
Statistics from Altmetric.com
- HES, hospital episode statistics
- HIPE, hospital inpatient enquiry
- IMD, index of multiple deprivation
- ISTCs, Independent Sector Treatment Centres
- LA, local authority
- NHS, National Health Service
- ORLS, Oxford record linkage study
- cataract surgery
- phacoemulsification
- surgical capacity
- social deprivation
- geographical variation
Ophthalmologists and epidemiologists in the 1990s described a national deficit in the provision of cataract surgery, and predicted an increasing backlog of unoperated cataract, exacerbated by an ageing population.1 However, changes in practice and government initiatives have led to significantly increased capacity. The report Action on Cataracts2 provided a framework for an increased volume of surgery, through widespread use of phacoemulsification, local anaesthesia and day case surgery. Growing Capacity3 introduced commissioning of external providers (Independent Sector Treatment Centres (ISTCs)) to perform additional operations on National Health Service (NHS) patients.
Cataract surgery is now the most commonly performed elective operation in the NHS, with 301 656 operations carried out in the financial year 2003–4.4 Anecdotal reports from many regions indicate that waiting times for surgery have fallen dramatically and that patients are undergoing intervention at younger ages. Across England, some primary care trusts have recently commissioned cataract surgery from external providers far in excess of actual demand. We have examined trends over time in national and regional rates of cataract surgery, and geographical differences in rates, to determine the scale of change and variation and, further, to determine whether there is evidence of overcapacity in current levels of surgical provision.
METHODS
Hospital episode statistics (HES) data are collected by the Department of Health as a statistical database of demographic, medical and administrative information about all admissions to NHS hospitals in England and admissions funded by the NHS for treatment elsewhere,5 including external providers such as ISTCs. HES include data on day cases as well as inpatients admitted for overnight stays. HES replaced the hospital inpatient enquiry (HIPE) in England in 1989, after a transition period of 3 years for which NHS data are unavailable. HIPE was a 1 in 10 sample of all inpatients in NHS hospitals in England; it did not generally include day cases. Annual admission rates for operations on cataract were calculated from HIPE and HES for the years 1968–2003.
The Oxford record linkage study (ORLS) consists of computerised abstracts of hospital episode statistics, including day cases, for all patients treated in the former Oxford Regional Health Authority area.6 Data relating to successive episodes of care for each person are linked, so that data about individual people can be traced through multiple episodes of care. In the mid-1980s, the NHS introduced the “consultant episode” as the method of counting episodes of hospital care. This means that patients who are transferred between consultants during a single admission are counted as two (or more) episodes in the national datasets. Data linkage in the ORLS allows patients in receipt of care to be identified as individuals, as well as being represented by two episodes of admission (in the case of readmission) or as two episodes under different consultants (in the case of a within-hospital transfer). Admission rates were calculated for the ORLS area, distinguishing episodes of care and individual people treated, from 1963 to 2003.
English national HES were analysed to produce a geographical profile of hospital admission for cataract by local authority (LA) between 1998 and 2003.7 The data were used to create a map showing the person-based admission rate per 100 000 resident population for each LA, expressed as an average annual rate. The LAs were arranged into quintiles: the fifth of LAs with the lowest rates are shown with the lightest colour, and the fifth of LAs with the highest rates are shown with the darkest colour.
The data were also used to create an error bar chart, where each vertical line represents one LA; the point estimate for the admission rate is shown along with its 95% confidence intervals. Finally, the admission rate for each LA was plotted against its score for the index of multiple deprivation (IMD 2004).8 The IMD is a measure of social deprivation, which we used at the level of the LA area; it is calculated as a weighted measure in seven distinct domains of deprivation, including income, employment and health.8 The datasets are anonymised; approval to analyse them in a programme of research undertaken by the Unit of Health-Care Epidemiology, Oxford University, was obtained through the NHS Central Office for Research Ethics Committees (reference 04/Q2006/176).
RESULTS
Figure 1 shows the English national admission rates for cataract surgery. Annual admission rates for surgery were just over 60 episodes per 100 000 population in the late 1960s. They rose steadily, but gradually, to around 100 episodes per 100 000 population by the early 1980s. Over the past 15 years, the rate of surgery has increased very substantially from 173 (1989) to 637 (2004) episodes per 100 000 population.

Hospital admission rates for cataract surgery in England: rates per 100 000 population, 1968–2003. HIPE, hospital inpatient enquiry; HES, hospital episode statistics.
Figure 2 shows the ORLS admission rates for cataract surgery. ORLS rates remained relatively constant from 1963 to the late 1970s, then showed a gradual increase through the 1980s, and thereafter rose dramatically through the 1990s to the present. Unlike the national data, the ORLS included day case admissions throughout the early years; however, day case care was used for cataract surgery in only one health district in the former Oxford region before the early 1980s.9 The ORLS data show rates based on the number of people admitted to hospital for cataract surgery as well as the number of episodes of care for surgery (episodes of separate admission or transfers within an admission, or both). It shows that the scale of multiple admissions per person was small, although an increase in multiple recording is evident in recent years as seen in the recent divergence between the rates for episodes and people (fig 2). The figure confirms that the large increase in hospital episodes in the 1990s represents a large increase in the number of people treated. It also shows, more accurately than the English figures (which omit data for 1986–8), that the start of rapid increase in surgery was about 1989–90.

Hospital admission rates for cataract surgery in the Oxford record linkage study (ORLS) area: rates per 100 000 population, 1963–2003.
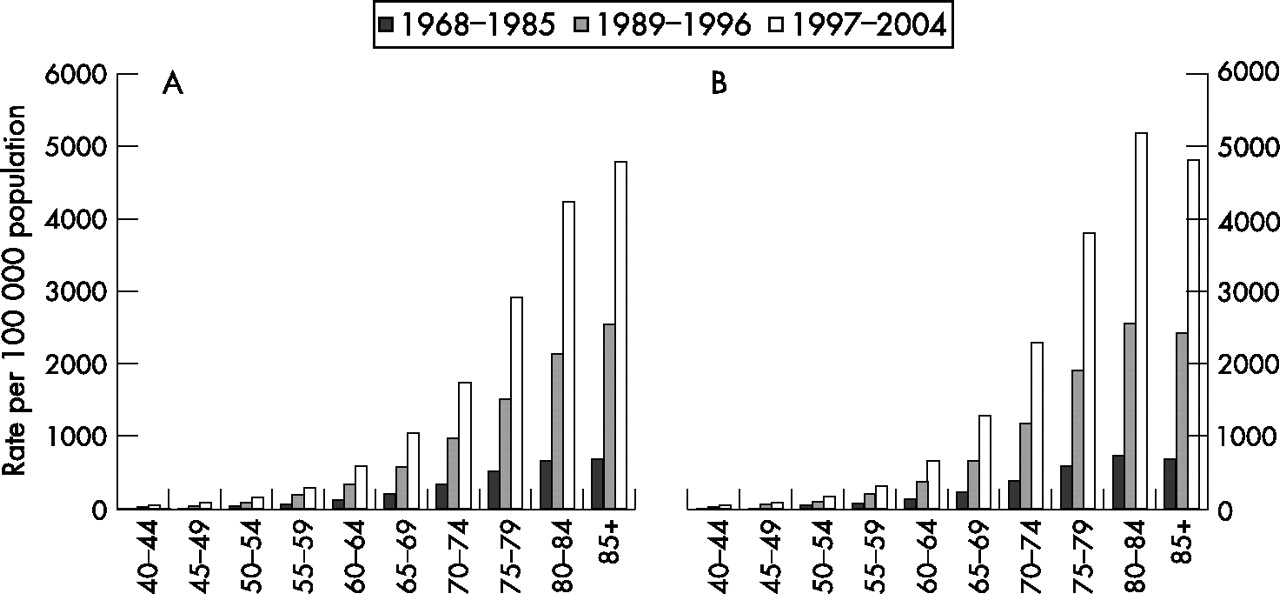
Figure 3 presents national admission rates for cataract surgery analysed by age and sex, and over three time periods (1968–1985, 1989–1996 and 1997–2004) for men and women separately. Three contrasting time periods were selected: one relatively long historical period, when rises in rates were fairly modest, and two more recent periods, when rises were substantial. Over these time periods, the rate of cataract surgery increased significantly in every age group for both men and women—that is, all age groups were represented in the overall increase in cataract surgery. Logarithmic calculation demonstrates that these recent rises have been roughly exponential. Trends over time have been similar for men and women, with admission rates approaching 5000 per 100 000 population for both sexes over the period 1997–2004. As women tend to outlive men and make up the majority of the elderly population, the rate of cataract surgery for all ages combined is higher for women than for men. In addition, the age-specific rates illustrate that women have higher rates of cataract surgery than men within most age groups over 60 years.

Figures 3 Age- and sex-specific hospital admission rates for cataract surgery in England. (A) Men; (B) women.
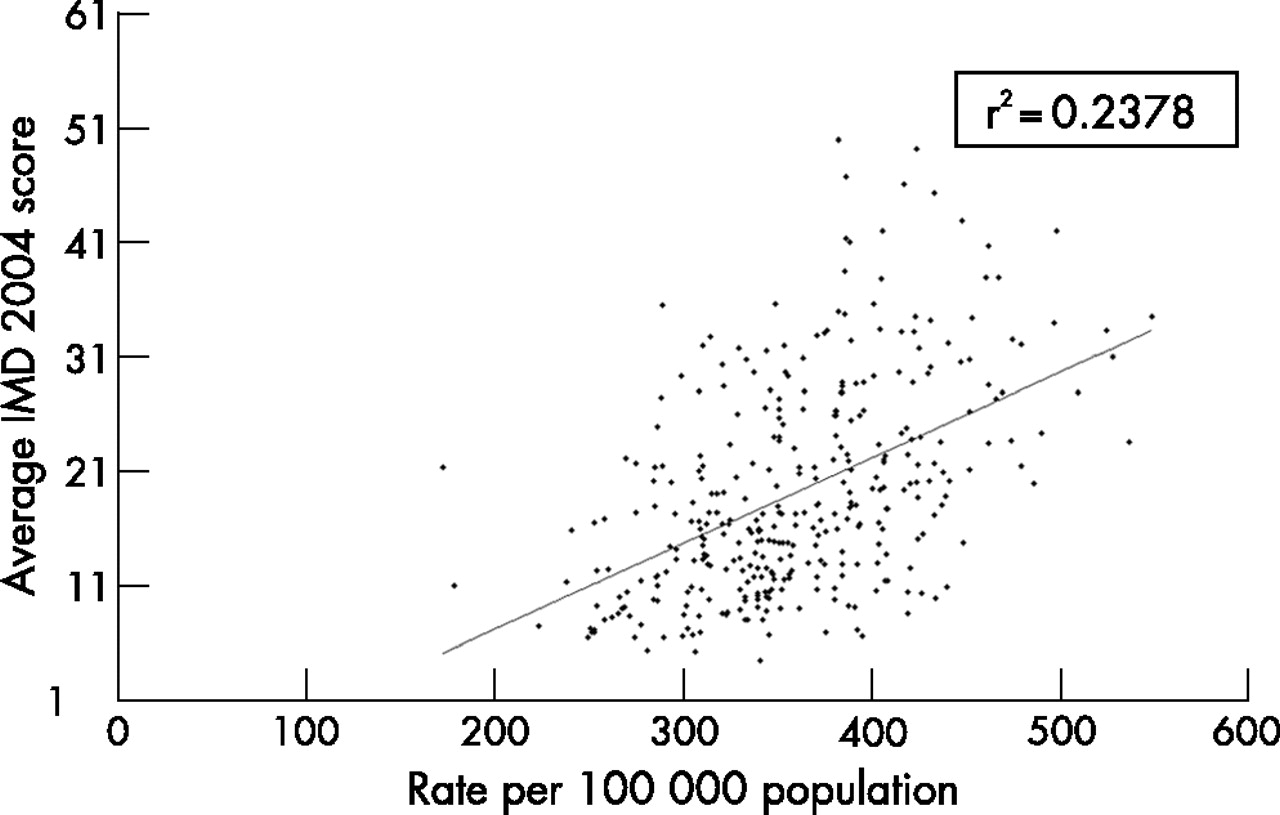
Figure 4 shows a geographical profile of the annual rate of cataract surgery by LA. LAs showed a wide variation in rates of cataract surgery, ranging from 172 to 548 people per 100 000 population. Figure 5 illustrates the scale of variation; it shows that wide variation is attributable not just to small numbers of atypical outlying areas, but that there is a general gradation of highly varying rates across the country. As seen in the error bars, the variation is highly statistically significant. Further details, including figures for individual LAs, can be found at the atlas section of the Unit of Health-Care Epidemiology website.7 The rate of surgery by LA showed a positive correlation with the index of multiple deprivation (r2 = 0.24). In general, the greater the deprivation in an area, the higher the rate of cataract surgery, as illustrated in fig 6.

Map of hospital admission rates for cataract surgery across England, showing rates for each local authority area with expansions for Manchester, West Midlands and London, with quintiles of rates from highest (darkest shading) to lowest (lightest shading).

Error bar plot of local authority rates of cataract surgery, plotted from highest to lowest, showing each area as a plotted rate (with its 95% confidence interval shown as the vertical bar on the plotted rate).

Scatter plot in which each point represents a local authority area, with the area’s admission rate for cataract surgery plotted against the area’s index of multiple deprivation (IMD) score.
DISCUSSION
National and regional rates of cataract surgery increased dramatically from the late 1980s with the widespread uptake of phacoemulsification and day case surgery. The Oxford data showed a 10-fold increase from 1963 to 2003. The Oxford and the English data showed a fivefold increase from the late 1980s to 2003. Once elimination of the backlog of unoperated cataract has been achieved, we predict that operation rates will reach steady-state levels, equivalent to the incident rate of symptomatic cataract.
Rates of cataract surgery differed widely among LAs in England, with high levels of social deprivation being associated with high rates of cataract surgery. This association may be explained by increased prevalence of cataract or by differences in referral patterns, and it is beyond the scope of this paper to attempt to distinguish between these possibilities. Increased prevalence of cataract in areas of deprivation might be explained by higher levels of smoking,10 poor diet (containing fewer antioxidants) and increased prevalence of associated medical conditions such as diabetes mellitus. Referral patterns may also explain the association: because patients now have increased choice, they may be attracted towards larger ophthalmic centres with higher surgical turnover. These are typically found in cities, where levels of deprivation may coincidentally be higher.
HES are limited by the exclusion of surgery conducted in the private sector. As the use of private health care has generally increased over the study period, it can be assumed that the increase in cataract surgery in the NHS, demonstrated in particular in our data from the late 1980s, is an underestimate of the real increase in cataract surgery in England over the same time period. In addition, the absence of data from the private sector may partly explain the socioeconomic gradient observed above.
The fact that cataract surgery has increased so much in recent years raises questions as to whether it is now undertaken too readily in some cases, and whether long backlogs of clinical need for surgery are still being cleared. The fact that there is substantial geographical variation in cataract surgery raises similar questions as to whether areas with high rates are “overservicing” in relation to need or whether areas with low rates are “underproviding” care. It is outside the brief of this paper to distinguish between appropriate and inappropriate rates of cataract surgery. However, appropriate thresholds for intervention could be agreed nationally, taking into account symptoms, visual acuity and functional impairment. For example, ophthalmologists in New Zealand (where the health system is publicly funded) routinely use clinical priority assessment criteria to prioritise patients with cataract for surgery.11 If used in England, this would permit more meaningful comparison and greater standardisation between regions, as the criteria are based on clinical need rather than surgical capacity and waiting times in a particular region.
Accurate predictions of capacity and demand are essential for the planning of regional and national ophthalmic services. This requires modelling of cataract prevalence, population demographics12 and rates of surgery, rather than consideration of short-term markers such as waiting times, which can be temporarily influenced by waiting time initiatives and population fluxes. A shortfall in capacity would be detrimental to patients. However, the possibility of overcapacity in England would have profound financial implications for the commissioning of surgery by primary care trusts, and for professional training.
Acknowledgments
Some of these data were presented by the first author at the United Kingdom and Ireland Society of Cataract and Refractive Surgeons (UKISCRS) Meeting (London, September 2006), where he was awarded the Founder’s Gold Medal.
Footnotes
-
Published Online First 31 May 2007
-
Funding: The Unit of Health-Care Epidemiology is funded to undertake research on the regional and national hospital databases by the English NHS National Centre for Research Capacity Development.
-
Competing interests: None declared.