Article Text

Aims The aims of this study were to examine trends over time and regional variation in rates of corneal graft surgery in the UK.
Methods The hospital in-patient enquiry (HIPE) and hospital episode statistics (HES) were analysed for keratoplasty admissions in England from 1971 to 2006. NHS Blood and Transplant (NHSBT) data were analysed for keratoplasty operations in the UK from 1999 to 2009.
Results Annual rates of penetrating keratoplasty (PK) under HIPE and HES increased from 0.7 per 100 000 population (1971) to 3.9 (1992), then decreased to 3.1 (2006). Rates of lamellar keratoplasty (LK) increased from 0.1 (1971) to 0.9 (2006). Annual PK operations under NHSBT decreased from 1901 (1999/00) to 1473 (2008/9). Over the same period, deep anterior lamellar keratoplasty operations increased from 91 to 327 per year, while endothelial keratoplasty operations increased from 2 to 569 per year. Geographical analysis showed a wide variation across local authority areas in rates of keratoplasty around 1998–2004, especially for LK.
Conclusion The total number of corneal graft operations performed in the UK has increased slowly over the past decade. The proportion of lamellar versus penetrating keratoplasty has increased, with LK performed at the highest rates in specialist centres distributed across the UK.
- Penetrating keratoplasty
- lamellar keratoplasty
- deep anterior lamellar keratoplasty
- endothelial keratoplasty
- cornea
- epidemiology
- treatment surgery
- eye (tissue) banking
Statistics from Altmetric.com
- Penetrating keratoplasty
- lamellar keratoplasty
- deep anterior lamellar keratoplasty
- endothelial keratoplasty
- cornea
- epidemiology
- treatment surgery
- eye (tissue) banking
Introduction
Corneal graft surgery has seen enormous changes since its birth over 100 years ago,1 including improvements in the processing and storage of corneal tissue in eye banks,2 3 more effective treatment of endothelial rejection and the introduction of lamellar surgical techniques.4–7 The prevalence of corneal disease may also have altered over time—for example, changes in the prevalence of pseudophakic bullous keratopathy requiring keratoplasty8–11 following the introduction and refinement of phacoemulsification cataract surgery.12 Finally, indications for surgery have shifted in recent years—for example, penetrating keratoplasty (PK) has commonly been performed for keratoconus,8–11 but alternative therapeutic options have emerged, including deep anterior lamellar keratoplasty (DALK),4–7 intracorneal rings13 and the advent of collagen cross-linking.14
The number of corneal graft operations performed in a country may be limited by finite supplies of corneal tissue. Accurate data on past and current practices in keratoplasty are therefore essential to predict future requirements. North America and Continental Europe have demonstrated interesting trends in the number of patients undergoing PK,15–18 but the last detailed studies of corneal transplantation in the UK were published in 1993.9 10 Similarly, a recent increase in lamellar keratoplasty (LK) versus PK is well known anecdotally, but robust data on the relative use of these approaches throughout the UK are not currently available in the published literature.
Methods
Annual admission rates for corneal graft surgery in England were calculated from the Hospital In-Patient Enquiry (HIPE) and Hospital Episode Statistics (HES) for the years 1971 to 2006, identifying PK and LK. These datasets have been described previously.12 From 1998 to 2004, rates for PK and LK were also calculated distinguishing episodes of care and individuals treated; individual patients who underwent corneal graft surgery were counted once only in each year, even if they had more than one episode of care on which corneal graft surgery was recorded. In the analysis of trends over time, English national population denominators for each calendar year were obtained from the Office for National Statistics. To take account of changes over the years in the age structure of the population, surgical rates were standardised for age and sex, using the indirect method of standardisation and taking age- and sex-specific rates in 5-year age groups for the total period as the standard population.
In addition, annual numbers of eyes undergoing corneal graft surgery in the UK were calculated from NHS Blood and Transplant (NHSBT) data for the period April 1999 to March 2009, identifying PK, DALK and endothelial keratoplasty (EK). This dataset is composed of information collected by NHSBT through the Transplant Record Form (TRF) for patients receiving donor corneal material in the UK from the Corneal Transplant Service (CTS). The TRF was introduced in April 1999, such that data are now available for 10 years (summarised by the NHS financial year, 1999/2000 to 2008/2009). This dataset includes information on patients receiving corneal grafts supplied by the two CTS eye banks, that is the Manchester Eye Bank and the Bristol Eye Bank, but over the study period did not capture information from the minority of patients (around 10%) receiving grafts from other eye banks, including the Moorfields Eye Bank and the East Grinstead Eye Bank. The accuracy of the NHSBT dataset is dependent on completion and return of TRF by every centre performing corneal graft surgery, such that figures may be more reliable for earlier years with a longer interval for collection of outstanding forms; however, the NHSBT Ocular Tissue Transplant Audit has demonstrated a return rate of 97% over the study period.
HES were analysed to produce geographical profiles of people admitted to hospital in England for both PK and LK, by local authority (LA) of patients' residence, between 1998/1999 and 2004/2005. The data were used to construct maps showing the person-based admission rate per 100 000 resident population for each LA, expressed as an average annual rate. As before, rates were calculated using the indirect method of age standardisation, taking age- and sex-specific rates in the English population, in 5-year age groups, and applying them to the age- and sex-specific strata in each local authority.
The operative codes used to identify corneal graft surgery from HIPE and HES datasets were: 145.1 for LK and 145.2 for PK in the Office of Population, Censuses and Surveys Classification of Surgical Operations and Procedures, 2nd revision (OPCS2), 145.1 for LK and 145.2 for PK in OPCS3, and C46.2 for LK and C46.3 for PK in OPCS4. Numerator and denominator data for HIPE and HES results are available from the authors on request.
Results
English national admission rates for PK are shown in figure 1. Annual rates for surgery were 0.7 (95% CI 0.6 to 0.8) episodes per 100 000 population in 1971. They increased slowly to 1.1 (1.0 to 1.2) in 1985. By the time that recording of HES started in 1989, the rate had already begun to increase sharply: it continued to increase rapidly from 2.5 (2.4 to 2.6) in 1989 to 3.9 (3.7 to 4.1) in 1992. Over the next decade, the rate of surgery decreased slowly to 3.1 (2.9 to 3.2) in 2001, followed by a plateau at around 3.0 (2.9 to 3.2) up until 2006.
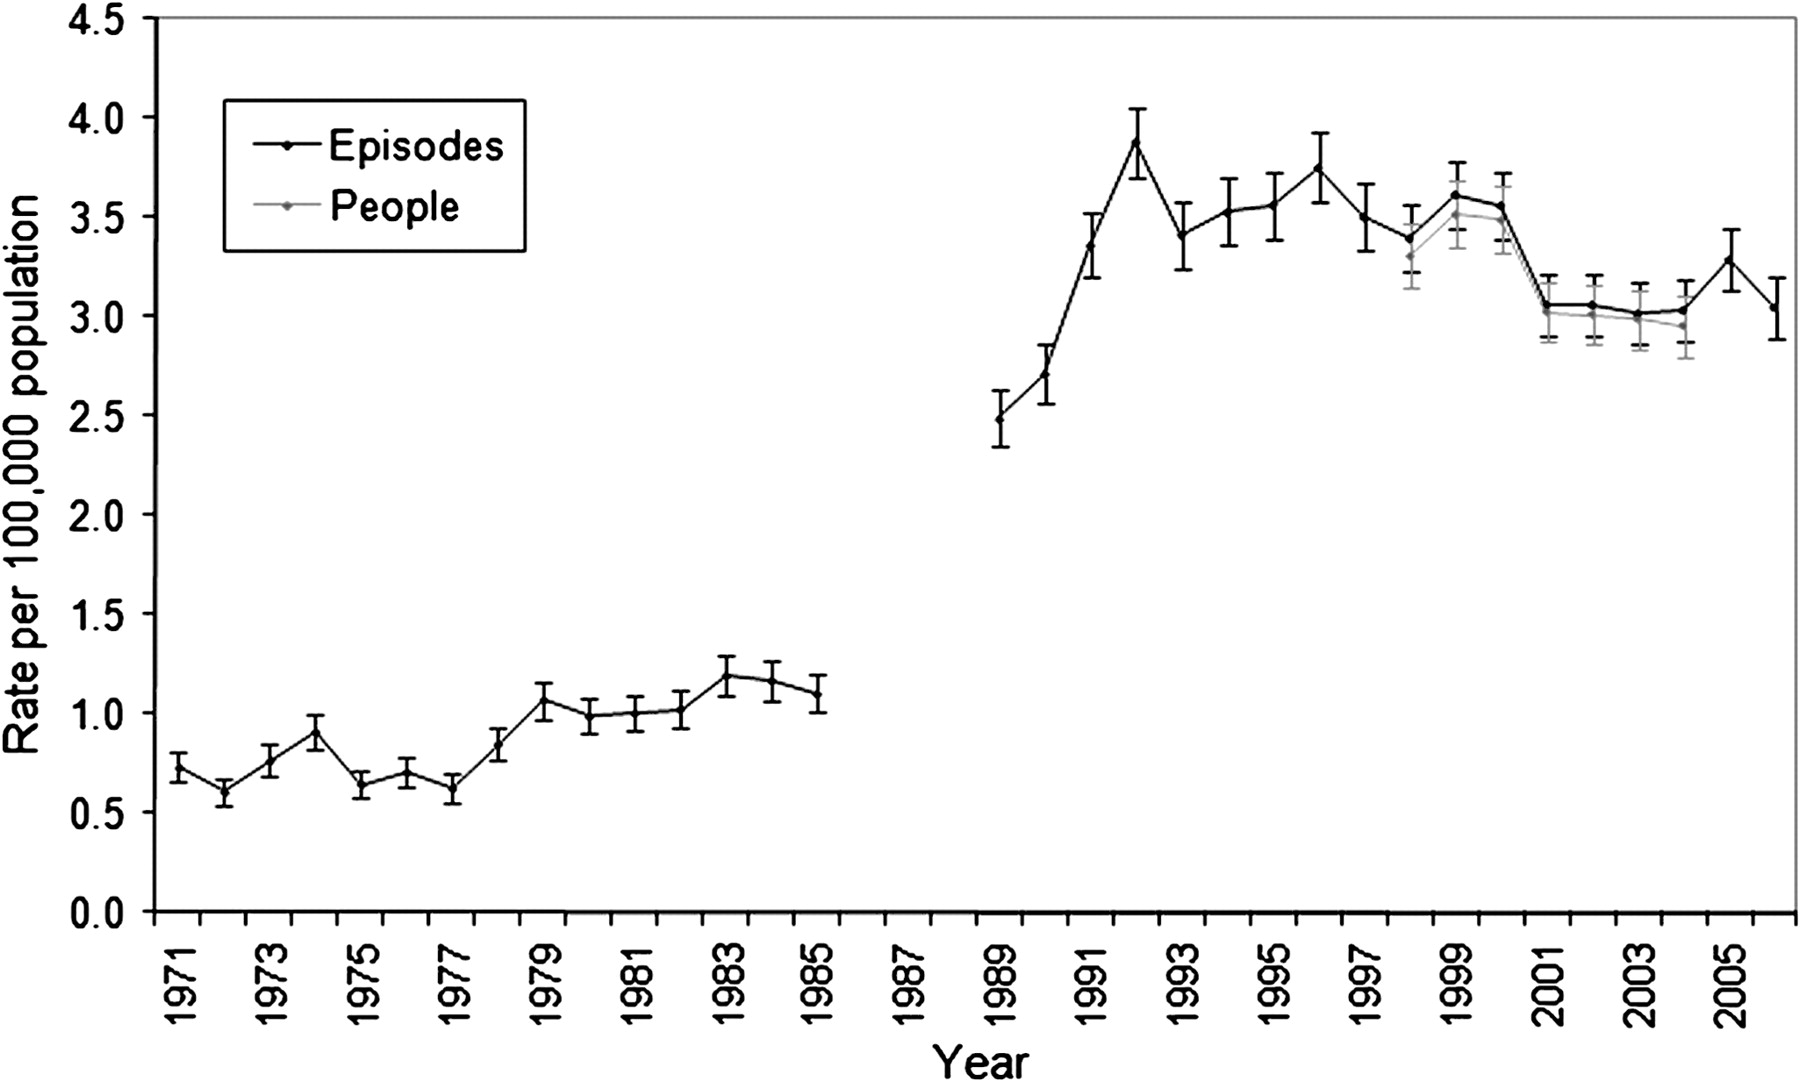
Hospital Episode Statistics admission rates for penetrating keratoplasty in England: annual rates per 100 000 population with 95% CI, 1971–2006.
English national admission rates for LK are shown in figure 2. Annual rates were 0.2 (0.16 to 0.24) in the early 1970s and declined to 0.1 (0.08 to 0.14) in the early 1980s. By 1989, the rate of surgery had begun to increase sharply: it continued to increase rapidly from 0.3 (0.20 to 0.30) in 1989 to 1.0 (0.89 to 1.07) in 2003. Over the following 3 years, surgical rates have shown a modest decline to 0.9 (0.77 to 0.93) in 2006.
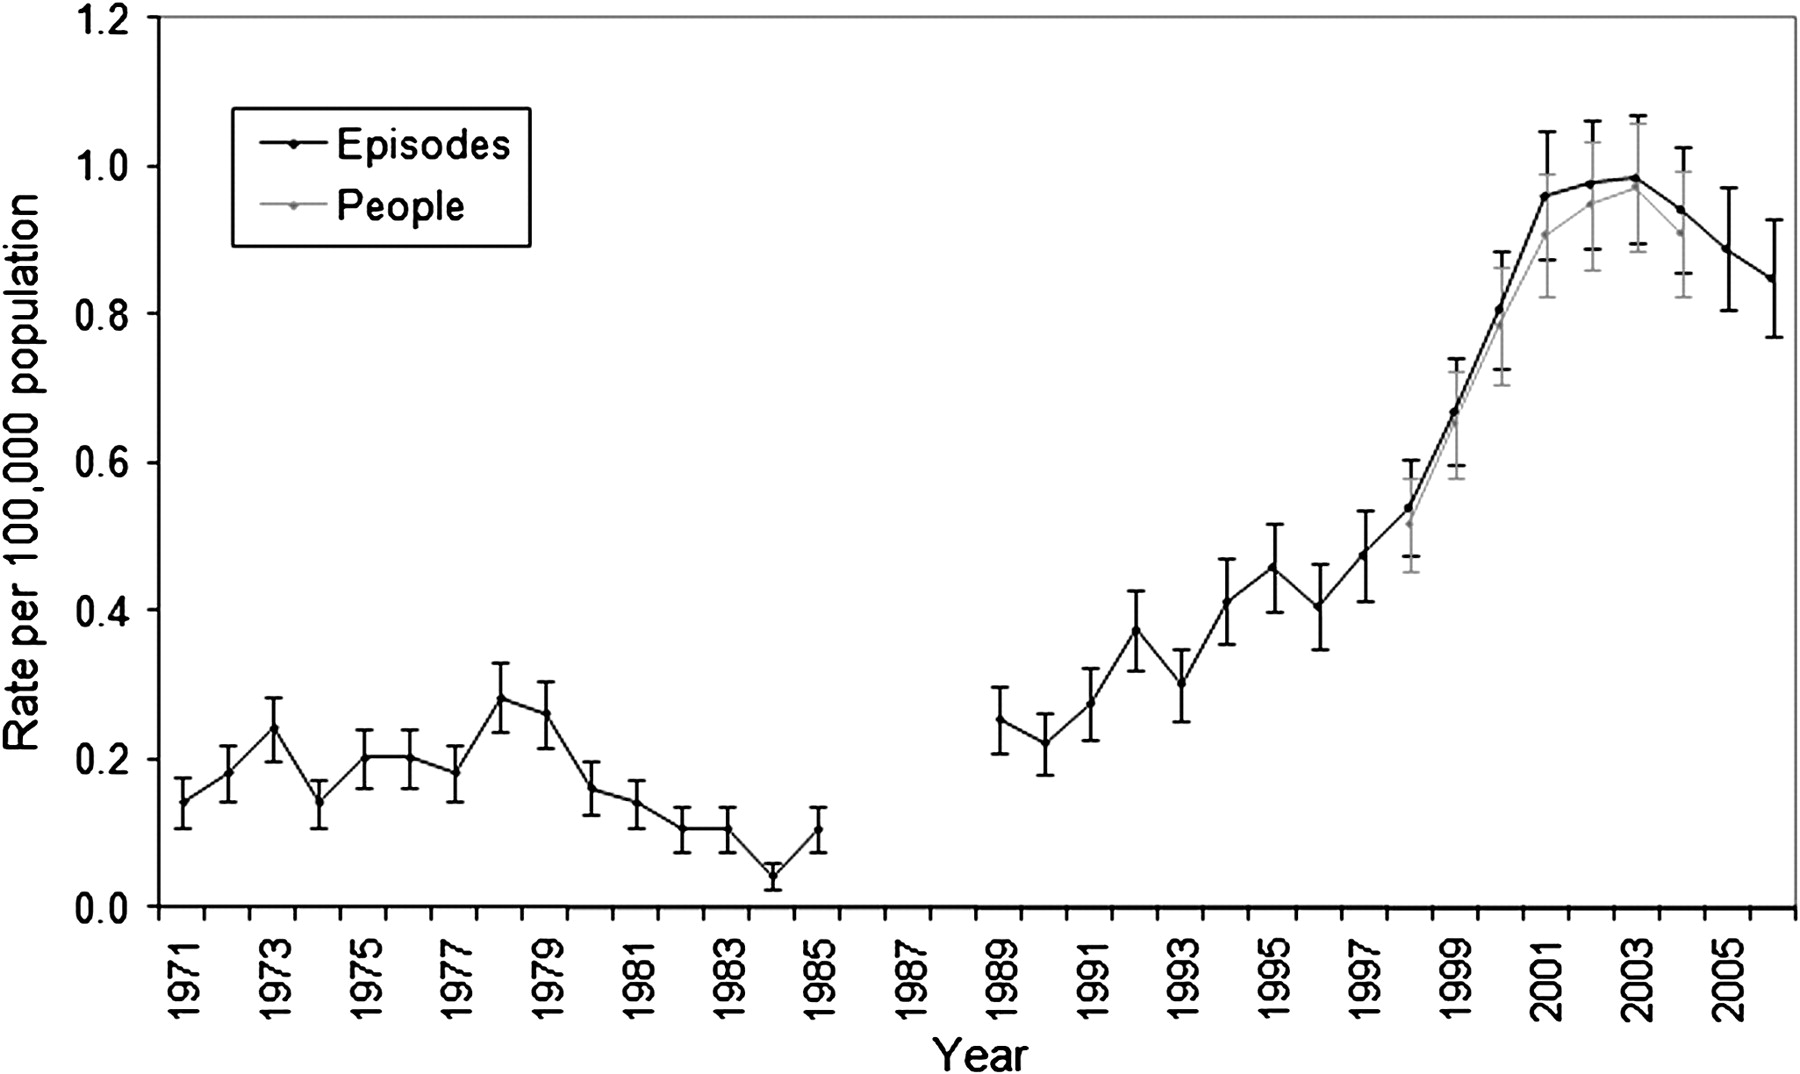
Hospital Episode Statistics admission rates for lamellar keratoplasty in England: annual rates per 100 000 population with 95% CI, 1971–2006.
Annual numbers of eyes undergoing PK in the UK, obtained from NHSBT data, are shown in figure 3. The number of PK operations remained fairly constant at around 2000 per year during the period 1999/2000 to 2005/2006. PK accounted for 91% of all corneal grafts in 1999/2000, but the proportion declined gradually to 80% in 2005/2006, as the total number of corneal grafts performed increased slowly over this period. The number of PK operations then decreased over the following 3 years to 1473 (60%) in 2008/2009. Annual numbers of eyes undergoing DALK are also shown in figure 3. The number of operations increased in roughly linear fashion from 91 (4%) in 1999/2000 to 304 (13%) in 2006/2007. A modest decline to 288 (12%) in 2007/2008 was followed by a further increase to the highest level recorded of 327 (13%) in 2008/2009. Finally, annual numbers of eyes undergoing EK are shown in figure 3. The number of operations increased roughly exponentially from 2 (0.1%) in 1999/2000 to 447 (19%) in 2007/2008, and increased further to 569 (23%) in 2008/2009.
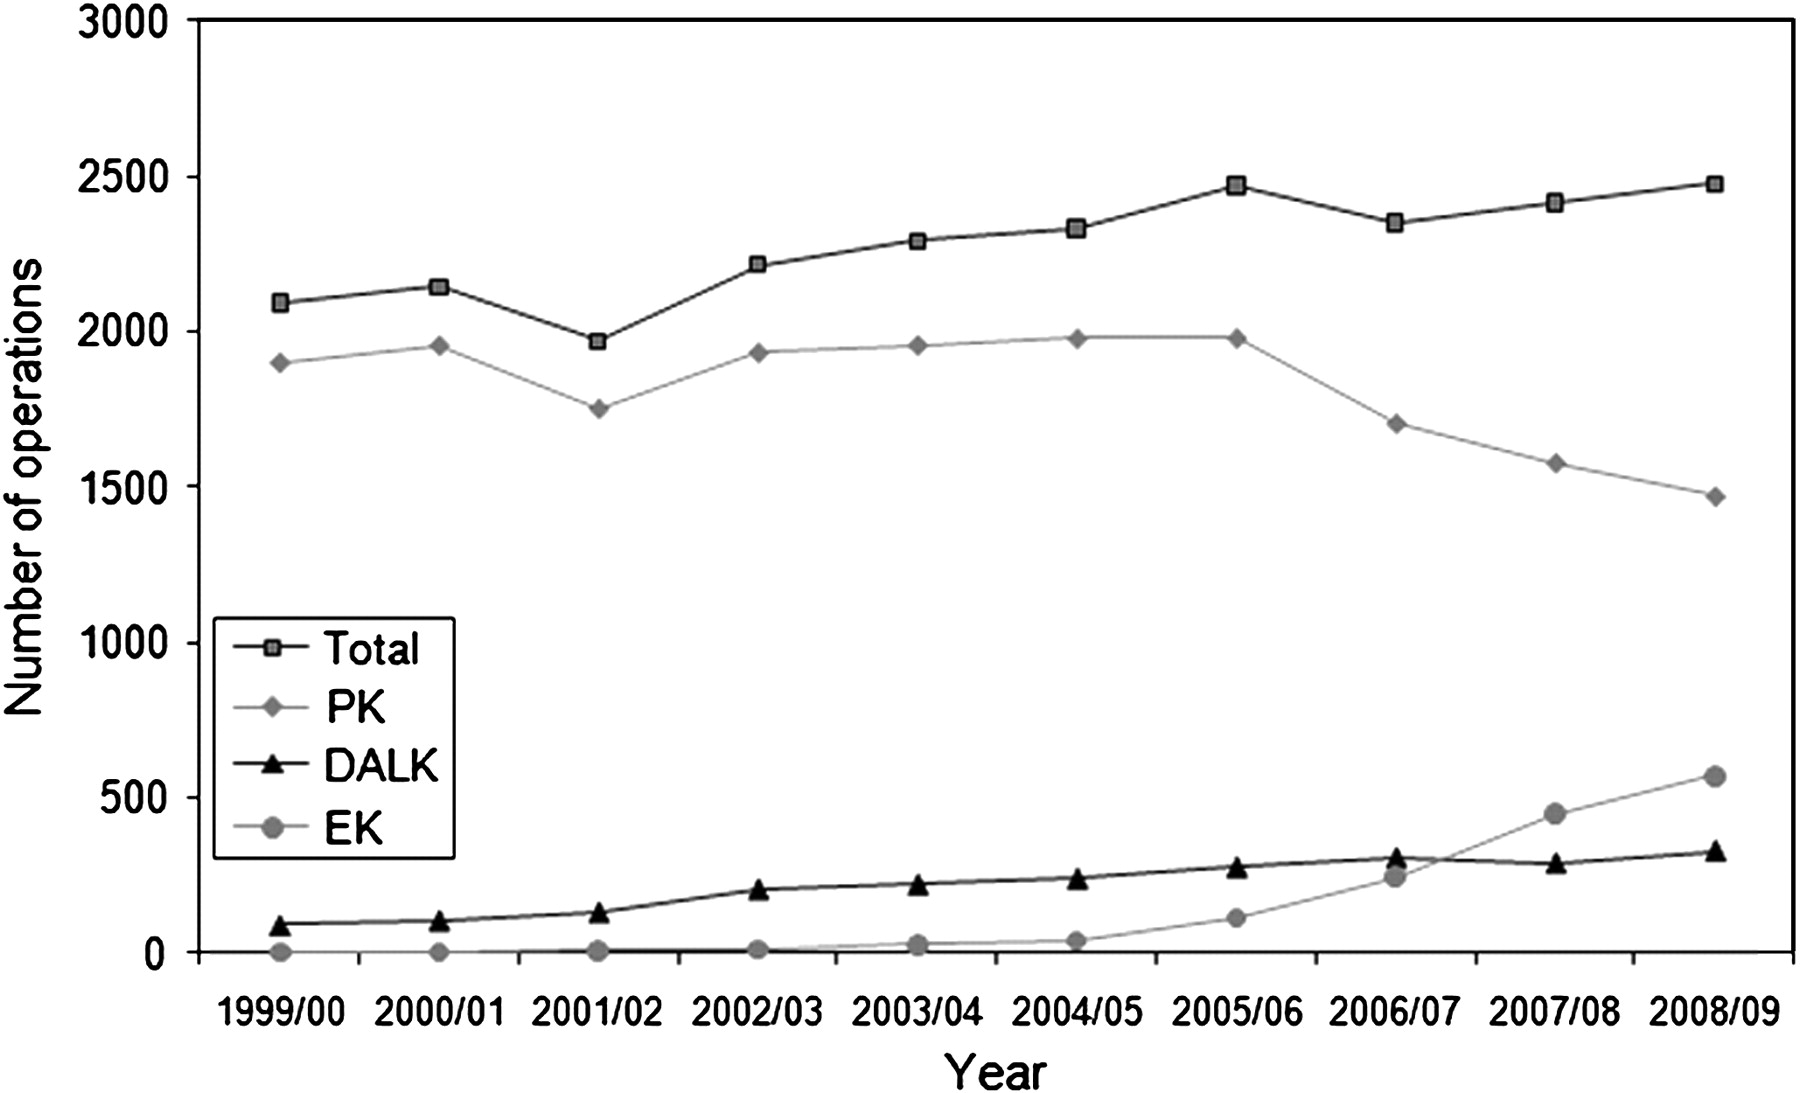
Number of keratoplasty operations under the Corneal Transplant Service in the UK: annual number of operations, including all keratoplasty (total), penetrating keratoplasty (PK), deep anterior lamellar keratoplasty (DALK) and endothelial keratoplasty (EK), 1999/2000–2008/2009.
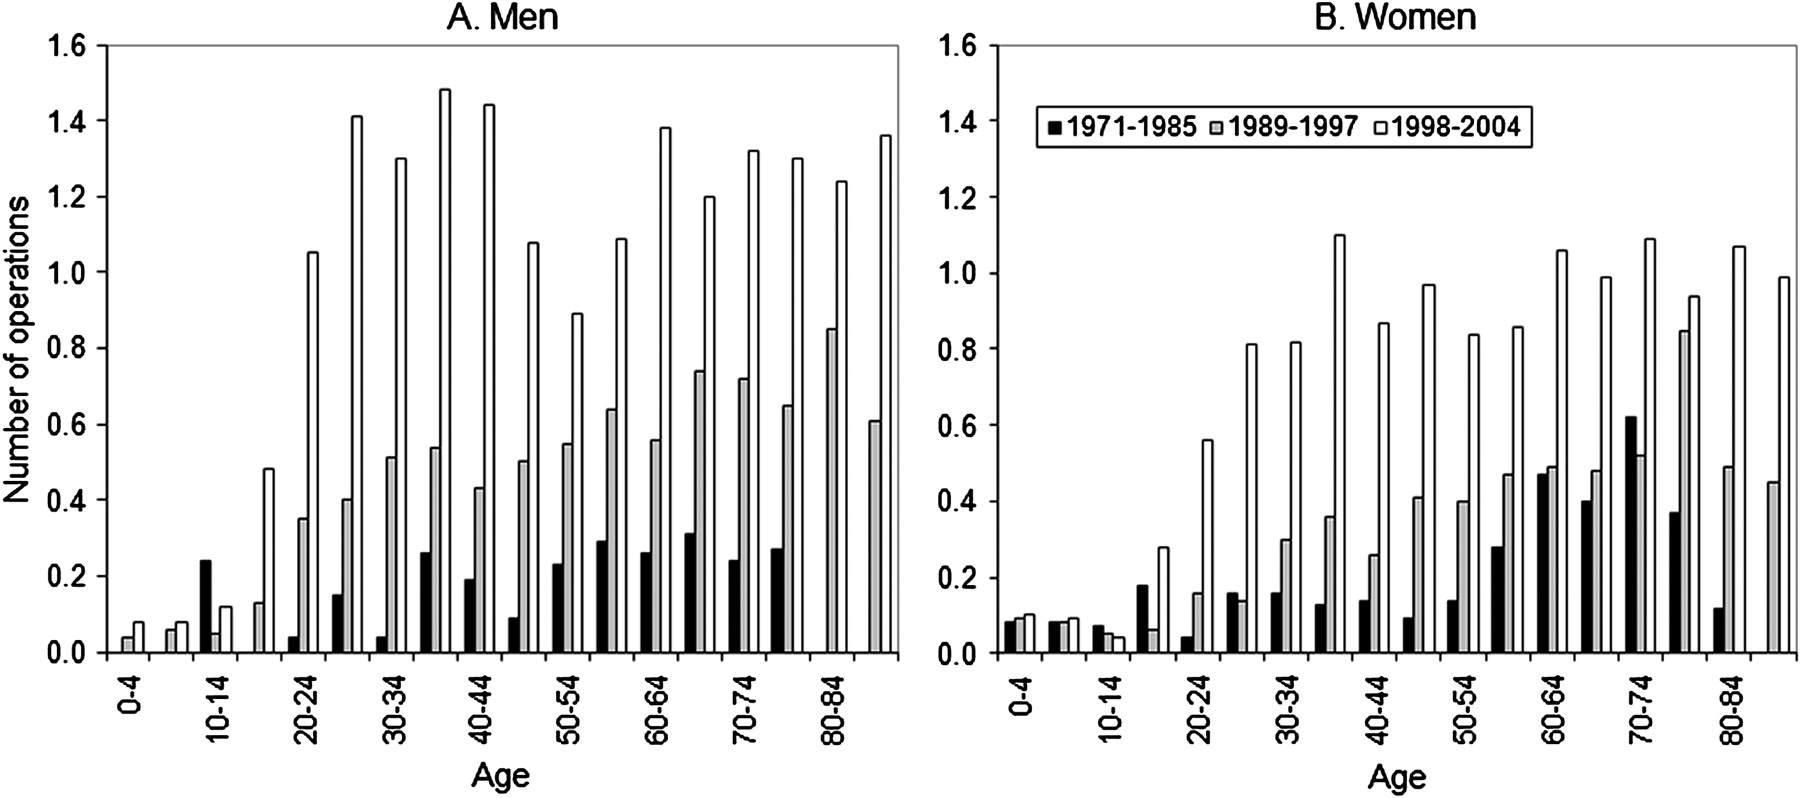
Using HIPE and HES data, admission rates for PK and LK were analysed by age and sex over three time periods, and are presented in figure 4 (PK) and figure 5 (LK). During the first period (1971–1985), the rates of men undergoing PK demonstrated a bimodal distribution; this distribution was less evident in women. Above the 40–44-year group, rates generally increased with age. Rates were higher for men than for women in almost all age groups. During the second period (1989–1997), rates of PK were generally much higher, but particularly in the older age groups. Again, a bimodal distribution was present (particularly for men), and rates were generally higher in men than in women. During the third period (1998–2004), rates of PK were generally fairly similar to rates in 1989–1997. Surgical rates decreased modestly in every age category from 45 to 79 years in men but showed a smaller reduction in most age groups for women.

Age- and sex-specific mean Hospital Episode Statistics annual admission rates for penetrating keratoplasty in England, 1971–2004: (A) male; (B) female.

Age- and sex-specific mean Hospital Episode Statistics annual admission rates for lamellar keratoplasty in England, 1971–2004: (A) male; (B) female.
Admission rates over the same time periods for patients undergoing LK are shown in figure 5. In 1971–1985, rates of men undergoing LK showed one peak in the 35–39-year group, and a second broad peak in the age groups between 50 and 79 years. Rates of women undergoing LK were higher than for men for the age groups between 55 and 84 years. In 1989–1997, rates of LK were higher than in 1971–1985 for most age groups in men but showed much smaller increases in women. In 1998–2004, surgical rates were higher still than in 1989–1997 for almost every age group. In contrast to the distribution for PK, rates increased much less with age.
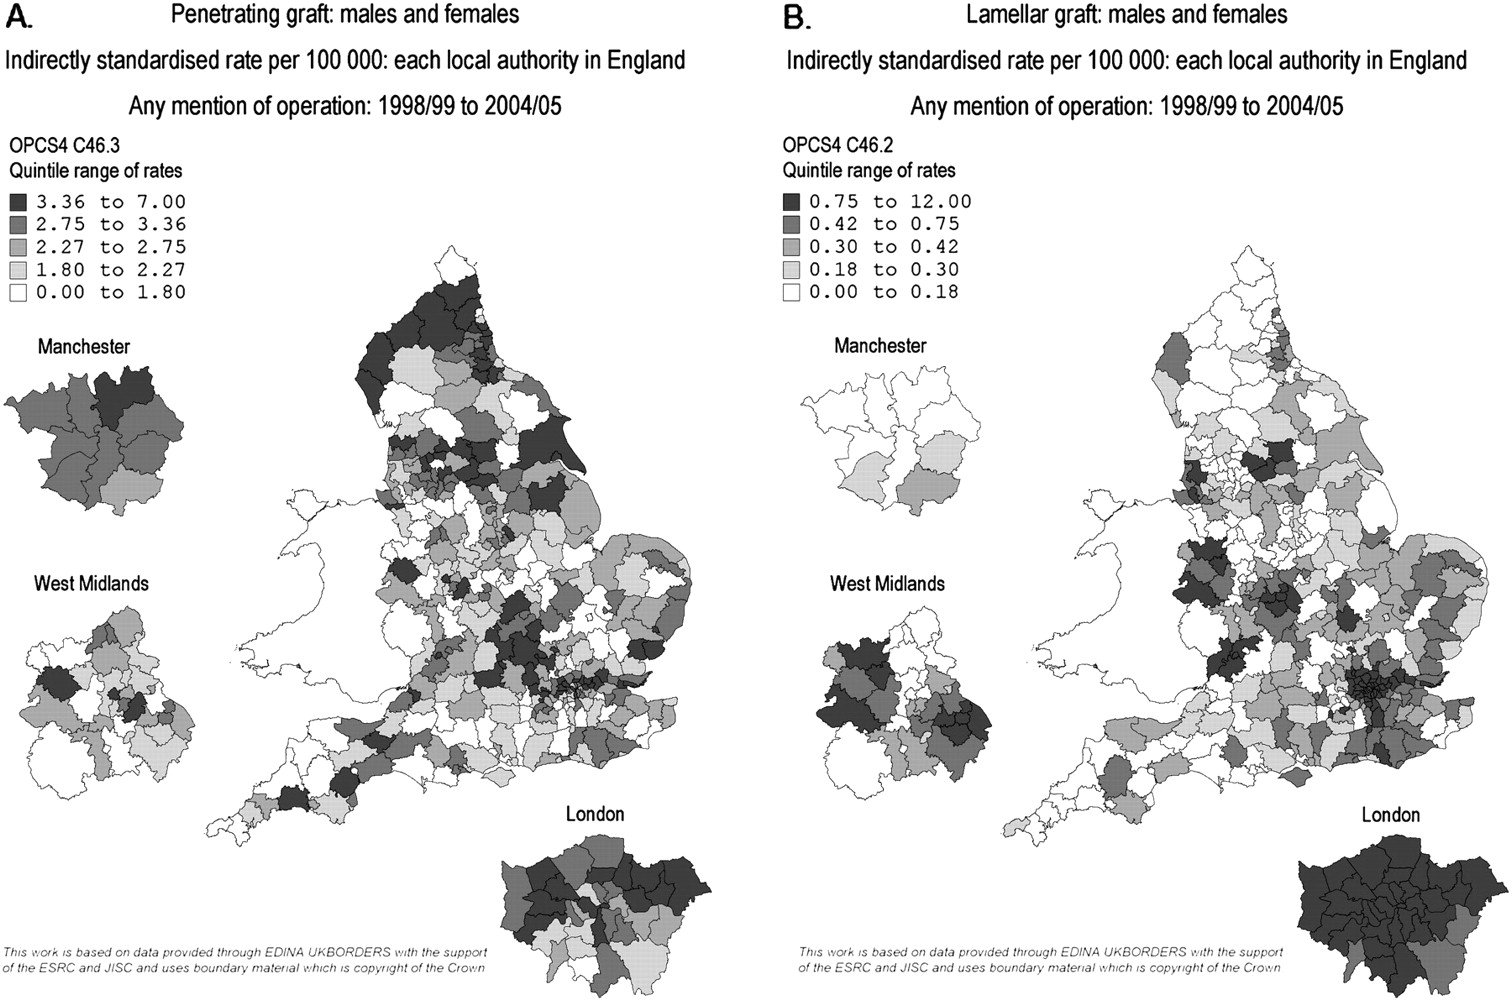
Figure 6A shows a geographical profile of the annual rate of PK by LA, analysed by patients' place of residence, constructed using HES data. LAs showed a wide variation in rates of PK, ranging from 0.6 (0.1 to 1.7) to 6.4 (4.9 to 8.3) people per 100 000 population in 1998–2004. Clusters of LA areas covering populations with high surgical rates are seen around several major conurbations distributed around the UK. Similarly, figure 6B shows a geographical profile of the annual rate of LK by LA of residence. LAs showed a very wide variation in rates of LK, ranging from 0.1 (0.0 to 0.3) to 11.2 (9.5 to 13.1).

Map of mean Hospital Episode Statistics annual admission rates for keratoplasty across England from 1998 to 2004, showing rates by local authority area of residence, with expansions for Manchester, West Midlands and London, with quintiles of rates from highest (darkest shading) to lowest (lightest shading): (A) penetrating keratoplasty; (B) lamellar keratoplasty.
Discussion
The total number of corneal graft operations in England increased dramatically from around 50–60 per year in the early 1980s to around 1400–2000 per year in the early 1990s. This enormous increase in surgical activity was permitted by improvements in the processing, storage and distribution of corneal tissue through the addition of new CTS eye banks in Bristol (1986) and Manchester (1988) to existing eye banks in East Grinstead (1959) and Moorfields (1965), and the coordination of this eye bank network by the (then) UK Transplant Service (UKTS).3
For most of the latter half of the twentieth century, PK was the corneal procedure of choice for visual rehabilitation, with LK relegated to primarily tectonic indications.19 The effectiveness of PK was achieved by the development of newer sutures and microsurgical techniques, as well as an improved understanding of corneal endothelial physiology and the introduction of corticosteroids.19
These data show that national rates of patients undergoing PK in England increased dramatically from the late 1980s to reach a peak in the early 1990s, particularly in older age groups for both men and women. This expansion was permitted by the transformation in the methods of corneal tissue supply in the UK, as described above.3 In addition, this period saw surgical advances and refinements in technique which improved the safety of PK and reduced postoperative complications.20 Shorter hospital stays also meant increased throughput and therefore greater surgical capacity. Demand for PK may also have grown from the increased incidence of pseudophakic bullous keratopathy following the massive expansion in cataract surgery seen in England during the 1980s.9–12
Rates of PK in England declined very slowly from the early 1990s, particularly in older age groups for men. Possible explanations include a decrease in the prevalence of pseudophakic bullous keratopathy caused by improvements in phacoemulsification cataract surgery.8 In addition, advances in contact lens technology may have raised the threshold for surgery in keratoconus, and further therapeutic options have also emerged.13 14 Finally, the increase in LK may partly explain the decrease in PK, as some surgeons have switched from penetrating to lamellar techniques for some patients.4–7 19 20
National rates of patients undergoing LK in England increased dramatically during the late 1990s, to reach a peak in the early 2000s, particularly in younger age groups. NHSBT data demonstrate that DALK was chiefly responsible for this takeoff. Advances in lamellar techniques were permitted by improvements in surgical instrumentation in combination with refinements in technique.4–7 19 20 Proponents of DALK stressed the benefits of a non-penetrating operation, and cited the advantages as follows: prevention of endothelial cell loss leading to graft failure, avoidance of endothelial rejection, reduced requirement for topical steroid treatment, faster visual rehabilitation and improved long-term graft stability.19 20
However, HES data show that rates of patients undergoing LK in England reached a plateau from 2001, and have decreased from 2003. NHSBT data reveal a small decline in the annual number of DALK operations in the UK for the first time from 2006/2007 to 2007/2008, but this trend is reversed in 2008/2009 to a new peak of 327 operations. Corneal surgeons may have temporarily altered their practice following the publication of studies comparing visual outcomes of PK and DALK, where interface opacification was thought to limit the visual outcome in DALK. In 2006, Funnell et al. published their finding that eyes undergoing DALK were significantly less likely to attain Snellen best-corrected visual acuity of 6/6 than those undergoing PK, in patients with keratoconus,21 and this observation has recently been supported by NHSBT data.22 However, DALK in the study by Funnell et al. was performed using Melles' technique,6 21 and proponents of DALK point to better visual outcomes using improved methods including the ‘big bubble’ technique.23 Further studies may help determine relative visual outcomes in PK versus DALK as best practised.
NHSBT data show that the annual number of EK operations in the UK has increased dramatically over the past decade. The advantages of EK have been described as follows: faster visual rehabilitation, reduced astigmatism, less suture-related infection and graft vascularisation, reduced likelihood of rejection and improved globe integrity.24 However, potential disadvantages include endothelial cell loss caused by graft folding, complications such as graft dislocation requiring revision procedures, and limited final visual acuity in some patients through interface opacification. In addition, EK is considered technically more difficult than PK and may require conversion to PK in some cases. However, the National Institute for Health and Clinical Excellence reported in 2009 that current evidence on safety and efficacy was adequate to support the use of EK, based on the combined results of over 6000 operations.25
The distribution of keratoplasty (in 1998 to 2004) demonstrates enormous variation across England, particularly for LK. Some geographical areas (such as London) have relatively high rates of both PK and LK, while other areas have relatively high rates of PK but low rates of LK. This suggests that corneal surgery is practised most in specialist centres distributed across England, some of which perform predominantly PK, while others perform both PK and LK. This has important implications for patient choice, access to surgery and surgical training.
Trends in keratoplasty are unique in ophthalmology, in that they must be considered in the context of a finite supply of corneal tissue for transplantation. The total number of corneal graft operations performed in the UK under NHSBT has tended to increase slowly from 1999 to 2009, while the total number performed in England under HES has remained fairly constant. However, Britain's expanding population means that these trends correspond to a very small increase in NHSBT surgical rates in the UK, and to a small decline in HES surgical rates in England. Given that highest rates of PK are found in the oldest age groups for both men and women, the current demographic shift towards an older population is likely to exert significant pressure on supplies of corneal tissue in the near future.
While every effort should be made to increase the quantity of corneal tissue donated in the UK, it is also very important to maximise the benefit from each potential graft. In this context, lamellar surgery has the advantage of increasing the number of possible keratoplasty operations.26 As confidence with lamellar techniques continues to grow, donated corneas with an endothelial cell count insufficient for PK might be used for DALK, while corneas with stromal scarring might still be suitable for EK. Indeed, careful cooperation between eye banks, surgeons and patients might regularly permit the situation where one donated eye could provide sufficient tissue for two grafts: one anterior lamellar graft and one EK. In the mean time, further studies examining surgical and visual outcomes for PK versus LK, together with graft survival data, should inform the debate on the appropriate balance of penetrating and lamellar approaches appropriate for each corneal condition, patient and surgeon.
Acknowledgments
Geographical atlases of surgical rates were produced using data provided through EDINA UKBORDERS with the support of the Economic and Social Research Council (ESRC) and the Joint Information Systemic Committee (JISC), together with boundary material which is copyright of the Crown.
References
Footnotes
Funding The Unit of Health-Care Epidemiology is funded to undertake research on the regional and national hospital databases by the English NHS National Coordinating Centre for Research Capacity Development. NHS Blood and Transplant is funded as a Special Health Authority whose responsibilities include acquiring information about donors and recipients of organs and tissues available for transplantation, and commissioning and conducting research and development.
Competing interests None.
Ethical approval Ethics approval was provided by NHS Central Office for Research Ethics Committees (reference 04/Q2006/176).
Provenance and peer review Not commissioned; externally peer reviewed.