Article Text

Abstract
Background Vascularisation of the macula takes place between 24 and 27 weeks post-conception. Preterm birth may affect the formation of the foveal avascular zone (FAZ) and foveal depression, and displacement of inner retinal layers away from the incipient fovea.
Objective To examine whether vascular abnormalities accompany an inner retinal abnormality, and whether they are coincident.
Methods High-density spectral domain optical coherence tomography volume scans were obtained from 24 preterm children and 34 full-term controls (5–16 years). Matlab programs were used to quantify total retinal thickness, thickness of individual retinal layers and metrics of foveal morphology. Summed voxel projections for the ganglion cell layer–inner nuclear layer were used to identify the FAZ.
Results Preterm children had significantly smaller FAZ diameters than controls (p<0.0001). The foveal pits of preterm children were significantly shallower and less steep (p<0.0001) and total retinal thickness at the fovea was significantly increased (p<0.0001) compared to controls. The ganglion cell layer–inner plexiform layer and outer nuclear layer were significantly (p≤0.0001) thicker in preterm children than in controls.
Conclusions Preterm birth results in abnormal foveal vascularisation, a failure of the inner retinal neurons to migrate away from the fovea, and an elevated outer nuclear layer ratio. The spatial coincidence of inner retinal and vascular abnormalities in preterm children supports the hypothesis that aspects of foveal development are interdependent.
- Foveal avascular zone
- prematurity
- retina
- SD-OCT
- imaging
- electrophysiology
- colour vision
- visual perception
- vision
- imaging
- diagnostic tests/investigation
- electrophysiology
- child health (paediatrics)
- psychophysics
- visual perception
Statistics from Altmetric.com
- Foveal avascular zone
- prematurity
- retina
- SD-OCT
- imaging
- electrophysiology
- colour vision
- visual perception
- vision
- imaging
- diagnostic tests/investigation
- electrophysiology
- child health (paediatrics)
- psychophysics
- visual perception
Introduction
The retina is one of the last tissues of the developing fetus to undergo vascularisation, beginning 14–16 weeks post-conception.1–3 Vasculogenesis begins in the posterior superficial retina and proceeds in a wave-like manner to the periphery. At 25 weeks post-conception, the deep vascular network grows from the optic disc towards the retinal periphery, skirting around the incipient fovea.4–6 Blood vessels migrate and proliferate across the retina, at a pace consistent with the increasing oxygen demands of developing retinal cells.7 Anti-proliferative and/or anti-angiogenic factors expressed within the foveal region prevent the growth of capillaries into the incipient fovea, resulting in a foveal avascular zone (FAZ).8–10
The foveal pit begins to develop at 24–27 weeks post-conception.11 Creation of the foveal pit involves centrifugal migration of inner retinal neurons away from the fovea and a continuation of the centripetal migration of cone cell nuclei towards the foveal center.12 The absence of blood vessels at the fovea has been suggested to be involved in the formation of the foveal pit.13 ,14
Taken together, these data suggest that 24–27 weeks post-conception is a critical period for development of the fovea, including development of the perifoveal vascular plexus and formation of the foveal pit. Foveal cone packing, which begins earlier than foveal pit formation, proceeds throughout this critical period and thereafter.15 Preterm birth and the accompanying change in retinal pO2 may suspend the development of the perifoveal vascular plexus and alter the expression of factors that guide the vessels around the FAZ. Therefore, preterm birth may disrupt the developmental interactions between the formation of the perifoveal vascular plexus around the FAZ, the initial formation of the foveal depression, the displacement of inner retinal layers away from the incipient fovea, and foveal cone packing. Any of these abnormalities, alone or in combination, may affect visual acuity.
Early optical coherence tomography (OCT) studies in preterm children and adults with regressed retinopathy of prematurity (ROP) reported blunted or absent foveal depressions and increased retinal thickness at the fovea.16–20 Studies that utilised high resolution spectral domain OCT (SD-OCT) in small cohorts of preterm children and adults with regressed ROP described a wide, shallow foveal pit, small or absent FAZ, thick outer nuclear layer (ONL), and inner retinal layers overlaying the fovea.21–24 Here we used novel computer-assisted analysis techniques to non-invasively assess FAZ diameter and the architecture of the fovea in preterm children, and examined whether foveal vascular abnormalities accompany the inner retinal abnormalities, and for the first time, whether they are spatially coincident.
Methods
This study was approved by the Institutional Review Board of the University of Texas Southwestern Medical Center (Dallas, Texas, USA). Informed consent was obtained from a parent and assent was obtained from children ≥12 years of age.
Subjects
Two groups of children aged 5–16 years participated: 24 preterm children (mean age 10.1±3.0 years) born at 23–27 weeks post-conception, and 34 full-term controls (mean age 9.2±2.8 years), born at 38–41 weeks post-conception. Preterm children had a history of no ROP (n=4) or regressed ROP, with stage 1 to stage 3 acute phase and either spontaneous regression (n=5) or regression following treatment with peripheral ablative surgery (n=15). All had normal-appearing posterior poles on ophthalmoscopy. For both groups, children with coexisting ocular or systemic disease or developmental delay were excluded.
Demographics, gestational age at birth, birth weight, acute and cicatricial stages of ROP, and treatment for ROP were obtained from medical records (table 1).
Demographic and clinical description of the preterm and full-term groups
Visual acuity
Visual acuity was assessed using E-ETDRS, a method that has become the standard for clinical trials in paediatric ophthalmology.25
SD-OCT imaging
Images were acquired by Spectralis SD-OCT (Heidelberg Engineering, Vista, California, USA), using the automatic real time (ART) eye tracker to eliminate motion artefacts. For each patient, a high resolution horizontal line scan (9 mm; average ART=82) and high speed, high density volume scans (4.4×1.5 mm or 6.9×1.7 mm, comprised of 49 B-scans; average ART=9) were obtained from the foveal region. Images from right eyes were used in this study, except for four patients in the preterm group who were amblyopic in the right eye. In these four cases, the left eye was imaged and analysed so that amblyopia did not confound the correlation between visual acuity and foveal characteristics.
Foveal pit metrics (depth, diameter, slope)
The 9 mm horizontal line scan was used to determine foveal pit metrics with a customised Matlab program.26 A difference-of-Gaussians (DoG) model is fit to the retinal thickness profile to allow measurement of the foveal pit contour and objective determination of foveal pit metrics (diameter, depth and slope). The centre of the foveal pit is a location where the DoG slope is zero. The rim of the foveal pit is also a location of zero slope. The diameter of the foveal pit was defined as the rim-to-rim distance in millimetres. The depth of the foveal pit was defined as the difference between the retinal thickness at the rim and at the pit centre in microns. The slope of the foveal pit was calculated as the maximum value of the slope between the foveal centre and the foveal rim in degrees.
Retinal segmentation
The 9 mm horizontal line scan was also used to segment the retina into individual layers using a custom Matlab program, provided by Dr Donald Hood (Columbia University).27 Nine retinal layer borders were identified: vitreous–retinal nerve fibre layer (RNFL), RNFL–ganglion cell layer (GCL), GCL–inner plexiform layer (IPL), IPL–inner nuclear layer (INL), INL–outer plexiform layer (OPL), OPL–ONL, ONL–photoreceptor inner segments (IS), IS–photoreceptor outer segments (OS), and OS–retinal pigment epithelium (RPE; figure 1). The centre of the fovea was located by examining the continuity of the external limiting membrane, increased distance between connecting cilia and RPE layers, and increased ONL thickness.21 Measurements were made at the fovea and at 3 parafoveal eccentricities (400, 800 and 2000 μm). The ONL ratio was used as an index of foveal cone photoreceptor density. The ONL ratio was defined as the thickness of the ONL at the fovea/thickness of the ONL at ±2000 μm from the foveal centre.24

Representative images of the optical coherence tomography (OCT) segmentation program. (A) Segmented OCT image from a preterm child, born at 26.9 weeks post-conception (logMAR: 0.301). (B) Segmented OCT image from a full-term control child (logMAR: −0.0969). From top to bottom, the coloured lines mark the following boundaries: vitreous–RNFL (red), RNFL–GCL (orange), GCL–IPL (yellow), IPL–INL (light green), INL–OPL (bright green), OPL–ONL (teal), ONL–IS (light blue), IS–OS (blue), OS–RPE (purple), RPE–choroid (fuchsia). RNFL, retinal nerve fibre layer; GCL, ganglion cell layer; IPL, inner plexiform layer; INL, inner nuclear layer; OPL, outer plexiform layer; ONL, outer nuclear layer; IS, photoreceptor inner segments; OS, photoreceptor outer segments; RPE, retinal pigment epithelium.
FAZ measurements
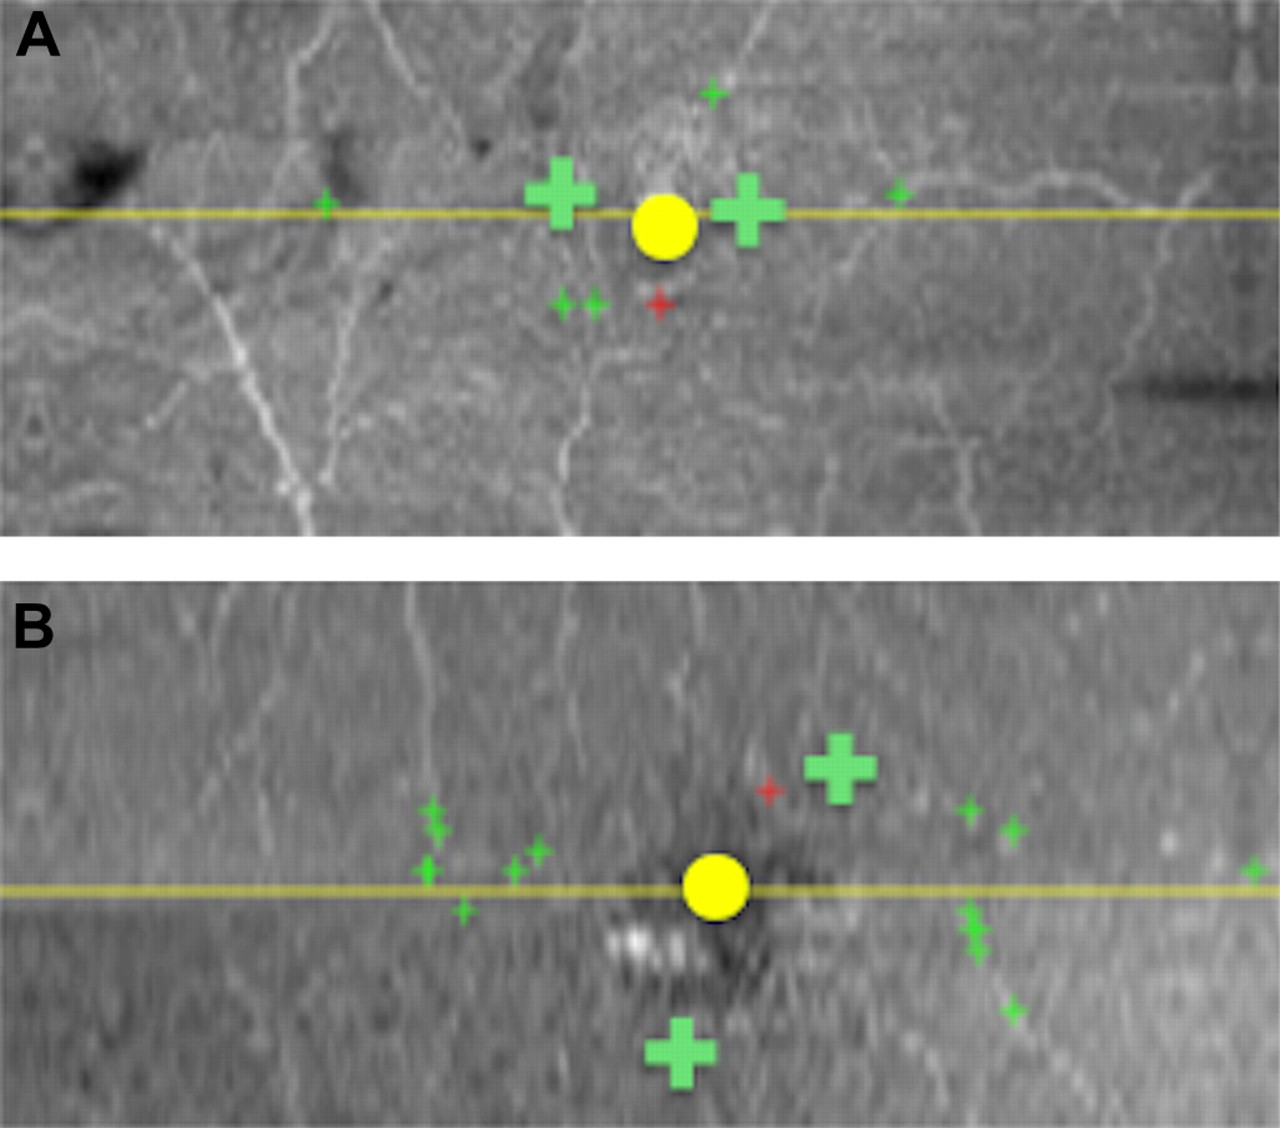
High density volume scans from each patient were analysed by masked examiners (MC and SF) using a customised version of the DOCTRAP software.28 The B-scan that showed the maximum convergence of inner retinal layers and ONL thickening along with elevation of the IS-OS junction was used to locate and mark the fovea. ONL thickening was present in preterm children even when there was no measureable foveal pit. The retinal vasculature was assessed at the level of the IPL and OPL. Within these layers, all voxels (volumetric equivalent of a pixel) were averaged to derive a summed voxel projection (SVP), creating two-dimensional en face images. Utilising a customised graphical user interface implemented in Matlab, we defined and detected vessels based on the following rule: a hyper-reflective spot on a B-scan was confirmed to be a vessel intersection if it also corresponded to both: (1) a location on a hyper-reflective vessel structure on the IPL-OPL SVPs; and (2) a location on a hypo-reflective vessel structure on the RPE–Bruchs membrane SVP. The distance from the fovea to the nearest blood vessel was calculated and doubled as an estimate of FAZ diameter (figure 2). Note that the resolution of the SD-OCT was sufficient to identify vessels with diameters ≥25 μm.

Representative images for analysis of foveal avascular zone diameter. Summed voxel projections (SVPs; ie, constructed en face images) for the inner retinal layer combination that contains the perifoveal blood vessels (IPL–OPL). (A) Results from a preterm child, born at 26.9 weeks post-conception (logMAR: 0.301). (B) Results from a full-term control child (logMAR: −0.0969). The yellow line is the position of the foveal B-scan; the yellow circle marks the location of the fovea; the green crosses mark the location of two blood vessels closest to the fovea.
In order to evaluate the reproducibility of this novel method of determining FAZ diameter, we had an independent masked grader (JW) perform the same analyses. Although there is some inherent subjectivity with this methodology, statistical results and p values were the same, regardless of which masked grader's diameters were used for analyses.
Statistical analysis
Student t tests and linear correlation tests were performed on data that were normally distributed with equal variance (IGOR Pro software; WaveMetrics, Portland, Oregon, USA).
Results
Effect of preterm birth on foveal pit metrics and FAZ diameter
Despite similar foveal pit diameters, preterm children had significantly smaller FAZ diameters than full-term controls (table 2). The FAZ extended only one quarter of the distance from the foveal centre to the foveal rim in preterm children, but extended twice as far in full-term controls. Preterm children had significantly shallower foveal pits than full-term controls. The foveal pits of preterm children were also less steep. To assess whether the DoG model of foveal shape provided a good fit for the data from both the preterm cohort and the full-term controls, we determined the root mean square value for each foveal fit. There was no statistically significant difference between the root mean square values of the preterm versus full-term DoG fits (p>0.2). The preterm cohort included children with no ROP (n=4), mild ROP that regressed spontaneously (n=5), and ROP that regressed post-laser treatment (n=15). Table 2 presents FAZ diameter and foveal metrics for each of these subgroups. Although the number of children in each subgroup was small, the same pattern of results was present for each subgroup; that is, compared to full-term children, there was no significant difference in foveal diameter, but FAZ diameter, foveal depth, foveal slope and total foveal thickness were significantly different (0.0001≤p≤0.04, except for foveal slope of the no ROP group which showed a trend (p=0.08).
Foveal metrics and foveal thickness in preterm children and full-term controls
Effect of preterm birth on total foveal thickness
Thickness of the retina at the fovea was significantly greater in preterm children than in full-term controls (table 2). Total foveal thickness was inversely correlated with the diameter of the FAZ (r2=0.51; p≤0.0001; figure 3).

Effect of preterm birth on total foveal thickness. Total foveal thickness was inversely correlated with the distance of the nearest blood vessel to the foveal centre (FAZ; r2=0.51; p≤0.0001). FAZ, foveal avascular zone.
Effect of preterm birth on the thickness of the GCL–IPL layers of the retina
The GCL–IPL was significantly thicker in preterm children than in full-term controls in the central fovea, and at approximately half-way up the foveal slope at 400 μm, but not at the foveal rim (800 μm) or outside of the fovea at 2000 μm (table 3). Similar results were found at 0 μm and 400 μm for the mild, regressed ROP and regressed post-laser treatment ROP subgroups (0.001≤p≤0.05). Due to the small sample size, GCL–IPL thickness was not significantly greater in the no ROP subgroup, despite a factor of two difference in thickness compared to the full-term group. GCL–IPL thickness at the fovea was inversely correlated with the diameter of the FAZ (r2=0.19; p≤0.001; figure 4).
GCL–IPL layer thickness and photoreceptor layer thickness in preterm children and full-term controls

Effect of preterm birth on the thickness of the GCL–IPL layers of the retina. GCL–IPL thickness at the fovea was inversely correlated with the distance of the nearest blood vessel to the foveal centre (FAZ; r2=0.19; p≤0.001). FAZ, foveal avascular zone; GCL, ganglion cell layer; IPL, inner plexiform layer.
Effect of preterm birth on the ONL and photoreceptor layer
The ONL ratio was significantly higher in preterm children than in full-term controls (table 2). However, there were no differences between preterm and full-term controls, or any preterm subgroups, in the thickness of the photoreceptor IS, photoreceptor OS, or the combined (IS–OS) photoreceptor layer at the fovea or beyond (up to ±2000 μm; table 3).
Visual acuity and abnormal foveal architecture
Preterm children had significantly reduced visual acuity compared to full-term controls (0.212±0.05 vs −0.008±0.4 logMAR; p<0.0001). Visual acuity in preterm children was not correlated with GCL–IPL thickness, ONL thickness, ONL ratio, IS–OS layer thickness, FAZ diameter, foveal pit depth, foveal pit diameter or foveal pit slope (p>0.16 for all correlations).
Discussion
To our knowledge, this study is the first to use novel, computer-assisted analyses to non-invasively assess FAZ diameter and the architecture of the fovea in preterm children. Furthermore, this study is the first to demonstrate a correlation between foveal vascular abnormalities and foveal fine structure as a result of preterm birth. Preterm birth at 23–27 weeks post-conception was associated with a significantly smaller FAZ and a shallower, less steep foveal pit compared to full-term controls. Foveal thickness was greater in preterm children than in full-term controls, primarily due to GCL–IPL layers overlying the fovea. Furthermore, preterm children demonstrated higher ONL ratios, suggestive of increased cone packing at the fovea.
Our findings differ from the absent FAZ reported in an adult with regressed ROP.21 Our finding of a smaller than normal FAZ in preterm children, rather than an absent FAZ, may be the result of individual differences that we were able to appreciate with a larger sample size. In addition, the differences between the two studies may be related to the resolution of our method, which was able to identify vessels with diameters ≥25 μm, and may have overestimated the size of the FAZ in both the preterm and full-term control groups because very small vessels were not identified. Nonetheless, both preterm studies exhibit the same trend: a small or absent FAZ following preterm birth ≤27 weeks post-conception. In addition, FAZ diameter in our full-term cohort exhibited a threefold variation in FAZ diameter that fell within the fivefold range seen in a recent adaptive optics study of ‘normal adults’.29
Our full-term cohort exhibited foveal pit metrics (depth, diameter and slope) comparable to normal adults.29 The foveas of preterm children were significantly shallower and less steep than those of controls. These findings complement the literature; studies have consistently demonstrated an absent or shallow foveal pit in preterm children and adults.17–19 21–24 Unlike the Hammer et al study,21 we did not detect a difference in the foveal pit diameters of preterm children and full-term controls.
The foveas of preterm children were significantly thicker than those of full-term children. These findings are consistent with the literature.19 ,21–24 However, ours is the first study to demonstrate a significant negative correlation between foveal thickness and FAZ diameter. Building on previous findings in our laboratory,24 we showed that the GCL–IPL layers were about 6 times thicker in preterm children than full-term controls, both at the fovea, as well as at ±400 μm from the foveal centre (approximately halfway up the foveal slope). This finding highlights the spatial coincidence of inner retinal and foveal vascular abnormalities in preterm children, because the eccentricities with GCL–IPL differences between the two groups are the same eccentricities that exhibit differences in vascularisation.
The FAZ abnormality was inversely correlated with the increased thickness of the GCL–IPL layers of the retina (at the fovea) in preterm children. The displacement of inner retinal neurons during foveal development may be due to intraocular pressure and mechanical stress,13 ,30 ,31 or failure of the choroid to meet the metabolic demands of photoreceptors and inner retinal neurons at the fovea,32 or due to an unidentified factor(s) secreted by Müller cells, which might affect the orientation scaffold that the Müller cells provide for young, post-mitotic neurons during development.33 The spatial coincidence of inner retinal and vascular abnormalities in the foveas of preterm children cannot distinguish between these models. Moreover, a smaller FAZ will limit centrifugal displacement of GCL and INL cells, simply because the presence of capillaries will mechanically interfere with their displacement. Whether a larger FAZ leads to enhanced foveal excavation, or whether enhanced foveal excavation leads to a larger FAZ cannot be determined from our data. However, due to the timing of these two events, it is more likely that the size of the FAZ modifies foveal excavation.8–14
We did not detect any differences in ONL thickness or IS–OS length. However, we found a larger ONL ratio in preterm children than in full-term controls. The higher ONL ratio in preterm children may reflect delayed foveal maturation,33 higher than normal cone packing or an increased contribution of Henle fibres to the ONL ratio in preterm children.34 ,35 These questions cannot be answered without the use of adaptive optics.
The reduced visual acuity of preterm children was not correlated with FAZ diameter, foveal pit depth, foveal pit diameter or foveal slope. Other groups have failed to detect an association between visual acuity and foveal architecture in preterm children.20 ,21 ,24 ,36 Two recent studies in adults have demonstrated that a foveal pit is not required for good visual acuity and that foveal cone specialisation is present in the absence of a foveal pit.37 ,38 Factors unrelated to foveal development and architecture may underlie the visual acuity deficits in preterm children, including delayed and/or altered photoreceptor maturation39 (Corkin FJ, et al IOVS 2011;52:ARVO E-Abstract 3130),40 and subtle differences in the RNFL.41 This suggests that alterations in neural retinal development may underlie the subtle macular dysfunction in these patients.
In conclusion, preterm birth results in abnormal foveal vascularisation, a failure of inner retinal neurons to migrate away from the fovea, and an elevated ONL ratio. The spatial coincidence of inner retinal and vascular abnormalities in preterm children supports the hypothesis that aspects of foveal development are interdependent.
Acknowledgments
The authors would like to thank Dr Donald Hood of Columbia University for generously providing the retinal segmentation program used in this study, and Margot Lazow of Columbia University for assistance with retinal segmentation. They would also like to thank Dr Yuquan Wen of the Retina Foundation of the Southwest for assistance with statistics.
References
Footnotes
Funding Supported by a Fight For Sight Postdoctoral Fellowship, Gerber Foundation, One Sight Foundation, and Once Upon a Time Foundation.
Competing interests None.
Ethics approval This study was approved by the Institutional Review Board of the University of Texas Southwestern Medical Center (Dallas, TX).
Provenance and peer review Not commissioned; externally peer reviewed.