Article Text

Abstract
Aims The recent emergence of antivascular endothelial growth factor (anti-VEGF) drugs has led to increased numbers of patients undergoing intravitreal injection for age-related macular degeneration (AMD). The aims of this study were to report on trends over time and geographical variation in intravitreal injection rates in England, and consider the implications for publicly funded health services of introducing new and expensive treatments.
Methods Hospital episode statistics were analysed for annual treatment rates of intravitreal injection between the NHS financial years of 1989/1990 and 2008/1999.
Results Annual injection rates increased from 0.4 episodes (95% CI 0.37 to 0.49) per 100 000 population in 1989/1990 to 10.7 (10.4–11.0) in 2006/2007. Rates then rose exponentially to 59.5 (58.8–60.2) in 2008/2009, with increasing use of multiple injections per person. The largest growth in injection rates was found in older people, and for AMD. Numbers of treatment episodes increased from 203 (1989/1990) to 30 458 (2008/2009). Geographical analysis showed a very wide variation across local authority areas in injection rates, from 0.9 (0.2–2.2) to 42.2 (38.9–45.7) people per 100 000 population in 2005–2008.
Conclusion Rates of intravitreal injection increased exponentially from 2006/2007. This followed the US Food and Drug Association licensing of ranibizumab for the treatment of neovascular AMD (2006), and its recommendation by National Institute for Health and Clinical Excellence (2008). This study demonstrates some of the major issues which arise with the emergence of expensive new treatments, including speed and cost of adoption, geographical variation in access, and implications for licensing, commissioning and health financing in an ageing society.
- Drugs
- epidemiology
- macula
- public health
- vitreous
- angiogenesis
- eye (tissue) banking
- pathology
- genetics
Statistics from Altmetric.com
Introduction
Age-related macular degeneration (AMD) is the commonest cause of blindness and visual impairment in developed countries.1 The number of people with AMD in the UK is predicted to increase from 608 000 (2010) to 756 000 (2020),2 and in the USA from 10 million (2010) to over 20 million (2050).3 AMD is a slowly progressive disease with onset after age 50 years: in the early stages, visual symptoms may be minimal or absent, but in advanced cases, AMD leads to severely reduced visual acuity. This in turn leads to reduced quality of life and independence, with large associated costs to society.4–7 Advanced AMD has atrophic and neovascular forms; while neovascular AMD comprises only around 10% of the disease, it is responsible for over 90% of severe visual loss.8–10 The number of people with neovascular AMD in the UK is predicted to increase from 415 000 (2010) to 516 000 (2020),2 and in the USA from 1 million (2010) to over 2 million (2050).3
The recent availability of antivascular endothelial growth factor (anti-VEGF) therapy for neovascular AMD has resulted in the treatment of many patients by intravitreal injection in the past 5 years. Ranibizumab (Lucentis, Genentech, South San Francisco, California, USA/Novartis Pharmaceuticals, Basel, Switzerland) was licensed by the Food and Drug Association (FDA) for the treatment of neovascular AMD in the USA in 2006, and in the European Union (EU) in 2007, and was recommended as a treatment for neovascular AMD by the National Institute for Health and Clinical Excellence (NICE) in August 2008.11 Its unit cost is $1950 (0.5 mg phial), and the prescribing information recommends monthly injections, with treatment likely to be required indefinitely.12 13 Bevacizumab (Avastin, Genentech/Roche) is a related anti-VEGF drug which is licensed by the FDA for treatment of metastatic colorectal cancer. It has been used widely for AMD14 and is relatively cheap, with a unit cost at around $50.12 13 However, it remains unlicensed for this purpose and is therefore not currently recommended by the Royal College of Ophthalmologists (RCO) for the treatment of neovascular AMD or any other ocular use.15 16
The use of anti-VEGF therapy is exerting substantial service pressures and costs on the NHS and its ophthalmology departments.17 18 Recent estimates for the number of patients per year with neovascular AMD eligible for anti-VEGF therapy in the UK have already increased from 21 000 to 26 000.11 17 19 In addition, anti-VEGF therapy is increasingly being used against diabetic retinopathy and retinal vein occlusion.15 20 Our aims were to analyse national trends in the use of intravitreal injection in England; to report on geographical variation in the introduction of this treatment; and to consider the implications for the NHS.
Methods
Annual rates of intravitreal injection in England were calculated from Hospital Episode Statistics (HES) for the years 1989/1990–2008/2009, using methods described previously.21 The years are NHS financial years (1 April–31 March the following year), and we refer to them by the start year (eg, 2008/2009 as 2008). HES covers all day-case and inpatient admissions in NHS hospitals in England as well as those funded by the NHS for treatment elsewhere, including external providers such as Independent Sector Treatment Centres. In order to analyse separately the number of injections versus the number of people, rates from 1998 to 2008 were calculated distinguishing episodes of care and individuals treated by means of record linkage. For the count of people, individuals who underwent intravitreal injection were counted only once in each year, irrespective of the numbers of episodes of care in which an intravitreal injection was undertaken. In the analysis of trends over time, English national population denominators for each calendar year were obtained from the Office for National Statistics. Age standardisation was performed as previously described.22
Diagnosis-specific rates of patients undergoing intravitreal injection were also calculated from HES for the years 1989 to 2008, for (1) AMD and (2) diabetes mellitus (DM), by selecting only those episodes of intravitreal injection with the appropriate diagnosis on the same episode.
English national HES were analysed to produce a geographical profile of hospital admission for intravitreal injection by local authority (LA) between 2005 and 2008. The data were also used to construct a map showing the person-based admission rate per 100 000 resident population for each LA, expressed as an average annual rate, as described previously.21 Age standardisation was performed as previously described.22
The admission rate for each LA was plotted against its score for the index of multiple deprivation (IMD 2004).23 The IMD is a measure of socio-economic deprivation, which we used at the level of the LA area.21
The operative procedure code used to identify patients undergoing intravitreal injection from the datasets was C79.4 in the Office of Population, Censuses and Surveys Classification of Surgical Operations and Procedures, 4th revision (OPCS4). The diagnostic codes used to identify patients with AMD from the datasets were 362.5 in the International Classification of Diseases, 9th revision (ICD-9), and H35.3 in ICD-10, while those used to identify patients with DM from the datasets were 250 in ICD-9 and E10–E14 in ICD-10.
Results
English national rates of intravitreal injection are shown in figure 1. Annual rates increased from 0.4 (95% CIs 0.37 to 0.49) episodes per 100 000 population in 1989 to 4.6 (4.4–4.8) in 2002, then more sharply to 10.7 (10.4–11.0) in 2006. The rate of intravitreal injection then more than doubled to 24.4 (24.0–24.9) in 2007 and doubled again to 59.5 (58.8–60.2) in 2008. As expected, the number of episodes of injection was larger than the number of individual people undergoing intravitreal injection each year. The scale of multiple admissions per person per year was small from 1998 to 2004. At this point, rates for episodes and people began to diverge, and this phenomenon of multiple injections per person per year increased dramatically from 2006 to 2008. Numbers of episodes increased from 203 per year in 1989, to 5284 in 2006, 12 391 in 2007 and 30 458 in 2008.

Hospital treatment rates for intravitreal injection in England: annual rates per 100 000 population with 95% CIs, 1989/1990 to 2008/1999.
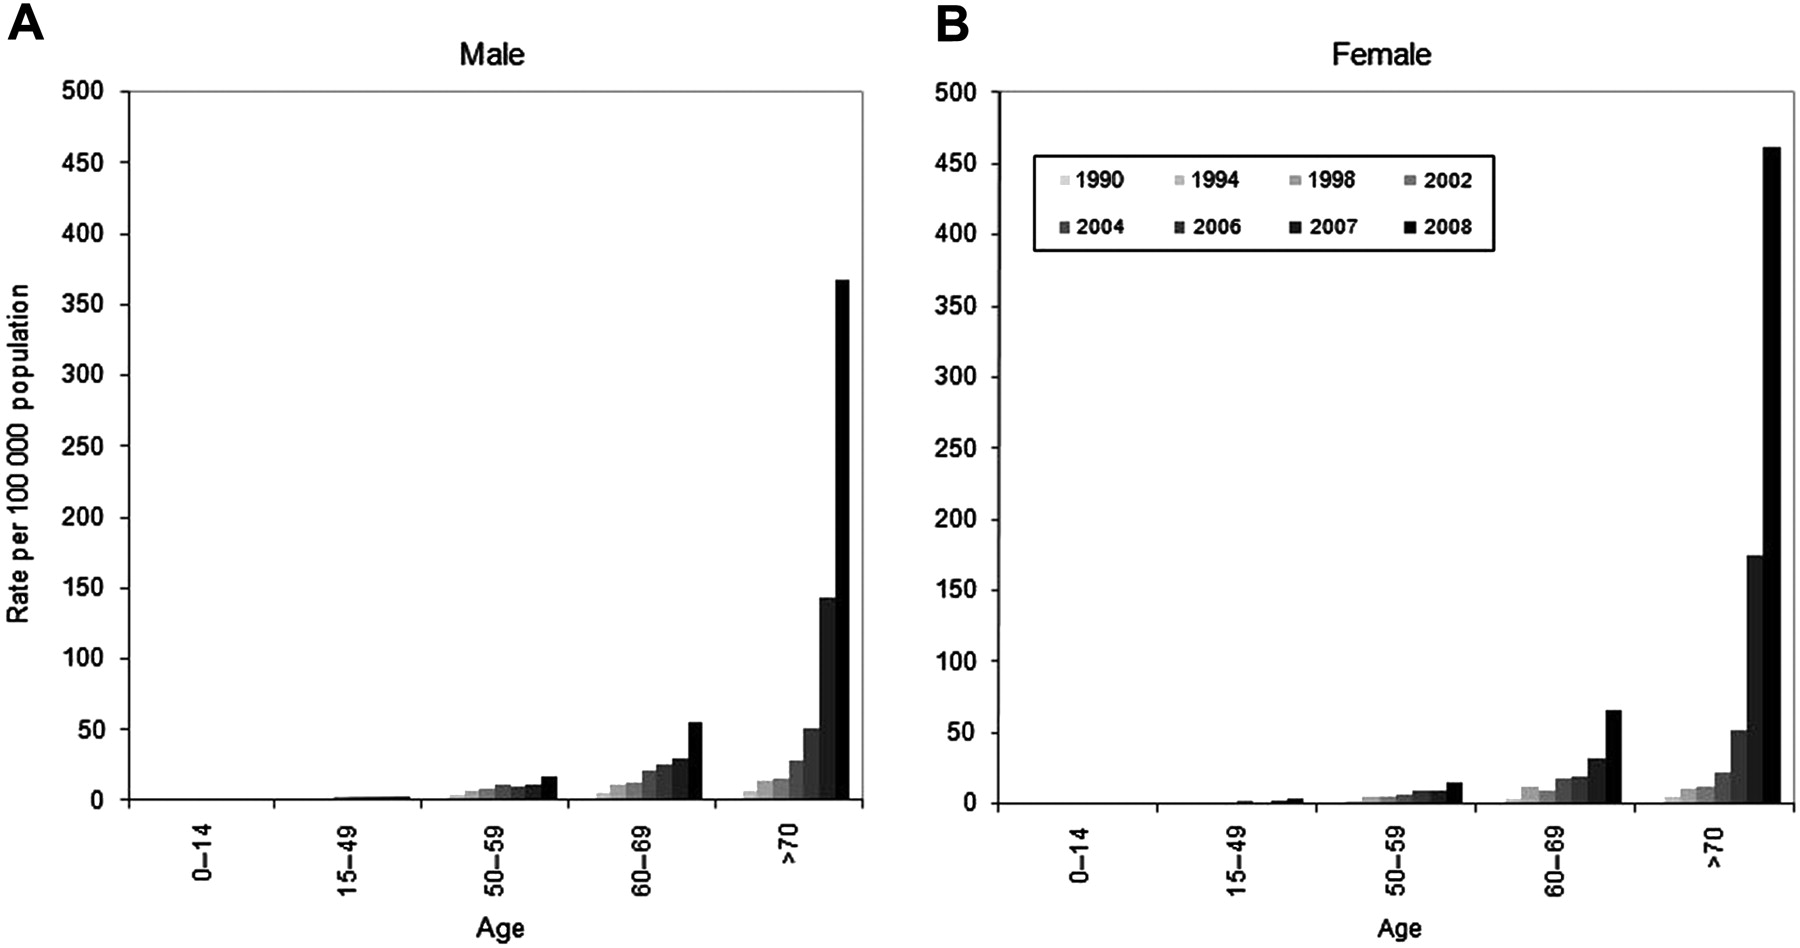
National HES rates of intravitreal injection were analysed by age and sex from 1989 to 2008 (figure 2). In earlier years, rates were generally highest in the 60–69 and 70 and older age groups. However, from 2002, rates have been consistently highest in the 70 and older age group, and from 2006, rates have been higher in this age group for women than for men. Indeed, annual rates have increased most dramatically in women aged 70 years and above: from 52.1 (2006) to 174.3 (2007) to 461.6 (2008) per 100 000 population.

Age- and sex-specific annual hospital treatment rates for intravitreal injection in England per 100 000 population, 1990/1991–2008/1999: (A) male; (B) female.
National HES rates of intravitreal injection were analysed according to diagnosis from 1989 to 2008 (figure 3). The rates of injection episodes and of individual people undergoing injection were much greater for AMD than for DM. For injections associated with AMD, the rate of episodes increased dramatically from 3.7 (3.6–3.9) in 2006, to 15.6 (15.2–15.9) in 2007, to 45.9 (45.3–46.5) in 2008. Divergence between rates of episodes and people also began in 2006 and increased over the following 2 years: annual rates per 100 000 population in 2008 were 45.9 episodes for 17.2 people, suggesting that in 2008 each individual undergoing intravitreal injections for AMD received a mean of 2.7 injections (to one or both eyes).

Diagnosis-specific hospital treatment rates for intravitreal injection in England: annual rates per 100 000 population, with 95% CIs, for age-related macular degeneration (AMD) and diabetes mellitus (DM), 1989/1990 to 2008/1999.
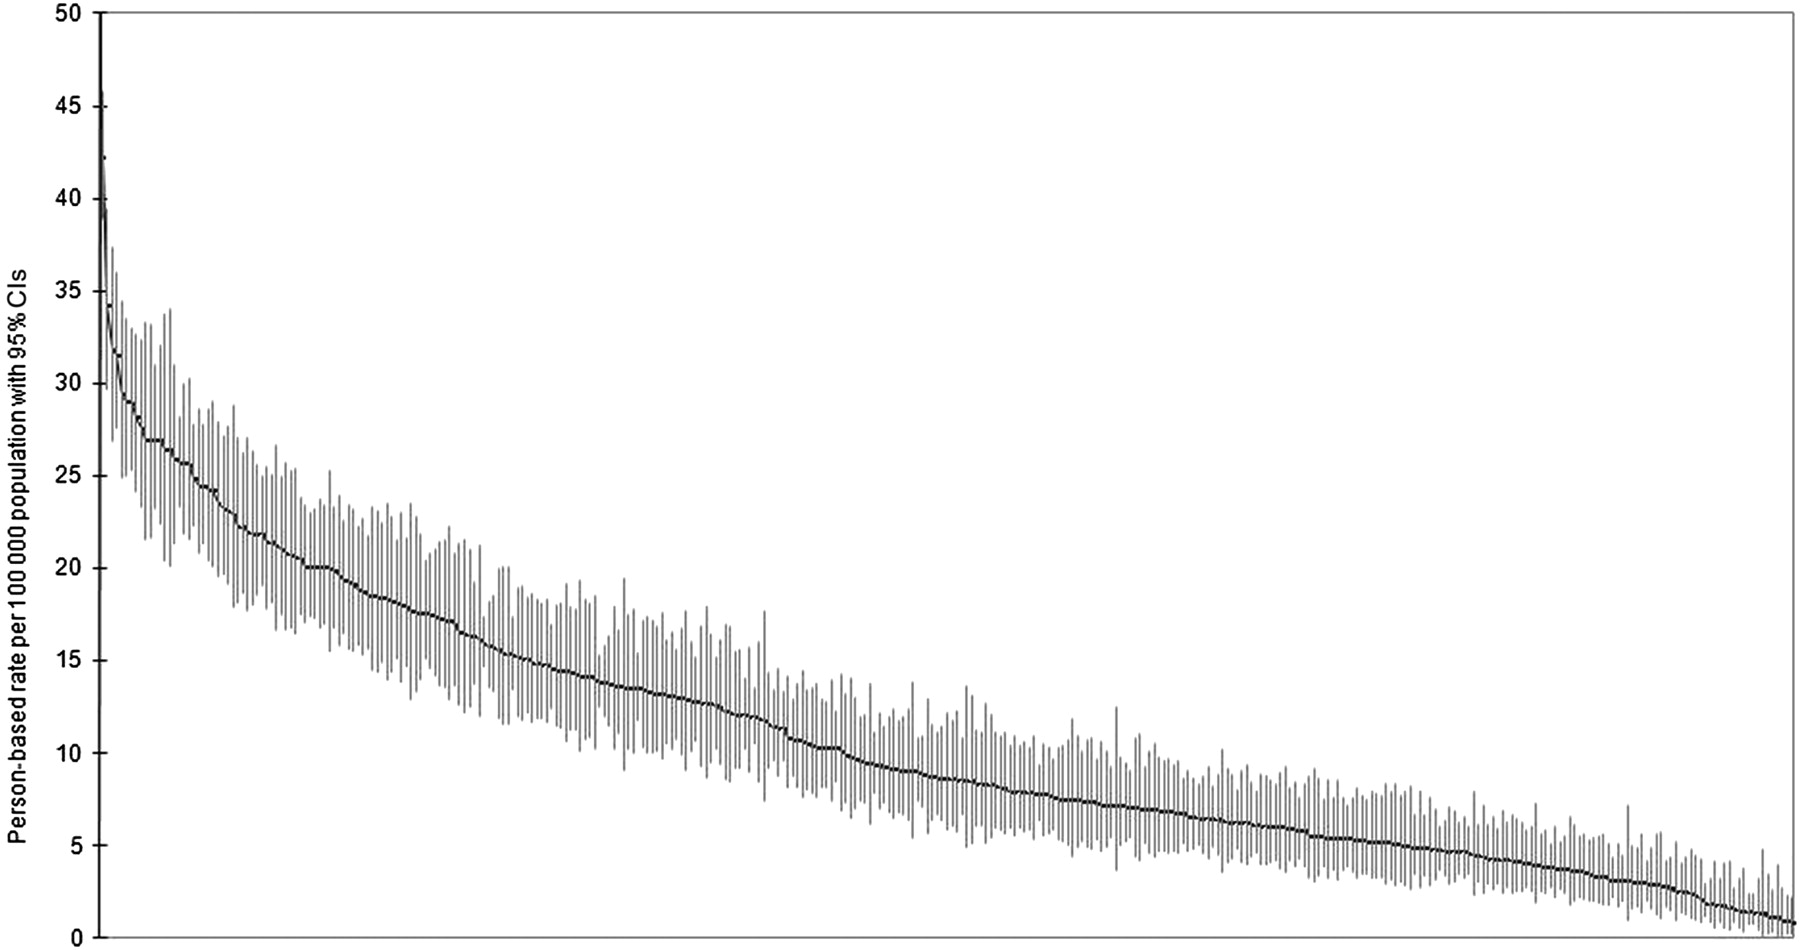
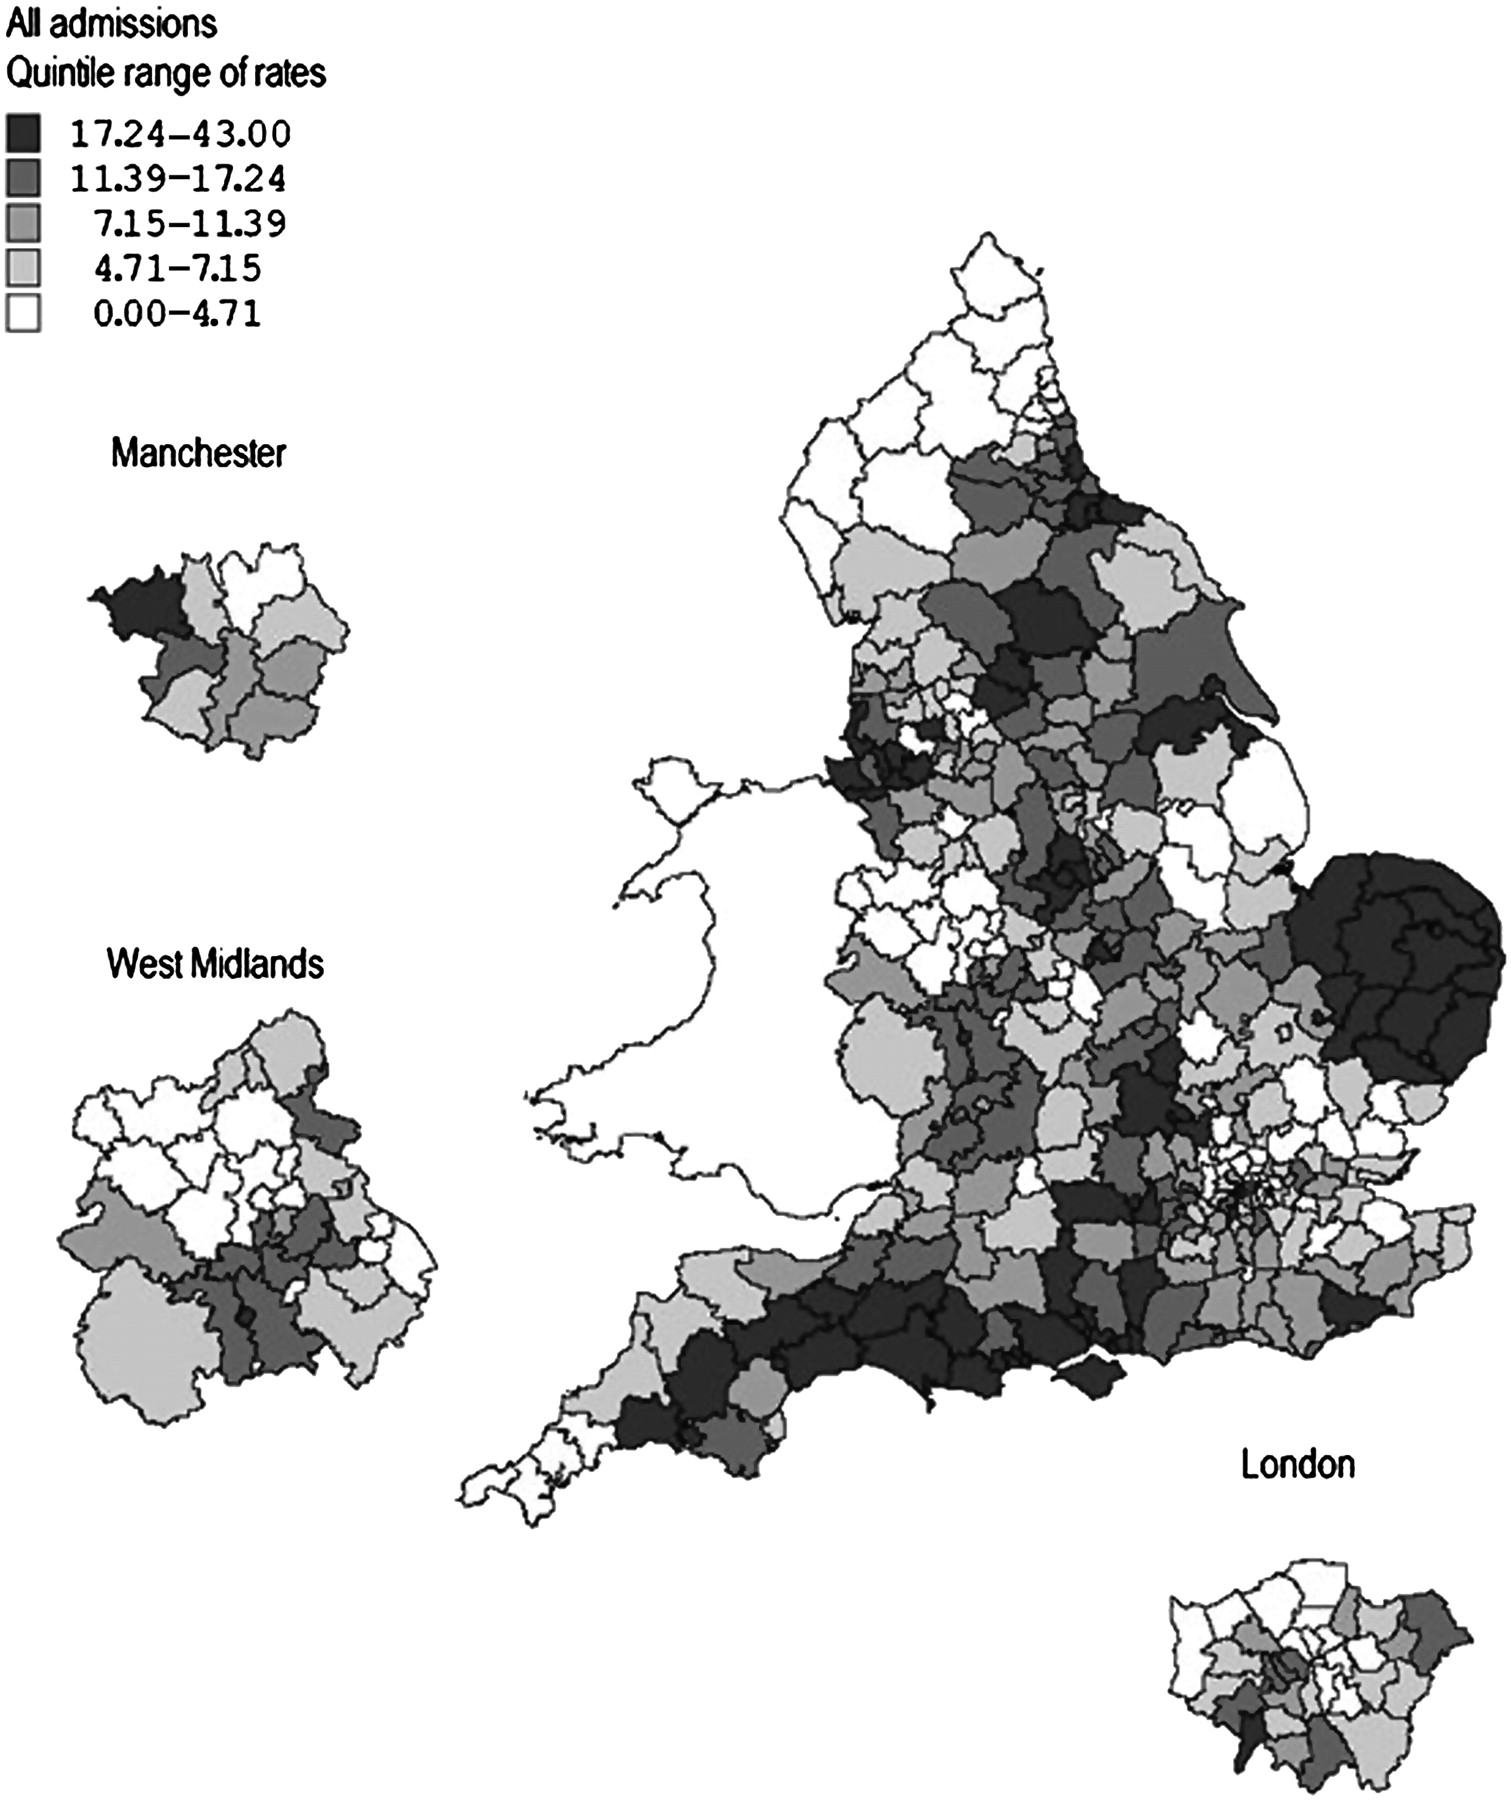
Figure 4 shows a geographical profile of the annual rate of intravitreal injection by LA. LAs showed a very wide variation in rates of injection, ranging from 0.9 (0.2–2.2) to 42.2 (38.9–45.7) people per 100 000 population per year in 2005–2008. The wide variation is attributable not just to small numbers of atypical outlying areas; instead, there is a general gradation of highly varying rates across the country (figure 5). The rate of surgery by LA showed no correlation with the index of multiple deprivation (r2=0.00).

Map of mean annual hospital treatment rates for intravitreal injection across England from 2005/2006 to 2008/2009, showing rates for each local authority area with expansions for Manchester, West Midlands and London, with quintiles of rates from highest (darkest shading) to lowest (lightest shading).
Error bar plot of local authority annual hospital treatment rates for intravitreal injection, plotted from highest to lowest, showing each area as a plotted rate (with its 95% CI shown as the vertical bar on the plotted rate).
Discussion
National rates of intravitreal injection in England rose gradually from 1989 to 2006, then increased more than fivefold from 2006 to 2008. This dramatic rise has been most marked in people aged 70 years and above, and has been larger for women than for men. In particular, the rise is accounted for in large part by very substantial increases in intravitreal injections for AMD from 2006. This followed the FDA licensing of ranibizumab for the treatment of neovascular AMD in 2006 (USA) and 2007 (EU), and its recommendation by NICE in August 2008, though their close spacing makes it difficult to determine their relative contributions. Indeed, the dramatic rise in intravitreal injections for AMD has swamped previous indications for intravitreal injections including antibiotic injection for infective endophthalmitis or corticosteroid injection for inflammatory eye disease or macular oedema.24 25 As expected, the final years of the study period have also seen the emerging phenomenon of multiple injections per person per year, particularly for AMD. In fact, the mean obtained for AMD patients of 2.7 injections per person in 2008 is lower than might be expected, given that the prescribing and licensing information for ranibizumab recommends monthly injections.11 However, this finding might be explained by the contribution of patients in the latter stages of therapy treated ‘as required,’ for example, perhaps only once per year.
Population-based rates of intravitreal injections showed an extremely wide variation between LAs, with around 50-fold variation in rates between LAs with highest and lowest rates. This variation is not attributable to differences in age structure between LAs: the rates are age-standardised. The variation showed no association with the degree of socio-economic deprivation in each LA. This suggests that, while there is no reduction in access to AMD services in areas with high levels of social deprivation, there is very substantial disparity in the provision of this aspect of AMD services across the NHS in England. For example, high rates were observed to occur in clusters around specialist centres including Norwich, Liverpool and Newcastle, while people living in some other LAs had almost negligible rates of injection in 2005–2008. These observations are in contrast with the RCO requirements of ‘geographical equity of access to all regions within the UK’ for AMD services, that ‘there needs to be immediate rapid access to retinal specialists with expertise in the management of wet AMD for all patients, irrespective of geographic location’ and that ‘no particular patient or region should be disadvantaged.’16
However, it is possible that injection rates may have become more evenly distributed across England since 2005–2008. Smaller units may have taken longer to respond to increased demand for anti-VEGF therapy following NICE approval of ranibizumab. It is also possible that the IVAN trial26 may have influenced the trends observed, as this study involves intravitreal injections of ranibizumab or bevacizumab (300 patients each) over 24 months and will have comprised over 10 000 injections. This might help explain part of the regional variation, since recruiting units included 19 larger centres such as Liverpool and Newcastle. However, given that our study comprised 4 years of data from April 2005 to March 2009, and that recruitment to the IVAN trial was not completed until October 2010, the effect on treatment rates is likely to be limited.
Reports of rapid increases in annual numbers of intravitreal injections have also been published for Canada and the USA.27–29 In Ontario, annual injection rates increased rapidly from 42 per 100 000 population (2005) to 311 (2007).27 Similarly, in the USA, the number of intravitreal injections administered to Medicare beneficiaries increased from fewer than 5000 (2001) to 812 000 (2007).28 In 2008, the Medicare annual rate of intravitreal therapy for neovascular AMD was 1506 bevacizumab and 1057 ranibizumab injections per 100 000 population. The mean number of injections received per year by each person with neovascular AMD was 3.3 (bevacizumab) or 4.2 (ranibizumab). As in our study, the regional variation was wide between states, with annual rates ranging from 736 injections (Vermont) to 4090 (Connecticut). No large-scale studies of the number of patients undergoing intravitreal injection in Europe or South America have been reported, to our knowledge, in the recent literature.
Our data demonstrate that the annual number of intravitreal injection episodes has increased over 150-fold in England from 203 in 1989 to 30 458 in 2008. It is presumed that the majority relate to the licensed form of treatment, ranibizumab. If all injections in 2008 were indeed ranibizumab, the cost to the NHS of the drug alone for that year would have been over £3 million. Using recent estimates that over 25 000 cases of neovascular AMD might be eligible for anti-VEGF therapy each year in the UK, that the combined cost of a hospital assessment and injection is £1750 and that a typical treatment course involves 14 injections over 2 years, the cost to the NHS of ranibizumab treatment for these patients would be over £600 million per year (£1750×14×25 000).17 19 30
HES data are currently unable to distinguish between ranibizumab and bevacizumab injections. Indeed, using code C79.4 alone cannot discriminate between intravitreal injection for AMD versus (for example) an antibiotic for infective endophthalmitis. We therefore combined the operative code with the diagnostic code for AMD, though it is still possible that a small number of the intravitreal injections for AMD were not anti-VEGF drugs (eg, corticosteroid adjunct) or were for conditions other than neovascular AMD (eg, corticosteroid for diabetic maculopathy in a patient with coexisting AMD).
However, a new OPCS4 code was introduced in 2008/2009: X93.8 (other specified high-cost ophthalmology drugs), replaced in 2009/2010 by X93.1 (subfoveal choroidal neovascularisation drugs Band 1). This code is gradually now being used in conjunction with C79.4 when a patient undergoes intravitreal injection of ranibizumab or bevacizumab, and 6073 episodes of X93.1 were recorded in 2009/2010. Although this information will prove very useful in future analyses, it would be more helpful to have a separate code for each drug, given their cost disparity. However, this study does demonstrate that HES data can be used effectively in capturing NHS activity. This is particularly true where the object of interest is an intervention which involves inpatient admission or day case care. We have also employed means of ensuring that the data have ‘face validity,’ including analysing age-specific data and geographical variation.
The emergence of intravitreal injections for AMD provides a useful illustration of the issues surrounding the uptake of expensive new treatments in health services with limited financial resources and workforce staffing. The findings on trends over time demonstrate dramatic speed of adoption, particularly in conjunction with FDA licensing and NICE recommendations. The geographical analyses show that the provision of new treatments is likely to be extremely uneven. This expensive new treatment, requiring repeated and long-term administration, and demanding significant allocation of resources in retinal imaging, physician diagnosis and surgical time, illustrates the considerable implications for service provision that may follow clinical innovation.31
The adoption of anti-VEGF therapy also provides a useful illustration of the important roles played by pharmaceutical companies and licensing, particularly where there is a choice between an expensive licensed treatment and a cheaper unlicensed alternative. Ranibizumab and bevacizumab are both owned by the same company, Roche and its subsidiary Genentech. It is important to know whether bevacizumab is safe and effective in the treatment of AMD, but the company has not sought a licence for ocular use of the cheaper alternative and, to the best of our knowledge, has not organised any trials of bevacizumab for AMD.12 In the UK, the efficacy of bevacizumab in the treatment of AMD has since been demonstrated in an independent trial,32 and another independent randomised controlled trial is currently comparing ranibizumab and bevacizumab.26 The English Department of Health has only recently referred bevacizumab for AMD to NICE, as NICE does not usually appraise drugs outside their licensed indications.15 33
In the context of an increasingly older population affected by multiple comorbid conditions, AMD provides a useful example of a disease of older people which causes much more morbidity than mortality. It can lead to many years of reduced quality of life, and increased dependence on nursing care.4–7 It therefore raises important questions of the willingness of health services and societies in developed countries to pay for expensive new drugs. It also raises questions of how health services, government departments and pharmaceutical companies might work more closely together to license potentially cheap and effective drugs where the alternatives are expensive.
Acknowledgments
Geographical atlases of surgical rates were produced using data provided through EDINA UKBORDERS with the support of the Economic and Social Research Council and the Joint Information Systemic Committee, together with boundary material which is copyright of the Crown. Record linkage was undertaken on the English national dataset by the Oxford Record Linkage Study team.
References
Footnotes
Funding TDLK is funded by Fight For Sight through a Clinical Fellowship. The Unit of HealthCare Epidemiology is funded to undertake research on the regional and national hospital databases by the English National Institute for Health Research.
Competing interests None.
Ethical approval Ethics approval was provided by the NHS Central Office for Research Ethics Committees (reference 04/Q2006/176).
Provenance and peer review Not commissioned; externally peer reviewed.