Article Text

Abstract
Aims To report the complete lifetime direct healthcare costs of glaucoma treatment in a database of 1136 patients attending the Glaucoma Clinic at Glasgow Royal Infirmary, Glasgow, UK.
Method The database was interrogated to identify all patients who had initiated treatment at the Glaucoma Clinic at Glasgow Royal Infirmary, and who had subsequently died of natural causes. The healthcare resource use based cost assessment was based on two aspects of the direct National Health Service cost: drug costs (prescribed medications) and non-drug costs (inpatient or outpatient/and surgical or procedure costs).
Results 106 patients (53 men, 53 women) were identified for whom there were lifetime treatment data. The mean lifespan of the patients was 80.5 years, and the mean number of years attending the glaucoma clinic was 7.05 years (range 1–22 years). The mean cost of glaucoma treatment over the lifetime of the patients was £3001, with an annual mean cost per patient of £475. Non-drug and drug costs made up 66% and 34% respectively, of the lifetime costs.
Conclusions This is the only study to directly assess the lifetime treatment costs of glaucoma. Awareness of the costs of glaucoma treatment may be of increased importance in these financially challenging times.
- Glaucoma
Statistics from Altmetric.com
Introduction
Glaucoma is a leading cause of blindness worldwide.1 In the UK, the prevalence of glaucoma has been estimated to be as high as 3.3% in people over the age of 40, and up to 5% in those aged 80 years and over.2 As a major health problem with a continuous demand for treatment that may be medical and surgical, the management of glaucoma has considerable economic consequences. There have been several reports on the economic burden of the management of glaucoma, but these have either been time limited3–5 or have used mathematical models,6 or experimental models.7 None have directly assessed the lifetime treatment costs of the glaucoma treatment.
We have previously described, in this journal, a large and unique computerised database established at the glaucoma clinic at Glasgow Royal Infirmary, with data now spanning 27 years.8 ,9 We now present our findings on the total direct healthcare-related costs for glaucoma management in a population of patients for whom we have complete lifetime data.
Subjects and methods
The Glasgow glaucoma database
The Glasgow Glaucoma Database was designed using Microsoft Access with the intention of collecting information on all patients who had undergone, or were undergoing, medical treatment for ocular hypertension (OHT), normal tension glaucoma (NTG) or primary open angle glaucoma (POAG). In 1999, the database was populated with retrospective data abstracted from medical records dating from as early as 1981, according to the algorithm in figure 1. Information collected for each patient at the start of treatment included the following: patient identification number; date of birth; sex; diagnosis; starting treatment and date commenced. If a subsequent visit resulted in no alteration of treatment, the date of the visit was simply logged. If a treatment alteration did occur, this was documented in the database along with detailed reasons for the change. Since 1999, the database has been updated prospectively for all new and existing patients at every clinic visit. Data are saved securely on a central server and may be accessed simultaneously from multiple clinic-based computers.
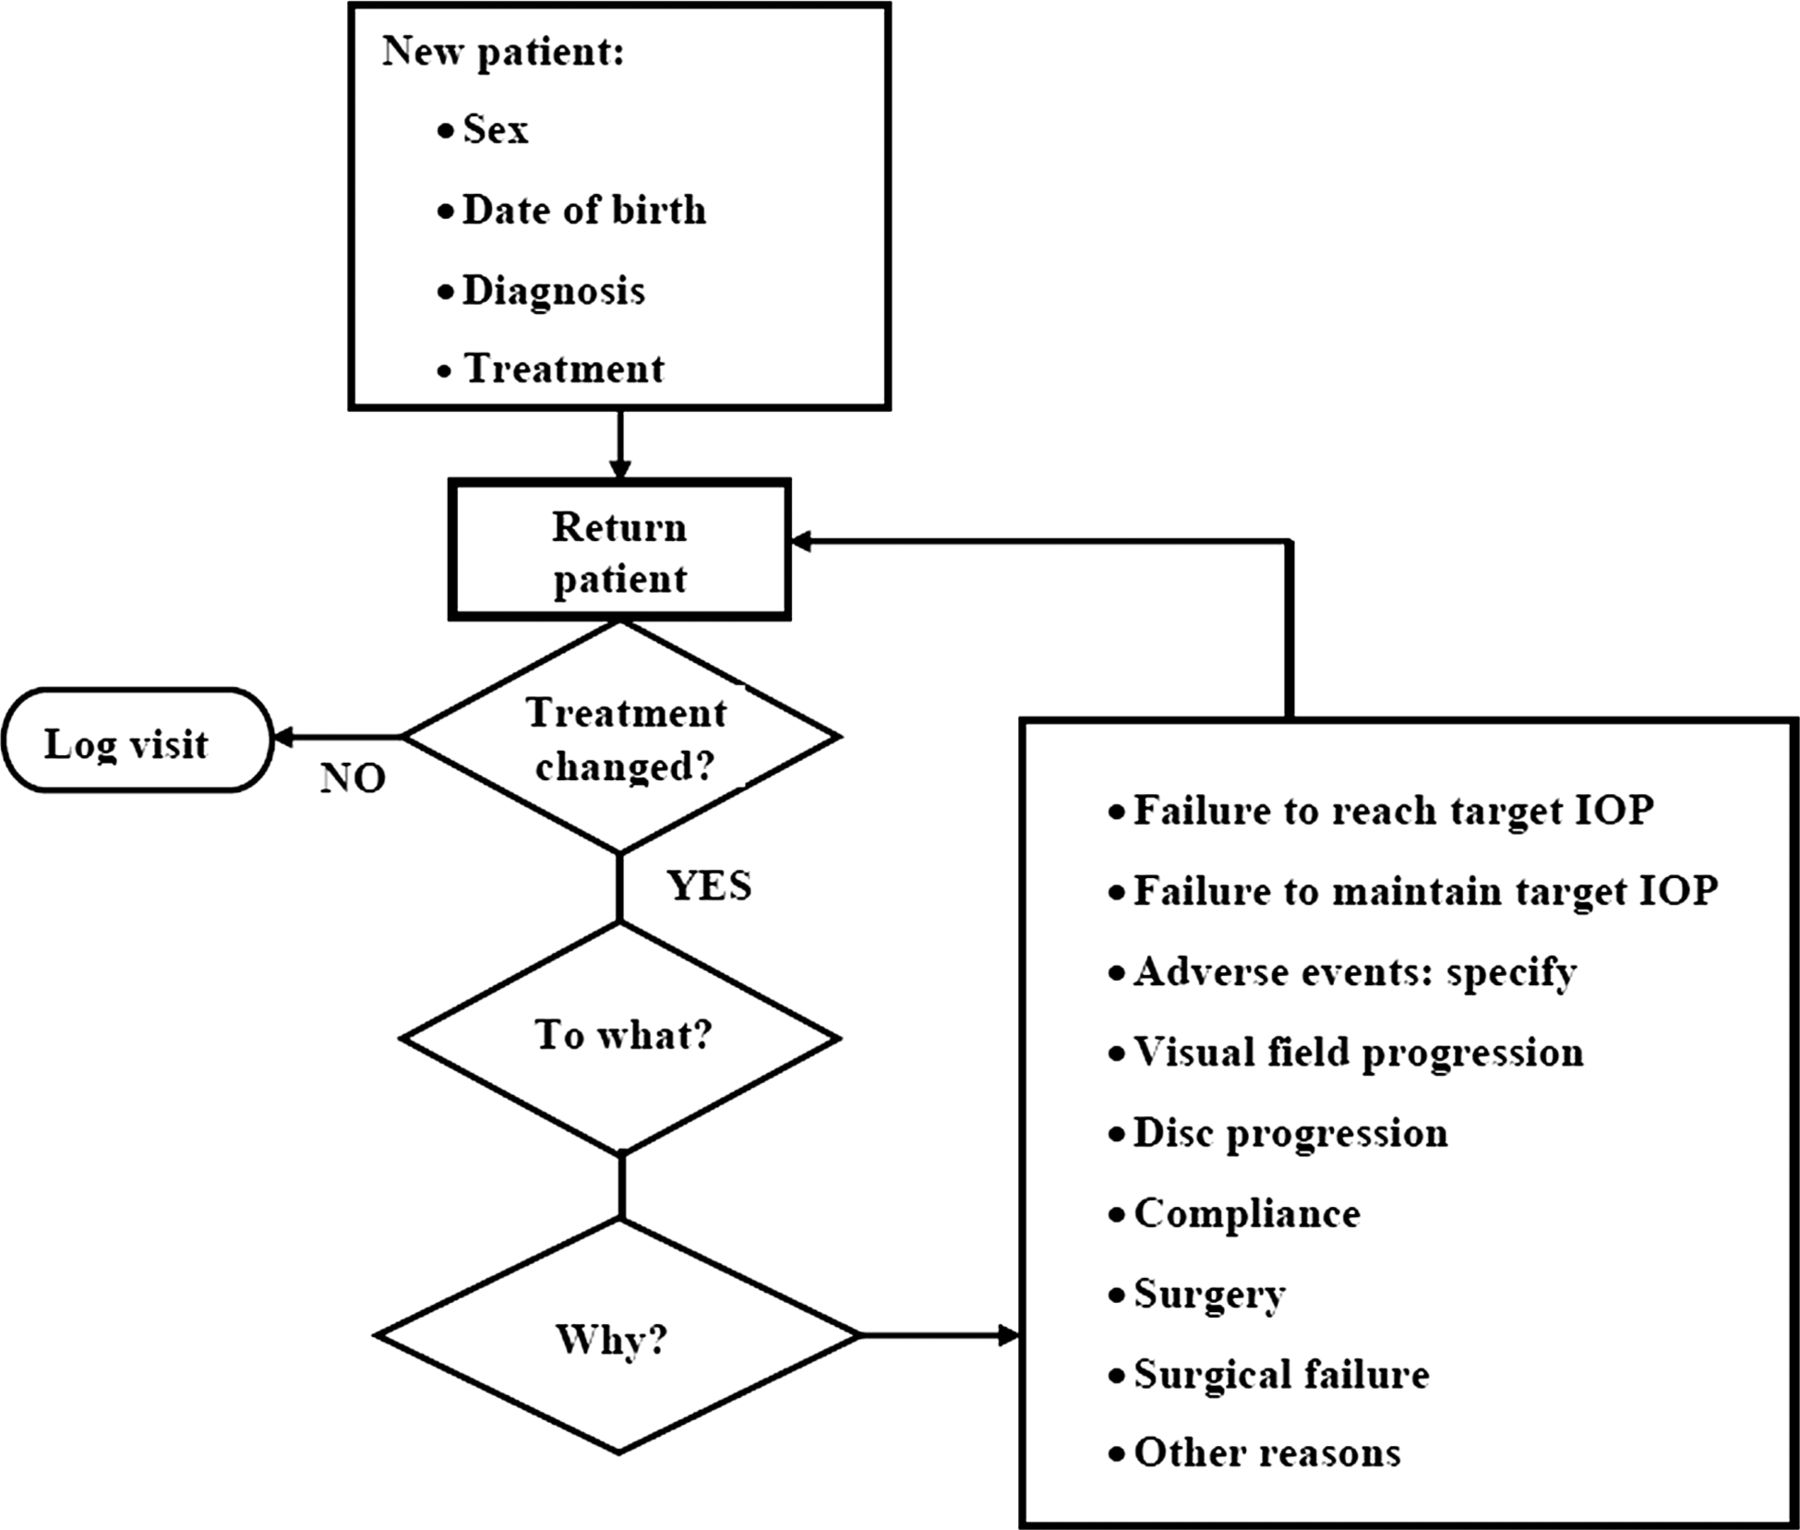
Glasgow Royal Infirmary glaucoma database patient information algorithm.
The Glasgow Glaucoma Database currently contains a set of complete treatment histories on 1136 patients, representing healthcare resource use data covering over 9000 patient treatment years. For the purposes of this study, the database was searched thoroughly to identify all patients who had initiated treatment for OHT, NTG or POAG at the Glaucoma Clinic at Glasgow Royal Infirmary, and who had subsequently died of natural causes. This provided an analysis data set based on a cohort of patients who attended the clinic for glaucoma and who had lifetime healthcare resource use data. This data set was used to support a resource use and cost assessment based on two specific aspects of the direct National Health Service (NHS) cost: drug costs (prescribed medications) and non-drug costs (inpatient stays/outpatient attendance, and surgical or procedure costs). The data on resource use as recorded in the database has been assumed to represent glaucoma-driven healthcare activity, as seen at the Glaucoma Clinic. The wider societal costs from caring for the visually impaired patient are not covered in the database and these are excluded from the cost analyses, but could be expected to represent a significant aspect of the overall cost burden of glaucoma.
Drug cost calculation
For each patient, an overall duration of care was identified based on the time of the first clinic appointment through to that patient's death. The range of prescription medications used for each patient over the duration of their NHS care for glaucoma (overall 19 different medications were used in the full-patient data set), and a pattern of prescribing for the period was identified. Typically, patients received an average of 4–5 individual drug treatments for glaucoma over their lifetime. Drug pricing data were based on the past and current issues of the British National Formulary, noting patterns of changes in drug unit cost changes over the lifetime of an individual patient's treatment. An average unit cost per year for each medication was multiplied by the resource use associated with each individual patient based on the years under treatment. We did not inflate the historical data to 2011 values as drug costs do not follow the normal inflationary pattern, and typically either remain stable or decline over time.
For each individual patient, the set of drug unit costs were applied to the prescribing data to calculate a total lifetime drug cost and the average annual drug cost per patient.
Non-drug calculation
For each patient, the number of events related to a direct use of NHS resources was identified. These included the number of outpatient clinic attendances, the number of days spent as an inpatient, any surgical or medical procedures that were performed and any visual field testing that was carried out. Historical unit costs for each event type were obtained from NHS Reference Cost online files going back to 1998.10 In the absence of published data, unit costs were assumed to remain static prior to 1998.
For surgical (such as trabeculectomy, phacoemulsification and phacotrabeculectomy) or medical procedures (visual field test), the appropriate version of the Healthcare Resource Group (HRG) Grouper tool was used to match the patient diagnosis codes (ICD-10), and procedure codes (OPCS-4) to HRG codes (Grouper tools HRG4 and HRG3.5 were used for the pre-2003 and post-2003 periods).
For inpatient days, the cost per day was based on ophthalmology as the speciality, and the weighted average cost was based on glaucoma category 1–3 admissions.
Unit costs for non-drug resource use were inflated to 2011 values using the Hospital and Community Health Services—Pay and prices index (PSSRU, 2011).
For each individual patient, the set of patient-level non-drug unit costs were then applied to the collected healthcare resource use data to generate cost outcomes based on: a total non-drug cost per patient and an average annual non-drug cost per patient.
Statistical analysis
The analysis of cost was performed by applying unit costs for each resource type to the counts of resource use for each patient in the data set. A standard descriptive statistical analysis was conducted based on standard Microsoft Excel functions of AVERAGE and MEDIAN, and 95% CIs on PERCENTILE. A standard two-sided Student's t test was applied to all subgrouped data to explore statistically significant observed differences between average cost data from the samples.
Results
From the database, 106 patients were identified for whom we had lifetime treatment data. There were equal numbers of men and women in the 106 patients identified. The mean lifespan of the cohort was 80.5 years (range 51–97 years). For men, this was 80 years, and for women, this was 81 years. The mean number of years of clinic attendance was 7.07 years (range 1–22 years). Among these patients, a complete set of non-drug resource use and costs was not available for six patients.
The mean annual and lifetime costs of glaucoma treatment per patient are summarised in table 1. Overall, patients had an average annual cost and lifetime cost of £475 and £3001, respectively.
The mean annual and lifetime costs of glaucoma treatment per patient.*
The median, upper and lower 95% CI data on annual cost per patient for glaucoma treatment are shown in figure 2A. The median non-drug cost per patient annually was £183 and the median drug cost was £155. The overall annual median cost per patient per year for glaucoma treatment was £375.

(A) The median annual cost per patient for glaucoma treatment. (B) The median lifetime cost per patient for glaucoma treatment over a lifetime. This figure is only reproduced in colour in the online version.
The median, upper and lower 95% CI data on overall cost per patient for glaucoma over a lifetime are as shown in figure 2B. The median lifetime non-drug cost per patient was £1305 and the median drug cost was £906. The overall lifetime median cost per patient for glaucoma treatment was £2424.
Non-drug resource use (such as surgical and medical procedures, inpatient days and outpatient attendance) accounted for 66% of the mean lifetime costs, with the remaining 34% represented by prescribed drugs (figure 3).

The breakdown of lifetime costs for glaucoma treatment. This figure is only reproduced in colour in the online version.
The mean length of time the patients were on specific medications is shown in figure 4A. In this cohort, the most commonly prescribed medications were Xalatan and timolol.

(A) The mean length of time drugs were used per patient over a lifetime. (B) The mean lifetime drug cost of glaucoma medications over a lifetime. This figure is only reproduced in colour in the online version.
The mean lifetime drug costs per patient are shown in figure 4B, broken down by individual drugs. The overall mean lifetime cost of medications was £1030 per patient. The highest average lifetime drug cost was related to Xalatan (£541 per patient), and this was four times more than the medication with the next biggest average lifetime cost, Alphagan (£128 per patient).
The breakdown of the non-drug costs is shown in figure 5. The largest cost was attributed to outpatient costs (49%), followed by surgical costs (20%), procedure costs (18%) and finally inpatient costs (14%). The mean cost per patient lifetime was £387 (95% CI £0 to £2631) for surgery, £351 (95% CI £0 to £1817) for procedures, £270 (95% CI £0 to £2048) for inpatient costs and £965 (95% CI £134 to £3204) for outpatient.

The breakdown of non-drug costs for glaucoma treatment. This figure is only reproduced in colour in the online version.
Of the 100 patients identified in the data set with non-drug resource use data, 25% had at least one recorded surgical procedure (trabeculectomy or phacotrabeculectomy) for their glaucoma during their lifetime care. There was a mean of 1.8 (median=2.0) surgical procedures for patients who required surgical intervention. Representing the average lifetime non-drug cost per patient of care stratified by the need for surgery, we observed that patients who required surgery had significantly higher costs of £4019 compared with £1290 for those patients not requiring surgery (p<0.0001). The need for surgical procedure was clearly a significant indicator of higher overall average costs across all the non-drug resource use categories (not only surgical procedure). The average drug cost per patient remained numerically comparable across the two groups, that is, £1114 and £1001 respectively, with a non-significant difference of £113 (p=0.61). Similarly, representing the average lifetime cost per patient by gender, we see comparable costs of £2996 for women and £3007 for men, representing a non-significant difference of £113 (p=0.89).
We, however, did see a clear statistically significant difference when considering the data stratified by diagnosis, with patients having POAG (74 of 106 patients; compared with 10 diagnosed with NTG and 20 diagnosed with OHT) being associated with a higher average lifetime cost (£3386) compared with patients with NTG or OHT (£1941–£2054) (p<0.002). Patients with a diagnosis of POAG had an average of 1.9 surgical procedures during their lifetime compared with 1.0–1.5 procedures for non-POAG patients (p=0.078). Overall, 88% of all surgery was conducted in POAG-diagnosed patients (40 of a total of 45 procedures reported in the overall patient group). The average lifetime drug cost in POAG-diagnosed patients was £1128 compared with £810 for non-POAG patients (p=0.018).
Finally, the age of the patient had a degree of impact on the annualised cost of care when we grouped patients into categories of less than 80 years of age (n=51) or 80 years and more (n-=55). The mean annualised costs were £441 and £506, respectively, representing a non-significant difference of £65 (p=0.47).
Discussion
To the best of our knowledge, this is the only study in the literature that reports on a direct assessment of the annual and lifetime direct healthcare costs of glaucoma treatment. As our assessment was based on actual retrospective and prospectively collected patient-level data within the context of a glaucoma clinic, our study did not use mathematical or experimental models, and our data were not time limited.
We found that the total mean lifetime cost for glaucoma treatment was £3001. This figure is similar to a previous study in Glasgow comparing the cost of early surgical treatment against medication as a first treatment, in which an average cost of £2560 was found over the 8-year period of the study.11 Ainsworth and Jay found that the highest cost was for inpatient stay, with an average stay in hospital of 7.6 days. Although we also found that non-drug costs were the largest contributor to the overall cost, in our study outpatient attendance costs were greater than either surgical procedures or inpatient costs. This may reflect changes in treatment pattern, with fewer surgeries and inpatient stays now required as a result of the expansion in the range of drugs available in the mid-1990s. In our cohort, 25% of the patients had at least one recorded surgical procedure for glaucoma, and corresponding incidences of surgery vary between 28.5%–45.5% in other retrospective studies.12 ,13 A study looking at lifetime treatments costs in France found the cost to be higher at €8488 (£7053), but Markov modelling was used rather than a direct assessment of costs, and the clinical setting and healthcare resource use patterns may differ across countries.14
As most other studies in the literature are time limited, it may be easier to compare annual costs of treatment found in other studies. Our study found the mean annual cost per patient per year of glaucoma treatment to be £475. A large retrospective study of 1655 consecutive cases from five different European countries (Austria, France, Germany, Italy and the UK) found the annual cost to depend on the stage of disease and ranged from €455 to €969 (£378–£805). Drug costs made up a higher proportion, that is, 42%–56% compared with 34% of all costs in our study. This may be because Traverso et al restricted their study from 1995 to 2003 when there was an increase in the number of topical therapies available. Our study did not find that age and gender had a significant impact on the annual cost of glaucoma treatment. However, patients with POAG were around twice as more expensive to treat over their lifetimes than patients with either OHT or NTG. This may be because of more aggressive treatment and more surgical procedures performed with POAG compared with OHT and NTG.
There are several limitations to the present study. The population is specific to the east end of Glasgow, and conclusions may therefore not be as applicable to populations in other regions of the UK or other countries. However, the mean life expectancy of the cohort was very similar to the current UK average of 80 years.15
Complete patient concordance with topical medications and the use of one bottle per month were assumed during this study, as these were not recorded in the database. This may lead to an underestimation of the true costs.
It should also be remembered that drug costs do not remain static and change over time. As the prostaglandin analogues become generic, their unit costs are likely to drop in the future.
Increased awareness of clinical costs is important in these financially harsh times. With the NHS in England no longer guaranteeing increases in investment above the rate of inflation, and similar fiscal tightening on the health budgets in other regions of the UK, the authors hope that this report provides useful information to clinicians and policy makers alike on the economics of glaucoma management.
Acknowledgments
The authors thank Richard Norman (Alcon), Gerry Bradley (Pfizer), and Laura Watson (Allergan) for providing historical drug cost data.
References
Footnotes
-
Contributors MQR, SMB, RD, RS, and DMIM made substantial contributions to conception and design, acquisition of data, analysis and interpretation of data, drafting the article and revising it critically for important intellectual content and final approval of the version to be published. All listed authors therefore deserve recognition as authors of this manuscript.
-
Competing interests None.
-
Provenance and peer review Not commissioned; externally peer reviewed.