Article Text

Abstract
Background To examine the prevalence, patterns and trends of vision impairment and its causes from 1990 to 2010 in Central and South Asia.
Methods Based on the Global Burden of Diseases Study 2010 and ongoing literature searches, we examined prevalence and causes of moderate and severe vision impairment (MSVI; presenting visual acuity <6/18, ≥3/60) and blindness (presenting visual acuity <3/60).
Results In Central Asia, the estimated age-standardised prevalence of blindness decreased from 0.4% (95% CI 0.3% to 0.6%) to 0.2% (95% CI 0.2% to 0.3%) and of MSVI from 3.0% (95% CI 1.9% to 4.7%) to 1.9% (95% CI 1.2% to 3.2%), and in South Asia blindness decreased from 1.7% (95% CI 1.4% to 2.1%) to 1.1% (95% CI 0.9% to 1.3%) and MSVI from 8.9% (95% CI 6.9% to 10.9%) to 6.4% (95% CI 5.2% to 8.2%). In 2010, 135 000 (95% CI 99 000 to 194 000) people were blind in Central Asia and 10 600 000 (95% CI 8 397 000 to 12 500 000) people in South Asia. MSVI was present in 1 178 000 (95% CI 772 000 to 2 243 000) people in the Central Asia, and in 71 600 000 (95% CI 57 600 000 to 92 600 000) people in South Asia. Women were generally more often affected than men. The leading causes of blindness (cataract) and MSVI (undercorrected refractive error) did not change from 1990 to 2010.
Conclusions The prevalence of blindness and MSVI in South Asia is still three times higher than in Central Asia and globally, with women generally more often affected than women. In both regions, cataract and undercorrected refractive error were major causes of blindness and MSVI.
- Epidemiology
- Macula
- Glaucoma
Statistics from Altmetric.com
Central and South Asia, including India, comprise about one-fourth of the world population and have witnessed major political and socioeconomic changes in the last 20 years. Vision loss is of paramount importance for the individual and for the society as a whole. Meta-analysing surveys on the prevalence and cause of visual impairment, regional estimates and trends analyses for the period of the last two decades for Central and South Asia has not yet been performed. These were the reasons to conduct this study examining the frequency of, and reasons for, blindness and visual impairment in Central and South Asia. We used the data collected by the Vision Loss Expert Group of the Global Burden of Disease Study GBD 2010 which had given a comprehensive assessment of mortality and loss of health due to diseases, injuries and risk factors for all regions of the world.1–3 A recent analysis of the global prevalence and causes for vision loss has revealed that worldwide 32.4 million people were blind (defined as presenting visual acuity <3/60) in 2010 and 191 million people (57% women) had a moderate and severe vision impairment (MSVI; defined as presenting visual acuity <6/18 but ≥3/60).4–6
Methods
A systematic review of medical literature from 1 January 1980 to 31 January 2012 identified indexed articles containing data on incidence, prevalence and causes of blindness and MSVI.4–6 For the present study, we assessed the data for countries of Central and South Asia and compared the data with the global data. Central Asia included Armenia, Azerbaijan, Georgia, Kazakhstan, Kyrgyzstan, Mongolia, Tajikistan, Turkmenistan and Uzbekistan; and South Asia included Afghanistan, Bangladesh, Bhutan, India, Nepal and Pakistan. We estimated the contribution of six causes of vision impairment and blindness: cataract, macular degeneration (including age-related macular degeneration, myopic maculopathy and any other macular disorder), glaucoma (all types of glaucoma combined), diabetic retinopathy, trachoma and uncorrected refractive error (estimated as the difference between presenting and best-corrected vision impairment, including aphakia). We also estimated the fraction of visual impairment that had other known or unknown causes. For the statistical analysis, we used 5-year age-range estimates and applied DisMod-MR, an age-integrating Bayesian multilevel regression tool, for the calculation of cause fractions for major causes of vision impairment to calculate the fraction of vision impairment due to causes mentioned above.3 ,5 For presentation, we age-standardised prevalences using the WHO reference population. The methods have been described in detail recently and in a companion study.4–7
Results
Vision loss in Central and South Asia was examined in 42 studies with most reports coming from South Asia (Bangladesh (n=2), India (n=16), Nepal (n=16), Pakistan (n=5)) and only three studies from Central Asia (Mongolia (n=2), Turkmenistan (n=1)). Most of the studies were cross-sectional investigations, and visual acuity data were ascertained through clinical examination. Out of the 42 studies, two were performed in urban regions, 21 studies in rural areas and 19 investigations were carried out in rural and urban regions. All these studies were listed previously.6
In Central Asia, the estimated age-standardised prevalence (all ages) of blindness decreased from 0.4% in 1990 to 0.2% in 2010 (table 1) (figure 1). The estimated age-standardised prevalence of MSVI (all ages) was 3.0% in 1990 and decreased to 1.9% in 2010 (figure 2). Correspondingly, the estimated age-standardised prevalence of blindness for adults decreased by 50%, relatively, from 1.8% in 1990 to 0.9% in 2010 (table 1), and the estimated age-standardised prevalence of MSVI for adults decreased from 11.6% to 7.2% in 2010. These figures were markedly lower than the mean figures for the global population (tables 2 and 3).
Estimated age-standardised prevalence of moderate and severe vision impairment (MSVI; presenting visual acuity in the better eye <6/18 but ≥3/60) and blindness (presenting visual acuity in the better eye <3/60) by sex and year in Central and South Asia
Absolute numbers of subjects affected by moderate and severe vision impairment (MSVI; presenting visual acuity in the better eye <6/18 but ≥3/60) and blindness (presenting visual acuity in the better eye <3/60) by sex and year in Central and South Asia (all ages)
Percentage of blindness (presenting visual acuity in the better eye <3/60) by cause, regions and the world, 1990 and 2010, all ages
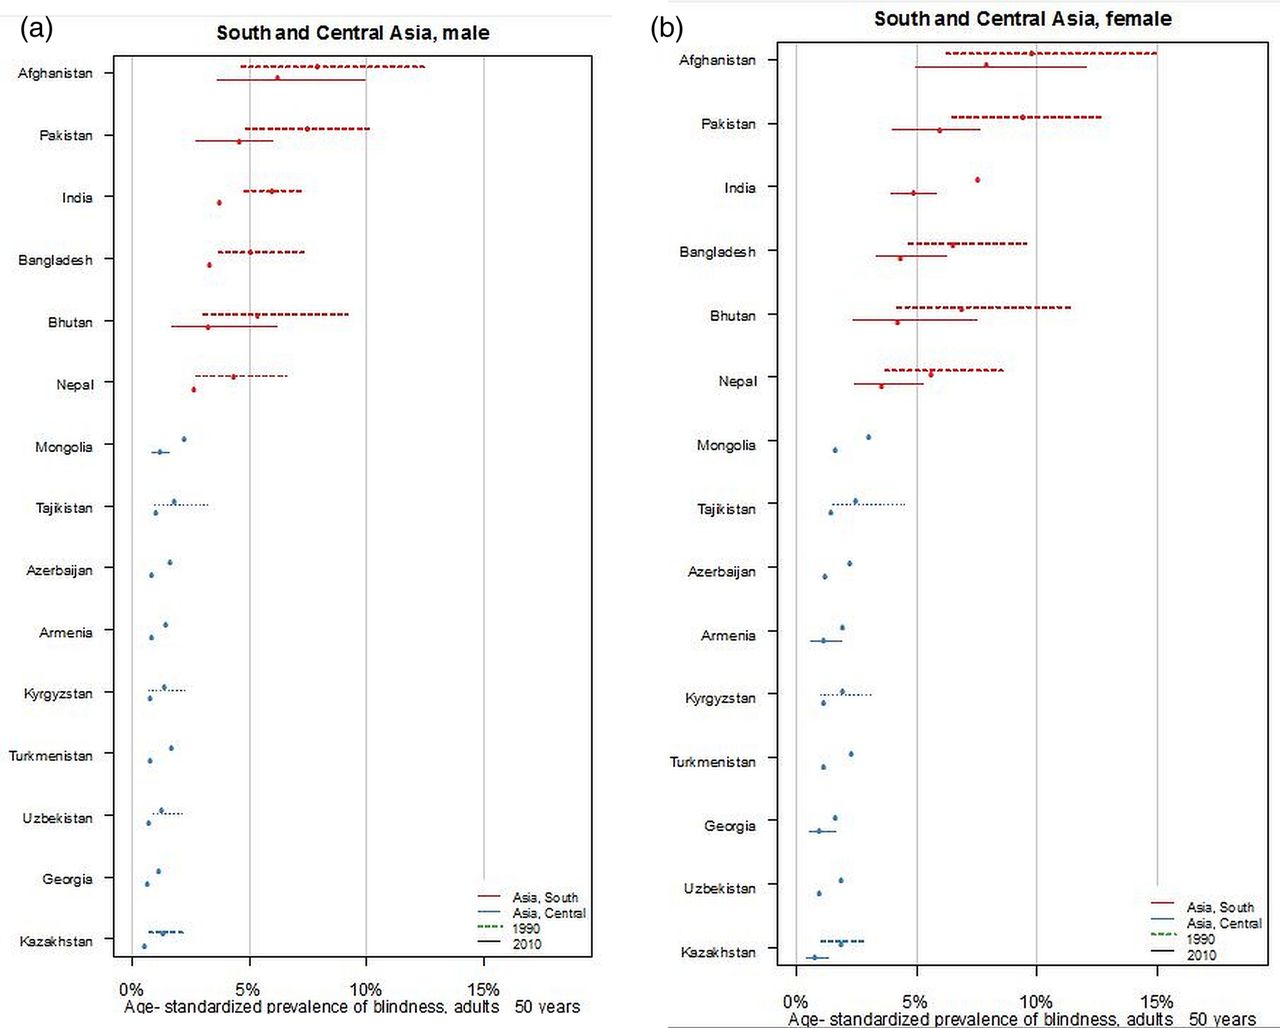
Ladder plot showing the age-standardised prevalence of blindness and change in men (A) and women (B) aged 50+ years for 1990 and 2010.

Ladder plot showing the age-standardised prevalence of moderate to severe visual impairment (MSVI) and change in men (A) and women (B) aged 50+ years for 1990 and 2010.
In South Asia, the prevalence figures were markedly higher than in Central Asia, and also showed a marked decrease from 1990 to 2010. The estimated age-standardised prevalence (all ages) of blindness decreased from 1.7% in 1990 to 1.1% in 2010 (table 1). The estimated age-standardised prevalence of MSVI (all ages) decreased from 8.9% to 6.4% (table 1). Correspondingly, the estimated age-standardised prevalence of blindness for adults decreased from 6.9% to 4.4%, and the estimated age-standardised prevalence of MSVI for adults decreased from 31.6% to 23.6%. These figures were by a factor of 3 higher than the mean figures for the global population (table 1).
Overall, the prevalence of blindness and MSVI was higher among women than among men across all regions and for 1990 and 2010. The absolute numbers affected by blindness and MSVI were significantly higher among women compared with men (table 2).
The leading causes of blindness did not change from 1990 to 2010, with cataract being the most frequent cause of blindness in both subregions, followed by undercorrected refractive error. In Central Asia, macular degeneration held the third place in 1990 and in 2010, followed by glaucoma, diabetic retinopathy and finally trachoma (table 3). In South Asia, glaucoma (instead of macular degeneration) ranked third, followed by macular degeneration and diabetic retinopathy. Trachoma ranked seventh at both times.
In a similar manner, the two leading causes of MSVI did not change from 1990 to 2010 (table 3). Undercorrected refractive error was by far the most frequent cause of MSVI in both subregions, followed by cataract. In Central Asia, macular degeneration was third in 1990 and in 2010, followed by glaucoma, diabetic retinopathy and trachoma. In South Asia, diabetic retinopathy was slightly more frequently the cause for MSVI than was glaucoma, macular degeneration and finally trachoma, with only small differences between these conditions.
In 2010, the estimated number of blind people of all ages in Central Asia was about 135 000 (24.2% or 33 000 with cataract; 13.9% or 19 000 due to undercorrection of refractive error; 13.3% or 18 000 due to macular degeneration; 12.0% or 16 000 subjects due to glaucoma; 4.0% or 5000 due to diabetic retinopathy) (table 3). In South Asia, there were 10 600 000 blind people (41.7% or 4 420 000 with cataract; 36.0% or 3 816 000 due to undercorrection of refractive error; 4.71% or 499 000 due to glaucoma; 2.8% or 297 000 due to diabetic retinopathy; 2.6% or 276 000 due to macular degeneration; 0.15% or 16 000 due to trachoma).
In 2010, the estimated number of people in Central Asia with MSVI was 1 178 000 (46.5% or 548 000 due to undercorrection of refractive error; 18.7% or 220 000 with cataract; 5.0% or 59 000 due to macular degeneration; 3.6% or 42 000 with glaucoma; 2.8% or 33 000 with diabetic retinopathy) (table 3). In South Asia, there were 71 600 000 (57 600 000–92 600 000) with MSVI (65.4% or 46 826 000 due to undercorrection of refractive error; 21.4% or 15 322 000 with cataract; 2.1% or 1 504 000 due to diabetic retinopathy; 1.6% or 1 146 000 due to glaucoma; 1.0% or 716 000 due to macular degeneration; 0.1% or 72 000 due to trachoma).
Discussion
From 1990 to 2010, the estimated age-standardised prevalence of blindness and MSVI in Central and South Asia had decreased significantly, although in South Asia, the absolute numbers of people who are blind or who have MSVI had increased. Much of the improvement in the blindness rate in South Asia is likely to be attributable to increased cataract surgery coverage and also the recent improvements in cataract surgical outcomes. These improvements in cataract surgical outcomes have been reported in India, Bangladesh, Pakistan and Nepal.8–17 In Central Asia, the estimated age-standardised prevalence of blindness and MSVI also decreased from 0.4% to 0.2% and from 3.0% to 1.9%, respectively. While the figures for Central Asia were slightly lower than the average global figures, the prevalence of blindness and MSVI in South Asia was about three times higher than globally (table 1). It indicates that intensified measures are needed to further reduce the prevalence and burden of blindness and MSVI in South Asia.
As in other regions, the prevalence of blindness and MSVI decreased markedly from 1990 to 2010 in both Asian regions. This may be a reflection of improvements in socioeconomic conditions, in particular, better childhood health indices and maternal care for the young as well as improvements in access to the medical system for the elderly.
As is found globally, women had a markedly higher prevalence of blindness and MSVI than men had.5 In South Asia, the increase in the number of blind women from 1990 to 2010 from 5 229 000 to 6 070 000 (841 000 or 16.1%) was four to five times greater than the increase in the number of blind men from 4 356 000 to 4 516 000 (160 000 or 3.7%) (table 2). For MSVI, these figures for the increase were 24.8% (from 31 800 000 to 39 700 000 or 7 900 000) for women and 13.9% (from 28 000 000 to 31 900 000 or 3 900 000) for men. It is in contrast with Central Asia where the situation improved more for women than for men. The decline in the number of blind women, from 1990 to 2010, from 140 000 to 92 000 (48 000 or 34.3%) was more marked than the decline in the number of blind men from 62 000 to 43 000 (19 000 or 30.6%). In a similar manner, the decline in the number of women with MSVI from 921 000 to 725 000 (196 000 or 21.3%) was greater than the decline in the number of men with MSVI from 542 000 to 453 000 (89 000 or 16.4%). The disproportionate increase in numbers in South Asia despite the decreased prevalence of blindness and MSVI is related to the large increase in the population in the total region of South and Central Asia by 45% from 1.1 billion to 1.6 billion persons. In other words, the increase was less important than the population growth. The general gender difference in the prevalence of visual impairment may be due to, among other factors, a disparity between the men and women in the access to medical services and to the general increased life expectancy of women. Future public health measures may thus be focused on providing equal opportunity for both sexes in attaining access to the medical system, especially older women.
By contrast with high-income regions in the USA/Western Europe, cataract remained the most frequent cause for blindness in Central Asia and, in particular, in South Asia. In 2010, there were 4 420 000 people blind due to cataract. It reflects the importance of further propagating cataract surgery as one of the most cost-effective methods to reduce avoidable blindness in a large group of the global population. However, greater numbers undergoing cataract surgery can result in larger numbers of eyes with iatrogenic vision loss.16–18 Vijaya et al18 reported that 7.2% of blindness could be attributed to cataract surgery in rural South India. It shows the need for further increasing volume and the quality of cataract surgery. One may also take into account that we did not examine corneal blindness or posterior capsular opacification as cause for visual impairment, but these are potential complications or consequences of cataract surgery and contributed to the 12% increase in unclassified/other cause of blindness that we reported.
The most frequent cause for MSVI, and the second most common cause for blindness was undercorrected refractive error. For the countries of South Asia, one of the most effective, cheapest and safest ways to improve vision loss would be to provide adequate glasses to correct refractive errors. This also includes the provision of reading glasses, since undercorrected presbyopia is a mostly unaddressed problem. Most healthcare projects and population-based studies usually only assess distant visual acuity.
Numbers of people blind from macular degeneration, which includes age-related and myopic macular degeneration, glaucoma and diabetic retinopathy increased by 85%, 93% and 47%, and those with MSVI by 117%, 142% and 75%, respectively. These increases were nearly double those reported for the world as a whole. The fourfold increase in the numbers of people aged over 50 years in this region (from 58 million in 1991 to 242 million in 2010) is one of the major reasons for this. The other possible contributory factor is increasing urbanisation, potentially associated with changes in life styles and behaviour. Additionally, diabetes, age-related macular degeneration, glaucoma and refractive error have been reported to have significant disparities in rural-urban prevalence.19–22 It would make it necessary to change the strongly cataract-centric eye care programmes to tackle these emerging diseases. When the poor disease detection rates (eg, more than 90% of glaucoma is undetected in India)23 are taken into account, it is apparent that eye care programmes face two challenges: the unfinished agenda on addressing visual impairment due to cataract and undercorrected refractive error, and to address the so-called emerging diseases, such as glaucoma, diabetic retinopathy and macular degeneration. Comprehensive eye health services have to be developed that are able to address the full spectrum of eye diseases. This requires appropriate policies, training, infrastructure and financing of services.
The prevalence of uncorrected refractive errors was similar during the study period, whereas cataract-related visual impairment decreased (table 4). The decrease in the prevalence of cataract-related visual impairment may have been due to an increasing urbanisation, improvement of the medical infrastructure, and changes in lifestyle and behaviour.
Proportion of moderate and severe vision impairment (MSVI; presenting visual acuity in the better eye <6/18 but ≥3/60) by cause, regions and the world, 1990 and 2010, all ages
Our study has limitations. First, a major limitation was that many country-years remained without data (in particular for Central Asia), or had only subnational data.4 Second, some data sources did not report prevalence by age so that we had to impute age-specific cause fractions.5 Third, the group macular degeneration included any macular disease including age-related macular degeneration and myopic maculopathy. Fourth, the basic studies varied in the definition of some diseases such as glaucoma. Fifth, unidentified or ‘other’ causes generally represented about 20–30% of the causes for MSVI, and approximately 20–35% of the causes of blindness. Sixth, protocols demanded that population-based studies reported only one main cause of visual impairment for each individual in order to provide the causal prevalence. When there were multiple disorders contributing to visual loss, usually only the ‘most readily curable’ or the ‘most easily preventable’ was recorded. Seventh, the basic studies were conducted in different time periods and at different locations, and there could have been a regional disparity in the estimates. The large countries such as China, India and others, could present large regional differences in prevalence and causes of visual impairment even at a given point in time. Eighth, differences in study methodology may also have been important as the results, especially causes of visual impairment from rapid assessment studies may have been different compared to classical epidemiological cross-sectional studies. Finally, the CIs overlapped for most estimates (tables 1⇑–3), though there was a definite decreasing trend in point estimates.
In conclusion, prevalence of blindness and MSVI was three times higher in South Asia than in Central Asia and globally. Women were generally more often affected than men. The major cause of blindness was cataract, while the major cause for MSVI was undercorrected refractive error. In South Asia, cataract surgery has to be further propagated although much progress has been made. Eye care systems have to be strengthened to also address other causes of blindness and MSVI, such as glaucoma and diabetic retinopathy. In Central and South Asia, the provision of glasses for adequate correction of refractive error is an economic, easy, safe and efficient measure to reduce the burden of MSVI.
Acknowledgments
Benita J O'Colmain assisted with the incorporation of microdata from several large population-based studies. The principal investigators of these and other studies are thanked for authorising unpublished study data to be used in this project. Catherine Michaud and Colin Mathers greatly assisted in the communications between the GBD Core Group and the GBD Vision Loss Expert Group. Donatella Pascolini kindly assisted in retrieval of some unpublished data sources.
References
Footnotes
-
JBJ and RG share the first authorship.
-
SR, HRT and RRAB share the senior authorship.
-
Collaborators Group information: A list of the Vision Loss Expert Group members appears at http://www.anglia.ac.uk/ruskin/en/home/microsites/veru/other_research_areas/global_burden_of_diseases.html.
-
Contributors Substantial contributions to conception and design, acquisition of data, or analysis and interpretation of data: JBJ, RG, RD, SRF, JK, JL, KN, KP, HP, LV, RAW, TYW, SR, HRT and RRAB. Drafting the article or revising it critically for important intellectual content: JBJ, RG, RRAB, SR and HRT. Final approval of the version to be published: JBJ, RG, RD, SRF, JK, JL, KN, KP, HP, LV, RAW, TYW, SR, HRT and RRAB.
-
Funding This study was partially funded by the Bill & Melinda Gates Foundation, Fight for Sight, Fred Hollows Foundation and the Brien Holden Vision Institute. The results in this paper are prepared independently of the final estimates of the Global Burden of Diseases, Injuries, and Risk Factors study. The funders had no role in study design, data collection and analysis, decision to publish, or preparation of the manuscript.
-
Competing interests None.
-
Provenance and peer review Not commissioned; externally peer reviewed.