Article Text

Abstract
Background Since there is evidence that the Fc domain of antivascular endothelial growth factor drugs may cause unexpected consequences in retinal and choroidal vessels, the effects of intravitreal ranibizumab and aflibercept on monkey eyes were investigated.
Methods Four cynomolgus monkeys were intravitreally injected with 0.5 mg of ranibizumab and another four with 2 mg of aflibercept. Two untreated monkeys served as controls. Funduscopy, fluorescein angiography (FA), spectral-domain-optical coherence tomography (SD-OCT) and measurement of intraocular pressure (IOP) were performed. The eyes were inspected by light, fluorescence and electron microscopy. The diameter of the choriocapillaris (CC) was measured by morphometry, and the areas of the CC with free haemoglobin, CC fenestrations and endothelial thickness were quantified.
Results Analysis showed ranibizumab permeated the retina via intercellular clefts, whereas aflibercept was taken up by ganglion cells, cells of the inner and outer retinal layers and the retinal pigment epithelium (RPE). Stasis and haemolysis in the choriocapillaris and choroidal vessels were more frequent after aflibercept treatment, which caused hypertrophy and death of individual RPE cells. The area of the CC was significantly reduced after both drugs compared with controls, but the reduction of the CC endothelium thickness, number of fenestrations and the areas with haemolysis were more pronounced after aflibercept.
Conclusions Ranibizumab permeated the retina through intercellular spaces, whereas aflibercept was taken up by neuronal and RPE cells. Aflibercept induced protein complex formation and more haemolysis in the choriocapillaris, leading to individual RPE cell death. The clinical significance and relation of these findings to the Fc domain or to other characteristics of aflibercept remain to be investigated.
- Drugs
- Choroid
- Neovascularisation
- Retina
Statistics from Altmetric.com
Introduction
Excessive angiogenesis is a major problem in many ocular diseases, particularly in such angioproliferative disorders as diabetic proliferative retinopathy and age-related macular degeneration (AMD) in adults, and retinopathy of prematurity in infants.
AMD is the leading cause of blindness in patients over the age of 65 years in developed countries with choroidal neovascularisation (CNV) being the main factor responsible for vision loss in AMD. It accounts for approximately 90% of AMD-related blindness1 although neovascular AMD affects only 10–15% of AMD patients. CNV is characterised by the growth of new choroidal blood vessels through Bruch's membrane into the subretinal space, followed by leakage and accumulation of serum or blood beneath the retinal pigment epithelium (RPE), leading to an insult of the outer retina and RPE and finally to vision loss.2
Although the pathogenesis of AMD is not completely understood, several growth factors have been implicated in the disease process as they induce the development of blood vessels (ie, basic fibroblast growth factor, transforming growth factor β, insulin-like growth factor-1, epidermal growth factor, interleukins and vascular endothelial growth factor (VEGF)). However, only VEGF appears to be sufficient and essential for both physiological and pathological angiogenesis.3 Oxidative stress and inflammation due to the accumulation of intracellular and extracellular waste material, including lipids in Bruch's membrane and drusen, stimulate VEGF synthesis. Indeed, an increase of VEGF in the RPE of maculae from patients with AMD4 was observed, as well as an increase of VEGF expression in the laser model of CNV in monkeys5 and rats.6 Induction of CNV was also observed after ectopically delivered VEGF cDNAs to the RPE of rats7–9 and non-human primates.10
In humans, the VEGF family consists of five related glycoproteins, VEGF-A, VEGF-B, VEGF-C, VEGF-D and placental growth factor (PlGF). VEGF-A is the most well-studied member of the VEGF family and is the major driver of pathological angiogenesis and vascular leakage in wet AMD.11 Alternative splicing results in six VEGF-A isoforms of 121, 145, 165, 183, 189 and 206 amino acids, whose solubility is dependent on heparin-binding affinity. They can all bind the VEGFR1 (Flt-1) and VEGFR2 (KDR) receptors. VEGFR1 also binds VEGF-B and PlGF. In contrast to VEGF-A, neither VEGF-B nor PlGF is essential for vasculogenesis and angiogenesis, but they have been implicated in pathological vascular remodelling.11 Growing evidence suggests that PlGF synergises with VEGF-A in promoting vascular pathology,11 whereas the function of VEGF-B is still not clear.12
Since 2004, anti-VEGF therapy has become the standard treatment for wet AMD and has revolutionised the management of this disease. Between 2004 and 2006, three anti-VEGF drugs were introduced to ophthalmology after receiving regulatory approval for the treatment of AMD (pegaptanib, ranibizumab) or being used off-label (bevacizumab).13 They exhibit important differences in their sites of activity, formulation methods, binding affinities and biological activities. Pegaptanib (Macugen, Eyetech/Pfizer) is an oligonucleotide aptamer that selectively binds to and neutralises the main pathological isoform of VEGF (VEGF-A165) by attaching to its heparin-binding domain. Ranibizumab (Lucentis, Genentech/Novartis) is an affinity-matured, humanised, monoclonal antibody fragment (Fab), whereas bevacizumab (Avastin, Genentech/Roche) is a full-length, humanised, monoclonal antibody. Both work by blocking the receptor-binding domain of all isoforms of VEGF-A.14 Aflibercept (VEGF Trap-Eye, Eylea, Regeneron/Bayer) is a new anti-VEGF agent recently approved by the Food and Drug Administration. It is a fully human, recombinant fusion protein composed of the second immunoglobulin (Ig)-binding domain of VEGFR1 and the third Ig-binding domain of VEGFR2 fused to the fragment crystallisable (Fc) region of human IgG1.15 Aflibercept binds to all VEGF-A isoforms, VEGF-B and PlGF.11
Our group has extensively described the effects of intravitreally injected bevacizumab in the eyes of monkeys.16–19 These included reductions in choriocapillaris fenestrations, photoreceptor damage, formation of immune complexes and thrombotic microangiopathy. A prevailing rationale for thrombosis after bevacizumab treatment was presented by Meyer and colleagues.20 They found that bevacizumab can induce platelet aggregation, degranulation and thrombosis through complex formation with VEGF, heparin and activation of the platelet Fc gamma RIIa receptor. Moreover, other results have demonstrated effective binding of the Fc domain of bevacizumab to human RPE and human umbilical vascular endothelial cell membranes via Fc receptors or membrane-bound VEGF, activating the complement cascade and leading to cell death.21 It is unclear whether there is a similar problem with aflibercept as it also contains the Fc domain of human IgG1. Furthermore, the IgG1 isotype is known to be very effective in the activation of the complement system through the classical pathway.22 Indeed, the Fc portion of IgG1 has a high ability to bind C1q causing subsequent activation of the classical pathway.22 In contrast, ranibizumab does not possess the Fc domain, avoiding activation of the complement cascade.
In this study, we investigated the influence of the Fc domain by comparing the effects on the retina and choroid of intravitreally injected ranibizumab versus aflibercept into monkey eyes. The monkey is the ideal model for this in vivo study since in contrast to rodents the interactions between the Fc domain and the Fc receptors mimic those present in humans.23
Methods
Animals and study protocol
Ten healthy cynomolgus monkeys (Macaca fascicularis, aged 3–8 years) were raised at the Covance Laboratories (Muenster, Germany) under standard conditions. All animals were housed and handled in strict accordance with good animal practice under supervision of veterinarians and were monitored for evidence of disease and changes in attitude, appetite or behaviour suggestive of illness. Handling and housing of the animals at Covance Laboratories GmbH was done in accordance with the German Animal Welfare Act. Moreover, all animals underwent a range of ophthalmic examinations (described in ‘Ophthalmic examinations’) during the predose phase in order to detect possible ocular disorders that would have not been related to the injection of ranibizumab or aflibercept. Ranibizumab was intravitreally injected into both eyes of four animals, and aflibercept intravitreally into both eyes of another four animals. One and seven days after intravitreal injection, the animals were sacrificed under general anaesthesia and the eyes were enucleated (four eyes from two monkeys per time point). Two untreated monkeys served as controls. For each monkey, one eye was fixed for light and electron microscopy and the other eye for immunohistochemistry. For the notice of approval by the appropriate institutional animal care and use committee, please see Covance Studies 8260977 and 8274007.
Intravitreal injection of ranibizumab and aflibercept
In total, 50 µl of ranibizumab (10 mg/mL) and of aflibercept (40 mg/mL) were intravitreally injected. The animals were sedated by intramuscular injection of medetomidine (Domitor) and ketamine hydrochloride, the eyes having previously been examined for any signs of inflammation. Pupils were dilated (Mydriasis with 1% tropicamide) and anaesthetised (proxymetacaine; Proparakain-pos 0.5%; Ursapharm). The conjunctival and corneal surface was disinfected (povidone iodine 10%). After sterile coating and insertion of a lid speculum, 0.5 mg ranibizumab or 2 mg aflibercept were injected into the vitreous cavity using a 27-gauge canula. When removing the canula, the injection site was compressed with forceps to prevent reflux and a topical antibiotic (gentamicin) was administered. Animals were monitored for signs of inflammation until sacrificed.
Ophthalmic examinations
For all ophthalmic examinations, a mydriatic agent (tropicamide) and a local ophthalmic anaesthetic (proxymetacaine) were instilled in the eyes of the sedated animals before examination.
Macroscopic and slit lamp examinations, direct/indirect ophthalmoscopy
These examinations were performed during the predose phase on the day of dosing and on the day of necropsy. The surface of the eyes was macroscopically examined. Slit lamp examination consisted of anterior and medium segments with conjunctiva, cornea, anterior chamber, iris, lens and vitreous body, as well as fluorescein instillation, for epithelial staining. Direct and indirect ophthalmoscopy consisted of ocular fundus with macula lutea, papilla, ocular vessels and retina.
Funduscopy and fluorescein angiography (FA)
Fundus photographs and FA were obtained for all animals once during the predose phase and on the day of necropsy. For FA, an indwelling catheter was inserted and fluorescein was injected intravenously. A series of pictures was made immediately after injection and 10 min thereafter. The equipment used was a digital stationary fundus camera (TRC-50 ex; Topcon, Tokyo, Japan).
Spectral-domain-optical coherence tomography (SD-OCT)
SD-OCT was obtained for all animals once during the predose phase directly after injection (only for aflibercept) and on the day of necropsy. The equipment used was Spectralis HRA+OCT (Heidelberg Engineering, Heidelberg, Germany).
Intraocular pressure (IOP)
Measurement of IOP was performed in all animals once during the predose phase, before administration of the drugs, directly and 10 min after administration and on the day of necropsy by using TonoVet (Kruuse, Langeskov Denmark). Two readings were obtained per eye for each time point, and the mean IOP value was calculated and reported in millimetres of mercury (mm Hg).
Enucleation
On days 1 and 7 after intravitreal injection, the animals were sacrificed under general anaesthesia, that is, intramuscular injection of ketamine hydrochloride followed by an intravenous sodium pentobarbitone (Lethabarb, Virbac, Australia) overdose. The eyes were enucleated 5 min postmortem, cleaned of orbital tissue and were slit carefully at the limbus without damaging the ora serrata. Then 25 μL of the fixative were carefully injected into the vitreous before the eyes were fixed at 4°C by immersion into 5% glutaraldehyde in 0.1 M cacodylate buffer (pH 7.4, Sigma, St. Louis, Missouri, USA) overnight for electron microscopy or into formalin (Carl Roth, Karlsruhe, Germany) for immunohistochemistry. The eyes of two healthy monkeys without treatment were handled in the same manner.
Immunohistochemistry
Eyes were fixed in formalin, embedded in paraffin wax, cut into 5 μm sections and deparaffinised according to standard procedures. Ranibizumab and aflibercept were detected respectively using a goat antiserum to human Fab of IgG (GAHu/Fab/7S, dilution 1:250; Nordic Immunological Laboratories, Tilburg, The Netherlands) and a goat antihuman IgG-Fc antibody (NB7446, dilution 1:200, Novus Biologicals Europe, Cambridge, UK) with a cy3-rabbit antigoat antibody as a secondary antibody (305–167–003, dilution 1:400, Jackson ImmunoResearch Europe, Suffolk, UK). The following other antibodies were used for the detections of immune reactivity: a rabbit polyclonal anticow glial acidic fibrillary protein (GFAP) antibody for astrocytes and activated Mueller cells (Z0334, dilution 1:4000, Dako, Carpinteria, California, USA), with an antirabbit IgG labelled with FITC as secondary antibody (F0511, dilution 1:100; Sigma-Aldrich, St. Louis, Missouri, USA); a mouse monoclonal antivimentin antibody for Mueller cells (M7025, dilution 1:400; Dako), with goat antimouse IgG labelled with Alexa Fluor 488 (A11001, dilution 1:400; Invitrogen-Molecular Probes, Eugene, Oregon, USA) as a secondary antibody; a rabbit anti-ionised calcium-binding adaptor molecule 1 (Iba-1) antibody for macrophages and microglia (01–1974, dilution 1:100, Wako, Neuss, Germany), with a cy3-goat antirabbit antibody (111–166–045, dilution 1:300, Jackson ImmunoResearch); a mouse antihuman hypoxia-inducible factor-1α (HIF-1α) antibody as a marker for hypoxia (610 958, dilution 1:50, BD Transduction Laboratories, Franklin Lakes, USA) with a Alexa Fluor 488-goat antimouse IgG antibody (A11001, dilution 1:400, Invitrogen-Molecular Probes). Stained sections were embedded (FluorSave; Calbiochem, La Jolla, California, USA) and inspected with a fluorescence microscope (Axioplan2; Carl Zeiss, Oberkochen, Germany).
Light and electron microscopy
Specimens were postfixed with 1% OsO4 at room temperature in 0.1 M cacodylate buffer (pH 7.4), stained with uranyl acetate and embedded in Epon after dehydration in a graded series of ethanol and propylenoxide. Semithin sections were stained with toluidine blue and examined by light microscopy (Zeiss Axioplan2 imaging, Zeiss, Jena, Germany). For electron microscopy, the sections were cut ultrathin and analysed with a Zeiss 902 A electron microscope (Zeiss, Jena, Germany). For every eye at each time point (days 1 to 7 and control), two different regions of interest were chosen. One piece of tissue was taken from the fovea, the second piece at 2 mm distance at the 3 o'clock position.
Quantification of the area occupied by the choriocapillaris and of free haemoglobin
Under the light microscope at a magnification of 600-fold, the capillaries directly facing the Bruch´s membrane were photographed in semithin sections and the quantification of the area occupied by the choriocapillaris was performed blinded as previously described.19 Briefly, 20 micrographs were consecutively photographed from each treated eye and from each untreated monkey. The photographs were taken by four independent investigators, and the quantifications were performed by two of them. For quantification of the areas, image analysis software (iTEM, Olympus Soft Imaging Solutions, Muenster, Germany) was used. The area fraction of the choriocapillaris is expressed as an area in μm2 occupied by the capillaries per μm length of Bruch's membrane.
Areas within the plasma of the choriocapillaris with free haemoglobin, which stained as blue as the red blood cells or darker were quantified in semithin sections.
Quantification of choriocapillaris endothelial cell fenestrations and measurement of endothelial thickness
The number of fenestrae was counted in 283 electron micrographs taken at a magnification of 50 000-fold for ranibizumab-treated eyes and untreated controls. In total, 457 micrographs at a magnification of 30 000 from drug-treated eyes were analysed blinded for fenestrations.
Images obtained for counting the fenestrae of the choriocapillaris were also used to investigate the thickness of its apical endothelial wall. Measurements were performed every 300–400 nm over a length of about 45 µm length (about 80 measurements per animal). Here again the photographs were taken by four independent investigators and the quantifications were performed by two of them. Vessel walls that were thicker than 70 nm were not counted since they were presumed to contain the central part of the cell with its organelles and nuclei and were not representative of fenestrated endothelium.
Statistical analysis
Statistical significance for the comparison of IOP and for the evaluation of the area of the choriocapillaris was determined by using the Dunnett's test and the JMP10.0 statistical program (SAS, Heidelberg, Germany). p<0.05 was considered statistically significant.
For the measurement of free haemoglobin and endothelial thickness in the choriocapillaris, statistical analysis was performed using the Wilcoxon test for non-parametric data sets (JMP 10.0). The null hypothesis was that controls and treated animals showed the same characteristics, for example, CC apical walls of anti-VEGF-treated animals had the same thickness as those of control animals. The alternative hypothesis was that they differ. All p values <0.05 were stated as significantly different (error probability 5%).
Results
Ophthalmic examinations
Funduscopy, FA and SD-OCT
Funduscopic (figure 1A,C), FA (figure 1B,D) and SD-OCT (figure 1E) images did not show abnormalities or blood vessel leakage in any of the eyes injected with ranibizumab (figure 1A,B) or aflibercept (figure 1C–E) at the different time points, nor in any of the control eyes.

Fundus, fluorescein angiography (FA) and spectral-domain-optical coherence tomography (SD-OCT) photographs before and after injection of ranibizumab and aflibercept. Typical fundus photographs (A) and a series of FA pictures (B) of the same left eye of a monkey before and 7 days after injection of ranibizumab are shown. Typical fundus photographs (C), a series of FA pictures (D) and SD-OCT (E) of the same right eye of a monkey before and 7 days after injection of aflibercept are shown. The time point directly after injection of aflibercept is also shown in the OCT (E). The bright structures appearing in several fundus photographs near the blood vessels are reflection artefacts.
Intraocular pressure
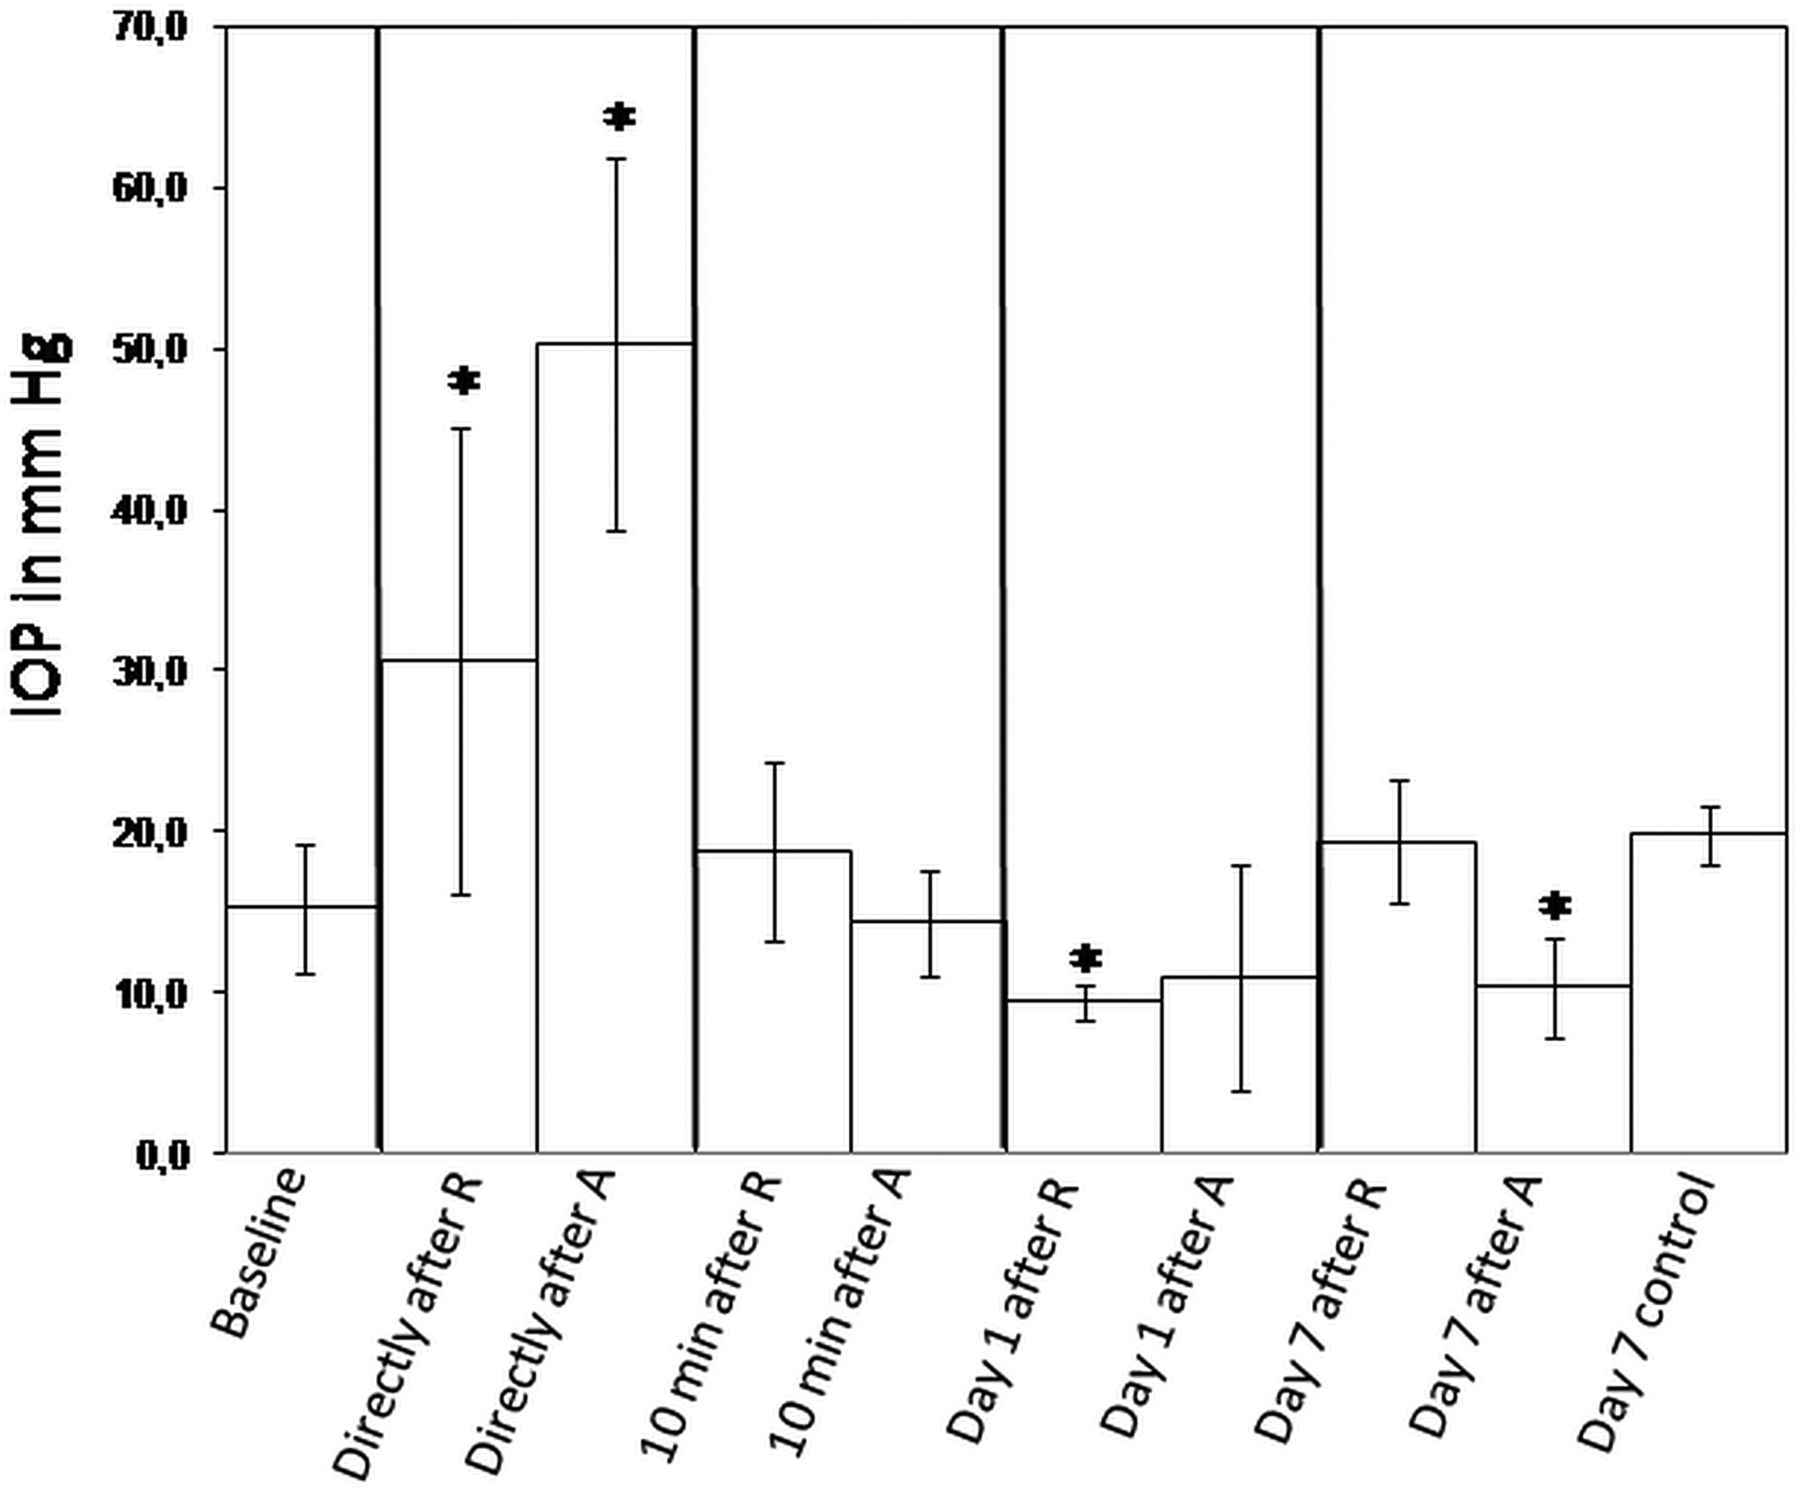
The IOP was measured in a predose phase (2 weeks before the study began), just before administration of the drugs, directly and 10 min afterwards, and 1 and 7 days afterwards (on the day of necropsy). The mean values (MV) as well as the SD were calculated (figure 2). The values obtained in the predose phase and just before the administration of the drugs were pooled since in both cases the animals were untreated. The MV±SD of the untreated animals (15.3±4 mm Hg) was compared with the MV±SD of the treated animals for each time point. The IOP increased significantly directly after administration of the drugs (30.6±14.5 after ranibizumab (R) (p=1.4E-06) and 50.3±11.5 after aflibercept (A) (p=5.7E-19)). Ten minutes after administration of the drugs, the IOP returned to baseline (18.8±5.5 after ranibizumab and 14.4±3.3 after aflibercept). One day after injection of ranibizumab, the IOP decreased significantly (9.5±1.1; p=0.007), whereas the decrease of the IOP after aflibercept's injection was not statistically significant (11±7; p=0.06). Seven days after injection of aflibercept, the IOP was significantly reduced (10.4±3.1; p=0.02) compared with the IOP of untreated animals, whereas it normalised to baseline 7 days after ranibizumab injection (19.4±3.8; p=0.06). There was no statistically significant difference between the IOP of untreated eyes 7 days after the beginning of the study (19.8±1.8) versus the IOP of untreated eyes at the beginning of the study.

Measurement of the intraocular pressure (IOP) at different time points. The IOP was measured in all monkey eyes during the predose phase (2 weeks before the study started) as well as before administration of the drugs, and the values were pooled in order to obtain the IOP baseline. The IOP was measured directly after and 10 min after injection of ranibizumab (R) and aflibercept (A) respectively in eight eyes. The IOP was also measured on day 1 in four eyes for R and A as well as on day 7 in four eyes for R and A and in two untreated control eyes. IOP mean values±SDs are presented. Asterisks indicate statistical significance compared with the baseline IOP (*p<0.05).
Immunohistochemistry
Ranibizumab and aflibercept
Retinal sections were checked for their immune reactivity against ranibizumab and aflibercept. In untreated controls, no specific staining was found in either the retina or the choroid (not shown). Just one day after injection, ranibizumab and aflibercept immune reactivity were already observed in eyes injected with ranibizumab and aflibercept respectively but with distinct distribution patterns (figure 3A,B). Ranibizumab permeated the retina via intercellular clefts (figure 3A), whereas aflibercept was taken up by ganglion cells, cells of the inner and outer retinal layers and the RPE (figure 3B). Local accumulation in retinal and choroidal vessels was observed for both drugs (figure 3A,C,D vs 3B,E,F). Ranibizumab immune reactivity was reduced after 7 days compared with day 1 (figure 3D vs 3C) while aflibercept (figure 3F vs 3E) showed no changes.

Fluorescence microscopy of the immune histochemical localisation of ranibizumab and aflibercept. One day after injection, ranibizumab (A) permeated the retina via intercellular clefts, whereas aflibercept (B) was taken up by ganglion cells (black arrowheads), cells of the inner and outer retinal layers and retinal pigment epithelium (RPE) (white arrowheads). Both drugs were localised in retinal (A,B) and in choroidal vessels (C,E). A heterogeneous staining was observed for both drugs in individual vessels. It was locally attached to the vessel walls occupying substantial parts of the vessel lumen (arrows in A–C, E). Seven days after injection, ranibizumab immune reactivity (D) in choroidal vessels was reduced compared with aflibercept immune reactivity (F). Note the strong aflibercept immune reactivity in some RPE cells (F, white arrow) and the adherence of ranibizumab (D, white arrow) to the surface of erythrocytes.
Glial acidic fibrillary protein (GFAP)
After GFAP staining in untreated controls, longitudinal astrocytes became visible and were localised in the inner retinal layers close to the ganglion cells and in the vicinity of retinal vessels (figure 4A). One and seven days after injection of ranibizumab and aflibercept, Mueller cells in the middle of the retina became positive for GFAP, indicating a mild activation of Mueller cells (figure 4B,C).

Fluorescence microscopy of retinas after staining for glial acidic fibrillary protein (GFAP) (A–C), vimentin (D–F) and Iba-1 (G–I). Images of untreated eyes are shown for GFAP, vimentin and Iba-1 stainings in A, D and G, respectively. One (B, E and H) and seven (C, F and I) days after injection of ranibizumab, retinas labelled with GFAP, vimentin and Iba-1 are shown in B–C), EF and H–I, respectively. The micrographs presented for ranibizumab treatment are also representative for the staining for GFAP, vimentin and Iba-1 observed after injection of aflibercept. Activated Mueller cells were present after treatment with both drugs 1 and 7 days after injection, whereas astrocytes and microglia cells were not affected.
Vimentin
After vimentin staining in untreated controls, Mueller cells appeared in a longitudinal orientation between inner limiting membranes (ILM) and outer limiting membranes and their end-feet formed a continuous layer facing the ILM (figure 4D). One and seven days after injection of ranibizumab and aflibercept, vimentin was overexpressed (figure 4E,F) compared with untreated eyes, confirming activation of Mueller cells.
Iba-1 and HIF1-α
Macrophages and microglia cells were not affected by ranibizumab or aflibercept. As in untreated controls (figure 4G), Iba-1-positive cells were located in the plexiform layer and the ganglion cell layer (GCL) of the neural retina. There were no significant changes throughout the observation period in the retinas (figure 4H,I).
Independent of the treatments, HIF-1α was never expressed (not shown).
Light microscopy
In semithin sections of untreated eyes (not shown) and ranibizumab-treated eyes (figure 5A), the choriocapillaris as well as choroidal vessels showed well-defined lumina and contained loosely packed erythrocytes. Individual erythrocytes can be clearly recognised when photographed at a magnification of 600-fold (figure 5A). However, ranibizumab at small foci activated thrombocytes and induced fibrin formation in deeper choroidal vessels one day after injection (figure 5A, see also figure 6A at high resolution). Seven days after injection of ranibizumab, stasis and haemolysis were occasionally observed in the choriocapillaris (figure 5B). In contrast, on 1 as well as 7 days after injection, aflibercept treatment had already caused stasis and haemolysis in most parts of the investigated choriocapillaris (figure 5C–E). The RPE was hypertrophic compared with the RPE after ranibizumab treatment (figure 5C vs 5D) or no treatment (not shown). Moreover, dark blue RPE cells were found beside normal pale blue RPE cells (figure 5B,E) and contained lysed mitochondria, indicating individual RPE cell death. However, the photoreceptors showed a normal morphology indicating that they were not affected by the treatment (figure 5D,E). There were no morphological differences observed in the RPE and choroid between foveal and extrafoveal semithin sections. Moreover, in semithin sections from all treated eyes, the lumina of the choriocapillaris were smaller compared with control eyes, as shown in the quantification below (figure 5F).
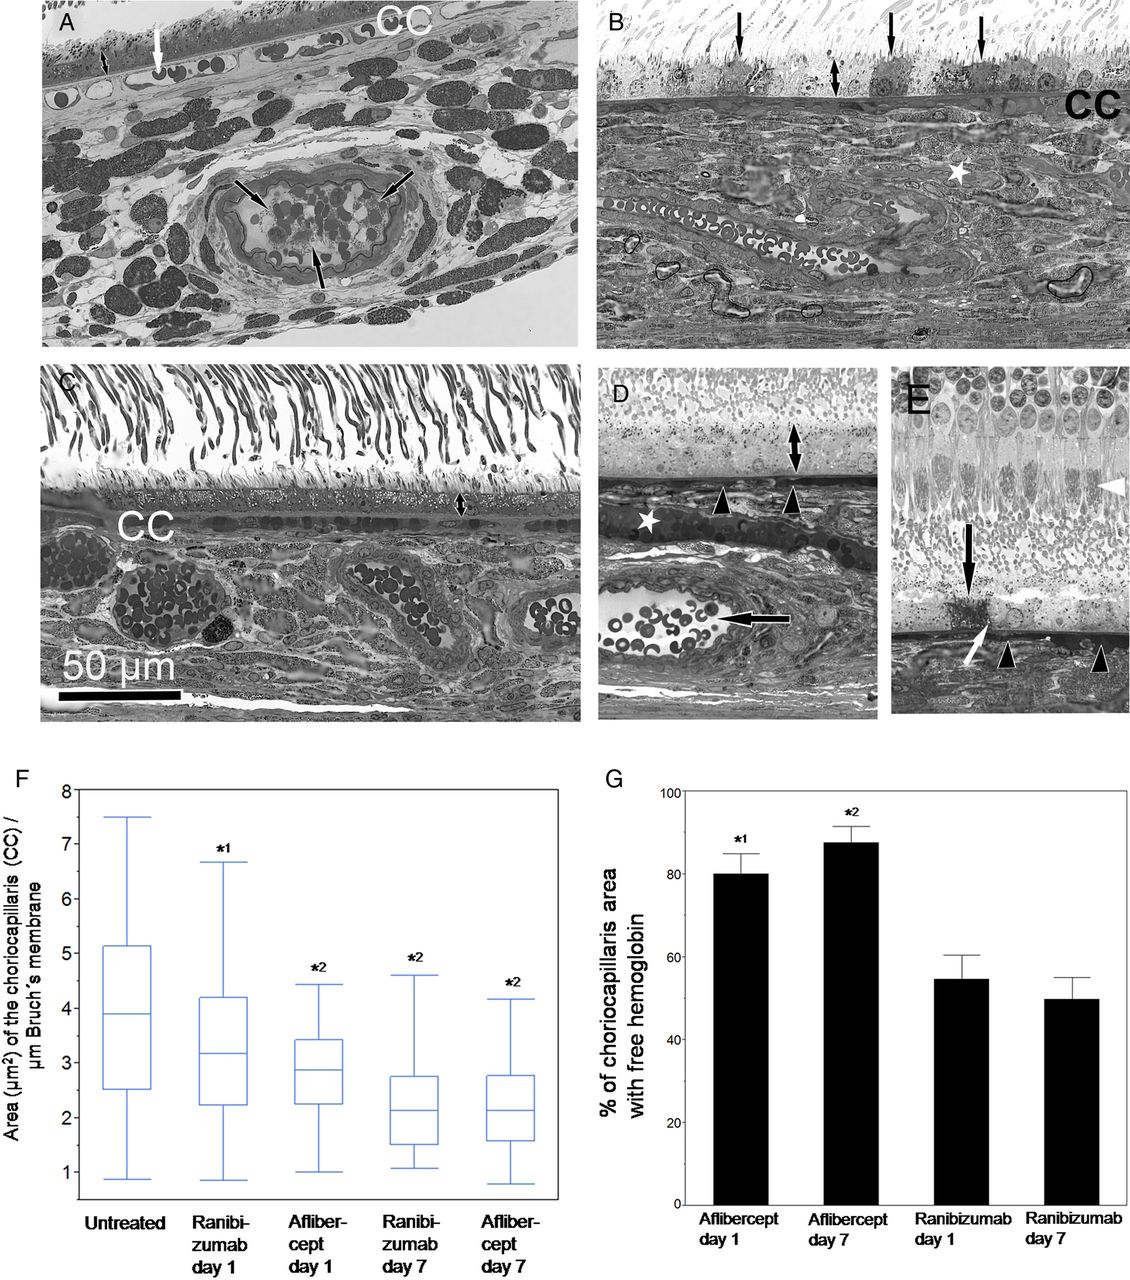
Light microscopy (A–E) and quantification of the choriocapillaris area (F) and of free haemoglobin (G) in ranibizumab and aflibercept-treated eyes 1 and 7 days after injection. (A) Light microscopy of an eye treated with ranibizumab 1 day after injection. The choriocapillaris (CC) contains loosely arranged erythrocytes (white arrow) and open vessel lumina. A deeper choroidal arteriole shows distinct erythrocytes within a wide open vessel lumen but also contact between erythrocytes and thrombocytes leading to fibrin formation (black arrows), as also shown in figure 6A,B at higher magnification. (B) Light microscopy of an eye treated with aflibercept 1 day after injection. The choriocapillaris (CC) and a deeper vessel (asterisk) were homogenously filled with blood cells. Individual dark grey-coloured retinal pigment epithelium (RPE) cells (arrows) were found next to normal pale grey RPE cells indicating RPE cell death as clearly shown in figure 6I. Hypertrophy of the RPE was also observed after aflibercept treatment (double arrow in A vs B). (C) Light microscopy of an eye treated with ranibizumab 7 days after injection. Stasis and haemolysis were occasionally observed in the choriocapillaris (CC). (D,E) Light microscopy of an eye treated with aflibercept 7 days after injection. The choriocapillaris (arrowheads in D and E) and a deeper vessel (asterisk in D) were homogenously filled with blood cells. In a deeper choroidal artery, haemolysis is absent as indicated by normal plasma density (arrow in D). Hypertrophy of RPE was observed (compare double arrow in C vs D) as well as individual dead RPE cells (arrow in E) containing swollen mitochondria (white arrow, see also figure 6I for higher magnification) facing healthy photoreceptors with well-preserved mitochondria (white arrowhead). (F) Quantification of the choriocapillaris area (in µm2) in semithin sections photographed at a magnification of 600-fold. Results are shown in a box-plot diagram. Application of Dunnett's test demonstrated that the choriocapillaris area was significantly reduced 1 and 7 days after injection of ranibizumab and aflibercept compared with the untreated controls (*1p=0.01, *2 p<0.001). (G) Quantification of the choriocapillaris area (in %) with free haemoglobin. Mean values±SDs are shown. In untreated eyes, free haemoglobin was not observed in the choriocapillaris. Application of Wilcoxon test indicated that the percentage of choriocapillaris area with free haemoglobin was significantly enhanced after aflibercept treatment compared with ranibizumab treatment on days 1 and 7 (*1p<0.0002 (day1), *2p<0.0001 (day 7)).

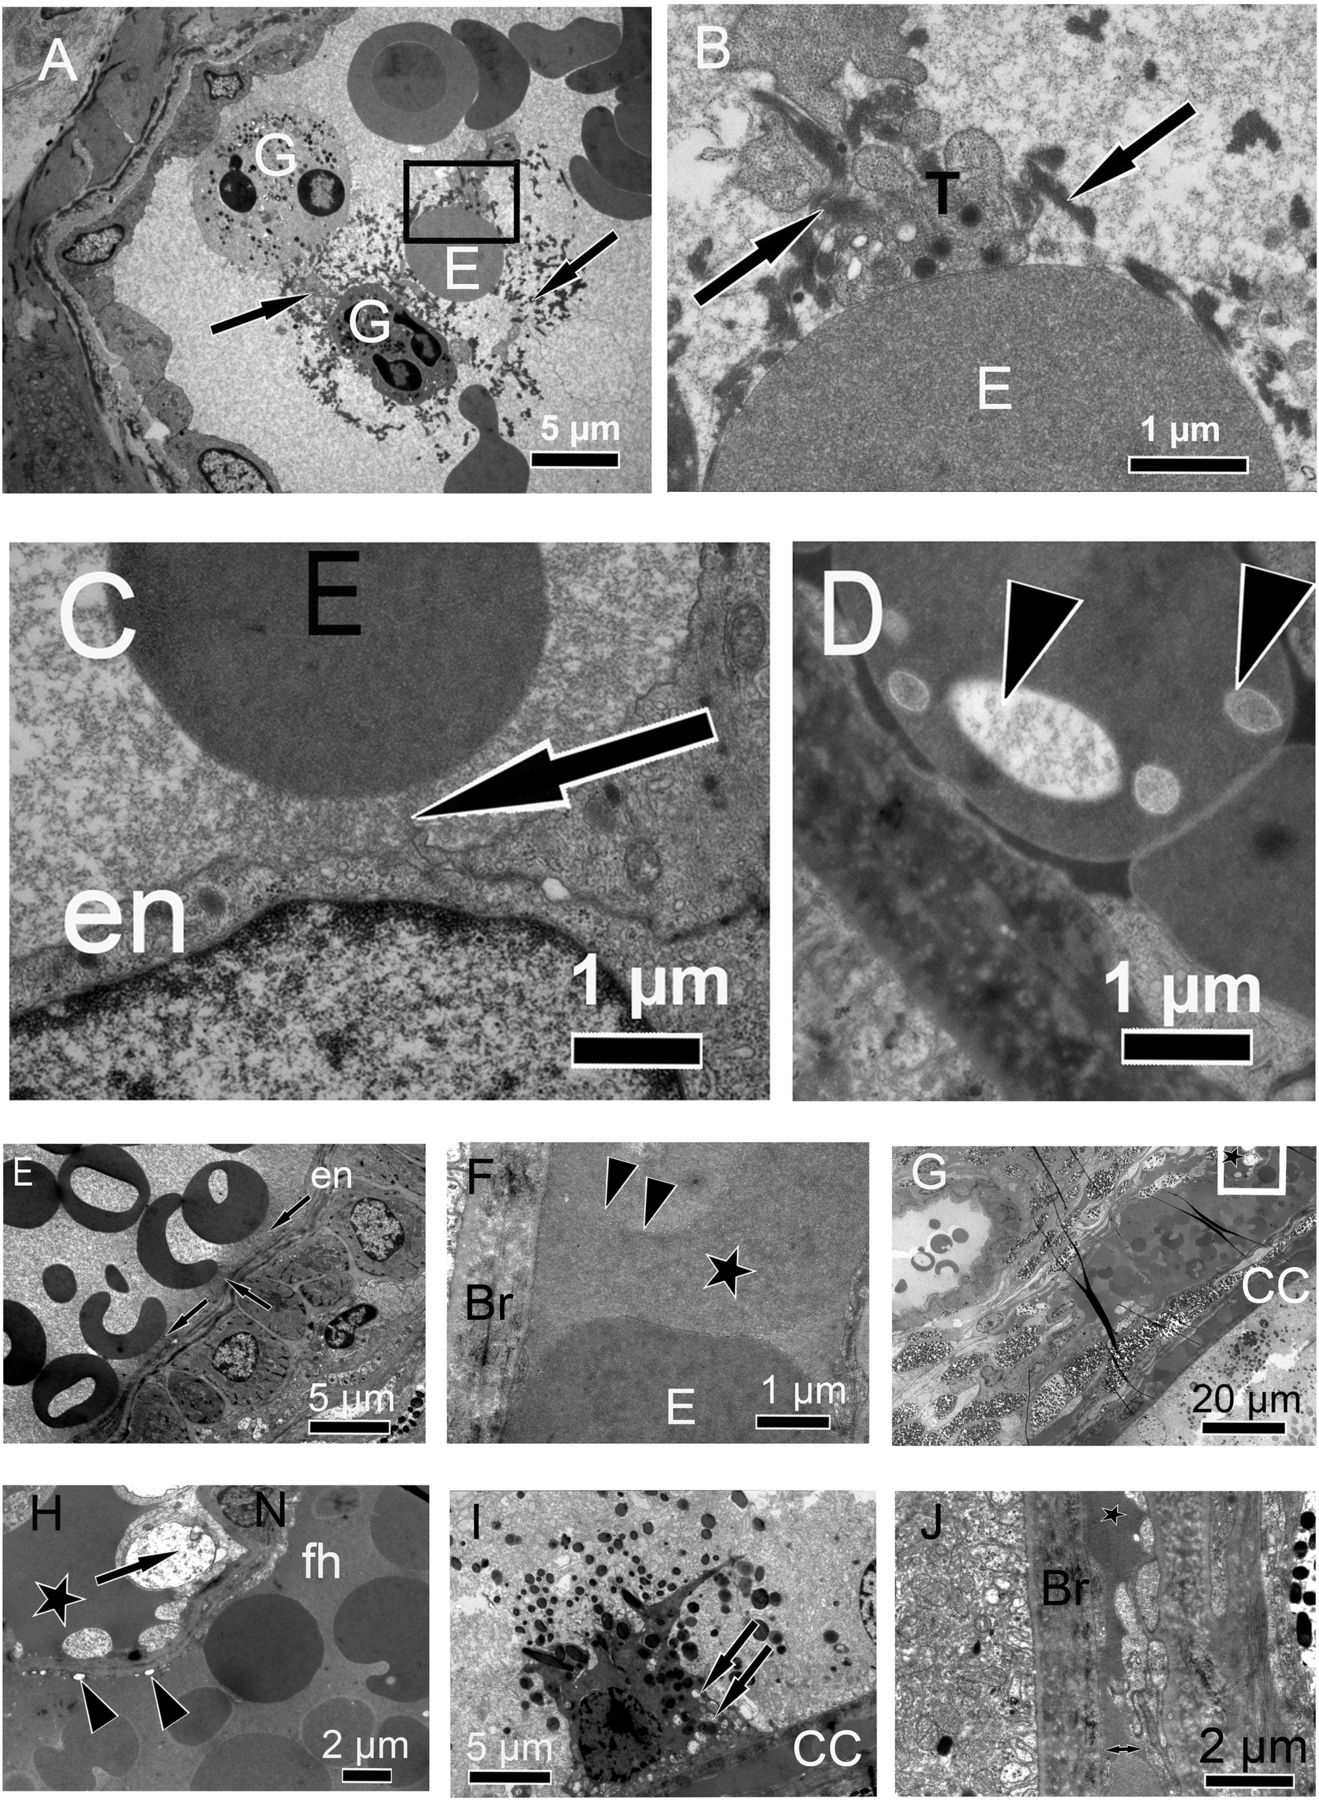
Electron micrographs of eyes injected with ranibizumab (A–D) and aflibercept (E–J). (A) One day after injection of ranibizumab, activated thrombocytes interacted with erythrocytes (E) and granulocytes (G) and were involved in the formation of fibrin (arrows). (B) is a higher magnification of the black square in (A). A clear binding between a thrombocyte (T) and an erythrocyte (E) as well as fibrin (arrows) is shown. (C) Electron-dense material (arrow) is attached to the endothelial wall of a blood vessel (en) and an erythrocyte (E). (D) Eryptosis, as indicated by many holes of different sizes (arrow heads) inside an erythrocyte, is shown. (E) After aflibercept injection, felt-like fibrous material was abundant in choroidal blood vessels. Electron-dense fibrous material is shown attached to the vessel wall between the endothelium (en) and erythrocytes or between erythrocytes (arrows). (F) Haemolysis in the choriocapillaris is visible. The upper erythrocyte is deformed and reveals unusual irregularities in electron density (asterisk) compared with the erythrocyte below (E). The cell membrane is absent to the left of the arrowheads. The Bruch's membrane (Br) is intact. (G) Stasis in the choriocapillaris (CC) is obvious; the erythrocytes are densely packed, filling the entire choriocapillaris lumen. Haemolysis is present in the CC and in a choroidal vein. Extracellular haemoglobin (asterisk) is also seen, and this particular region is shown with a higher magnification in (H). The electron-dense stripes are artificially caused by folds in the section. (H) Free haemoglobin in the plasma (asterisk) and vacuoles (arrow heads) in the endothelium are present, indicating endothelial damage. A nucleus (arrow) of a dead endothelial cell is located close to a nucleus (N) of a healthy smooth muscle cell. Free haemoglobin (fh) is also present within the venule. (I) A retinal pigment epithelium cell is filled with haemoglobin and has swollen mitochondria (arrows) representing a dead cell. (J) Microangiopathy (double arrow) characterised by an irregular and swollen endothelium can be clearly seen. Free haemoglobin (asterisk) is also present. The lumen of this choriocapillaris is collapsed. Bruch's membrane (Br) is electron-dense due to the uptake of free haemoglobin.
Quantification of the area occupied by the choriocapillaris and of free haemoglobin
The area (in µm2) occupied by the choriocapillaris per µm length of Bruch's membrane was significantly reduced in eyes treated with ranibizumab and aflibercept 1 and 7 days after injection compared with the untreated controls (figure 5F). The median of the area occupied by the choriocapillaris in the untreated eyes was 3.9 µm2, whereas it was 3.2 and 2.9 µm2 1 day after injection of ranibizumab and aflibercept and 2.1 and 2.1 µm2 7 days after injection of ranibizumab and aflibercept, respectively. Application of Dunnett's test revealed that the decrease of the choriocapillaris was significant in the eyes 1 day after ranibizumab injection (p=0.01) as well as 7 days afterwards and also 1 and 7 days after aflibercept injection (p<0.001). These findings confirmed the reduction of the choriocapillaris area 1 and 7 days after injection of both drugs.
Free haemoglobin that stained the plasma as dark or darker than the red blood cells was not observed in the plasma of the choriocapillaris of untreated monkeys. After aflibercept treatment, the part of the area with haemolytic plasma in the choriocapillaris was 80.1±4.7% after 1 day and 87.5±3.9% after 7 days. After ranibizumab treatment, the percentage part of the area with haemolytic plasma in the choriocapillaris was 54.6±5.7% after 1 day and 49.4±5.1% after 7 days. According to the Wilcoxon test, the differences between aflibercept and ranibizumab were significant with p<0.0002 and p<0.0001 1 and 7 days after injection (figure 5G).
Electron microscopy
In order to obtain more information, the eyes were inspected by electron microscopy. The fibrin formation found in deeper choroidal vessels 1 day after ranibizumab injection (figure 5A) can be clearly observed in figure 6A,B. In figure 6A, it was obvious that erythrocytes established contact with thrombocytes. With a higher magnification (figure 6B), a clear binding between an activated thrombocyte and an erythrocyte can be seen. Thrombocytes were activated as judged by their pseudopodia and formation of fibrin, identified by its ultrastructure.24 Local electron densities were detected exceptionally between an endothelial cell and an erythrocyte after ranibizumab treatment (figure 6C). Erythrocytes often had many holes (figure 6D) of different sizes or were shrinking or blebbing. This phenomenon is well known as eryptosis and was observed after both drug treatments. Filamentary material representing protein complexes was much more obvious after aflibercept treatment (figure 6E). It was never observed in blood plasma of the controls (not shown). After aflibercept treatment, stasis, swelling of erythrocytes and haemolysis were observed in most parts of the choriocapillaris (figure 6F,G) as well as in choroidal veins (figure 6G) but not in the immediate neighbouring arteries. Extravasal-free haemoglobin could be observed as well (figure 6G,H). The presence of haemoglobin was confirmed by energy-dispersive X-ray spectroscopy, which revealed a high level of iron in this electron-dense material compared with areas with normal brighter plasma (not shown). By zooming into the area of figure 6G where extracellular haemoglobin was present (figure 6H), pathological signs like vacuoles in endothelium and dead cells close to the blood vessel were observed. Haemoglobin was also detected within Bruch's membrane and the intercellular clefts of RPE cells between the basal labyrinth and the tight junctions (not shown). Individual RPE cells were completely filled with free haemoglobin (figure 6I), indicating cell death. Microangiopathy was detected as the endothelium was irregular and swollen (figure 6J). None of the above-described characteristics were found in the controls (not shown).
Quantification of choriocapillaris endothelial cell fenestrations and measurement of endothelial thickness
In untreated animals, 90.6±9.2 fenestrae were counted per 25 µm endothelial cell length (figure 7A). After ranibizumab treatment, the number of fenestration (mean value±SD) in the choriocapillaris per 25 µm endothelial cell length facing Bruch’s membrane was 34.3±1.9 1 day after injection and 23.7±2.2 after 7 days (figure 7B). After aflibercept treatment, the endothelium was incomplete (extremely thin) and the plasma membranes of the endothelial cells were not clearly recognisable (figure 7C). The number of fenestrations was reduced to 21.9±22 and 9.5±14 after 1 and 7 days respectively after aflibercept treatment.
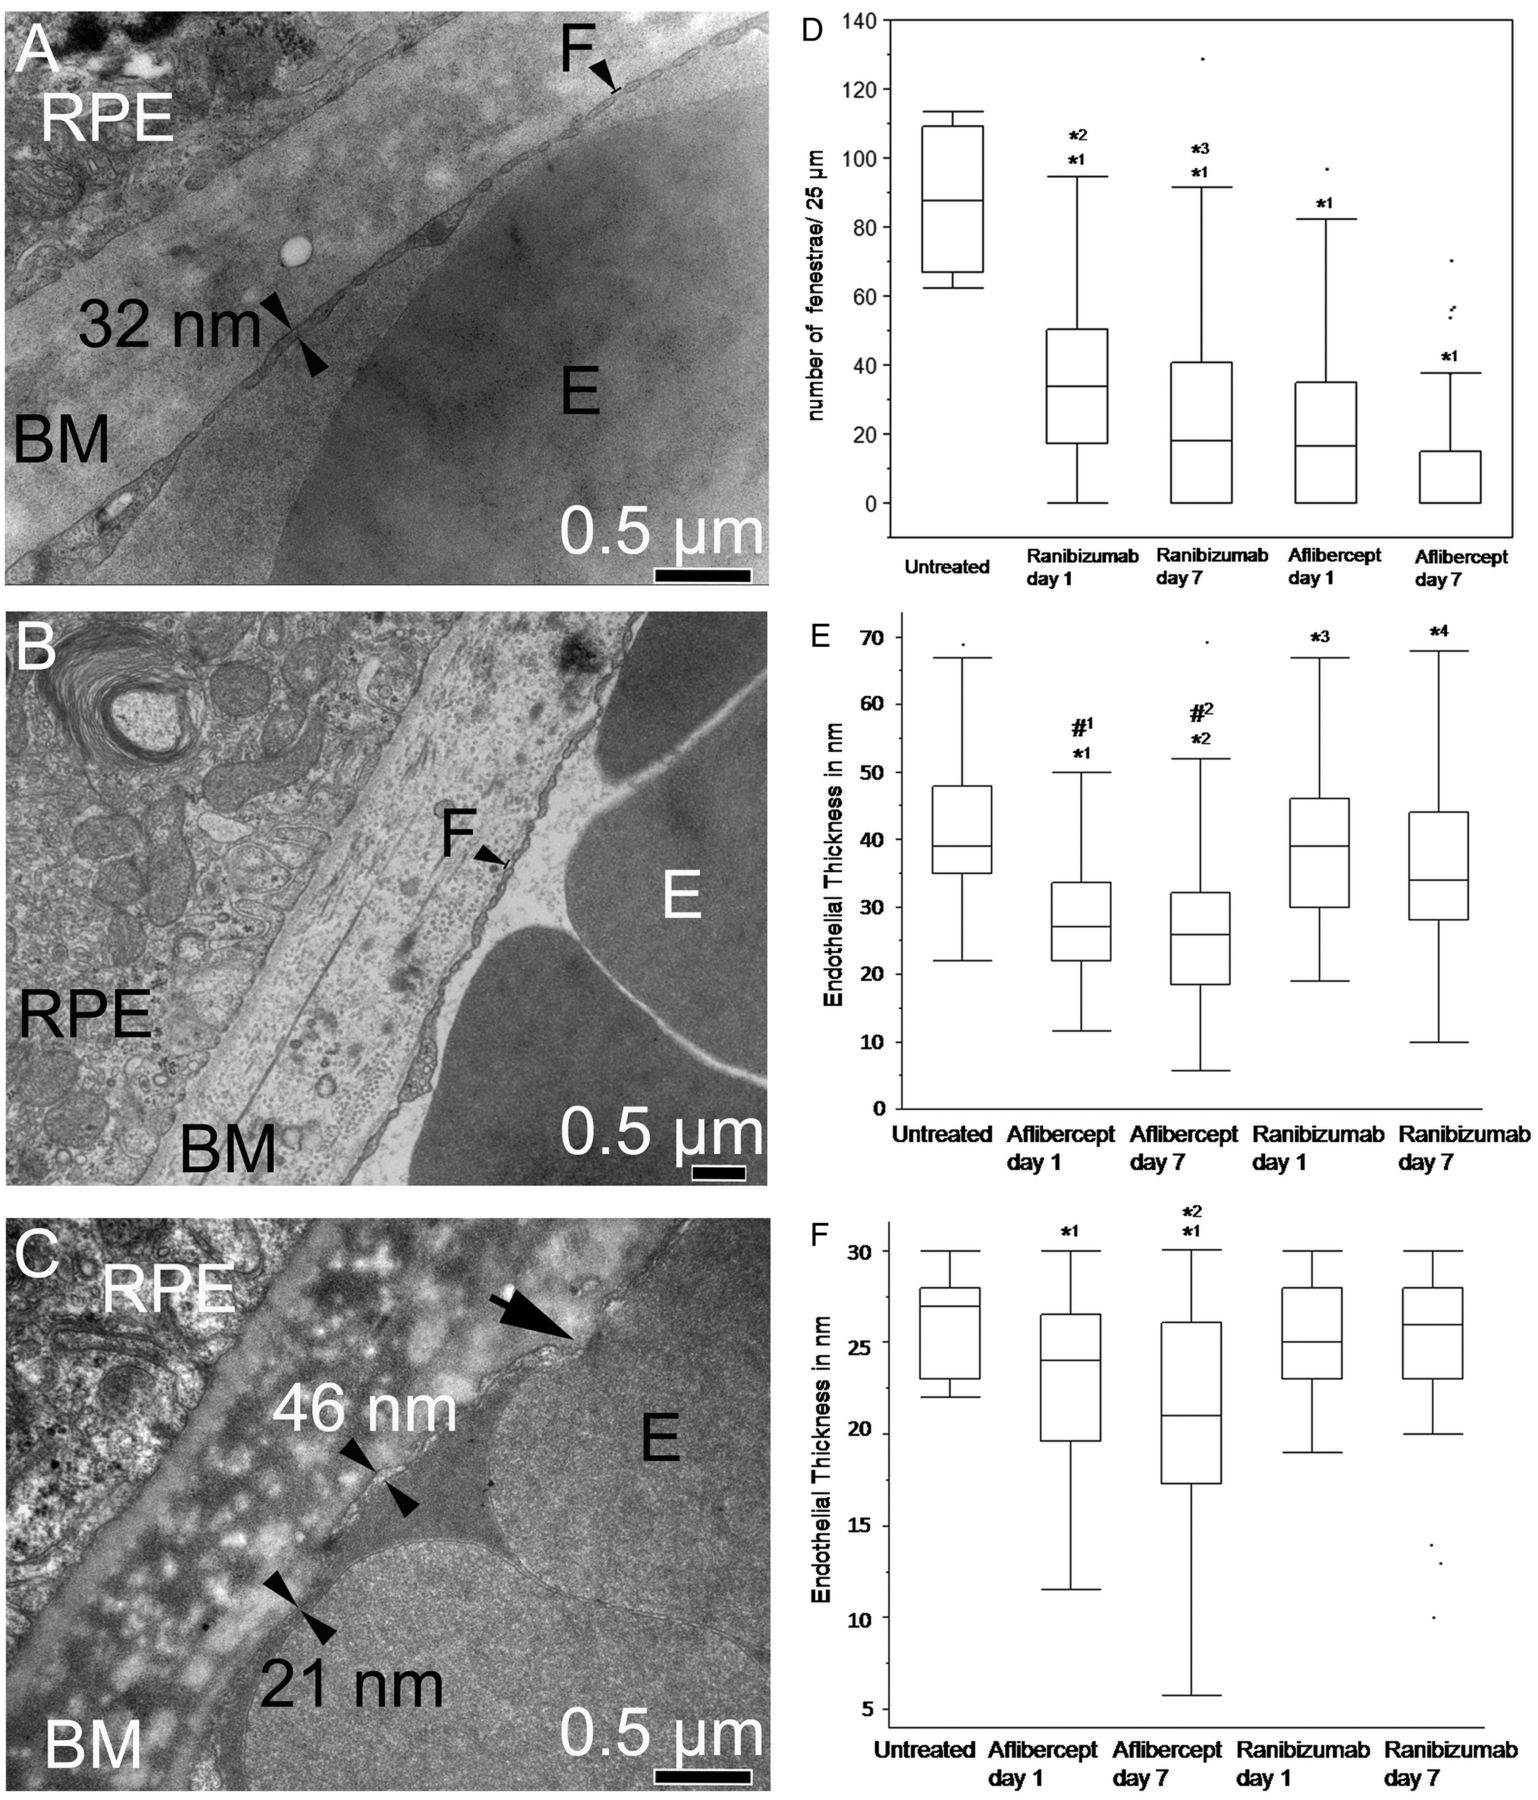
Choriocapillaris endothelial cell fenestrations and endothelial thickness. (A) Electron micrograph of a control animal shows regular and even choriocapillaris endothelium thickness with many fenestrations (F). (B) Electron micrograph of a ranibizumab-treated animal shows normal fenestrations. (C) The electron micrograph of an animal treated with aflibercept shows an extremely thin endothelium (21 nm). The black arrow shows an area where the different membranes from the red blood cell and the endothelium are not identifiable. In contrast, the membranes can be clearly recognised at the sites indicated by the double arrowheads. (D) Quantification of choriocapillaris endothelial cell fenestrations. The number of fenestrations was significantly reduced after treatments with both drugs (*1p<0.0001) compared with the controls. Moreover, after aflibercept treatment, the number of fenestrations was significantly reduced compared with ranibizumab treatment on both days (*2p<0.001 (day 1), *3p<0.001 (day 7)). (E) Measurement of the choriocapillaris wall thickness up to 70 nm. All treated animals show thinner choriocapillaris walls compared with controls (*1p<0.0001, *2p<0.0001, *3p=0.03, *4p<0.0001,). Moreover, aflibercept-treated animals also show a significant reduction of the choriocapillaris walls compared with ranibizumab-treated animals (#1p<0.0001, #2p<0.0001). (F) Measurement of the choriocapillaris wall thickness up to 30 nm. While control and ranibizumab-treated animals show similar wall thicknesses, aflibercept-treated animals on days 1 and 7 show severe thinning compared with the control (*1p<0.04). The endothelial thickness was also significantly reduced after aflibercept treatment on day 7 compared with day 1 (*2p=0.02).
According to the Wilcoxon test, the number of fenestrae was significantly reduced after treatments with both drugs (p<0.0001) compared with the controls (figure 7D). The reduction of fenestration was significantly more prominent after aflibercept treatment compared with ranibizumab on both days (p<0.0001).
The mean thickness and SD of the endothelial wall in the control was found to be 41.4±10 nm (median 39 nm), whereas it was 38.3±11 nm (median 39 nm) and 36.5±12 nm (median 34 nm) 1 and 7 days after ranibizumab injection and 28.4±9 nm (median 27 nm) and 27±11 nm (median 26 nm) 1 and 7 days after aflibercept treatment (figure 7A–C). All treated animals showed significantly decreased vessel wall thicknesses as compared with the control (figure 7E). Aflibercept-treated animals showed even thinner walls than ranibizumab-treated animals (p<0.0001).
The vessel thickness that was thinner than 30 nm was investigated separately. Figure 7F shows that controls and animals treated with ranibizumab for 1 or 7 days showed similar thicknesses of 25–26 nm in the mean, while aflibercept-treated animals showed significantly reduced CC thicknesses of 21–23 nm in the mean (p<0.04). Moreover, the endothelia of aflibercept-treated animals on day 7 were thinner than those of aflibercept on day 1 (p=0.02).
Discussion
A dramatic elevation of the IOP was observed directly after the intravitreal injection of the drugs, but it returned to normal values (between 10 and 20 mm Hg) within 10 min (figure 2). Immediate short-term elevations of the IOP after such injections are a known phenomenon.25 The main reason for IOP elevation is the sudden addition of fluid to the relatively small volume of the vitreous cavity. Such elevations are usually transient. On days 1 (for ranibizumab) and 7 (for aflibercept) after administration of the drugs, the IOP declined significantly compared with the IOP of untreated animals. However, these reduced IOP values were still normal and they were probably due to both the normal diurnal IOP fluctuation under the influence of repeated anaesthesia induced by intramuscular ketamine, which is known to produce significant IOP declines.26
Ophthalmological examinations, including funduscopy, FA and SD-OCT, did not show any pathological effects of drug treatments (figure 1). FA and SD-OCT are non-invasive techniques that permit the in vivo follow-up but present limitations in sensitivity regarding the morphological details compared with histology and particularly electron microscopy. Indeed, only histology with glutaraldehyde-fixed tissues in combination with thin sectioning permitted the detection of all the effects of intravitreally injected ranibizumab and aflibercept on the retina and choroid described in this study and may explain why this kind of ‘early’ alteration representing the first events of geographic atrophy was never observed in patients. We demonstrated that ranibizumab permeated the retina through intercellular spaces, whereas aflibercept was taken up by neuronal and RPE cells, which contrasts with the belief that aflibercept diffuses through the eye without being metabolised.3 Aflibercept also induced hypertrophy of the RPE and individual RPE cell death, protein complex formation and more haemolysis, whereas eryptosis was observed after treatment with both drugs (table 1).
Summary of the key effects observed in monkey eyes after intravitreal injection of ranibizumab and aflibercept
The finding that aflibercept-induced protein complex formation is not surprising since it was already found in a high concentration in individual ocular blood vessels 1 day after injection (figure 3E). In the blood vessels, aflibercept can bind to endothelial cells with the endothelial Fc receptor as discussed in the scenario shown in figure 8.
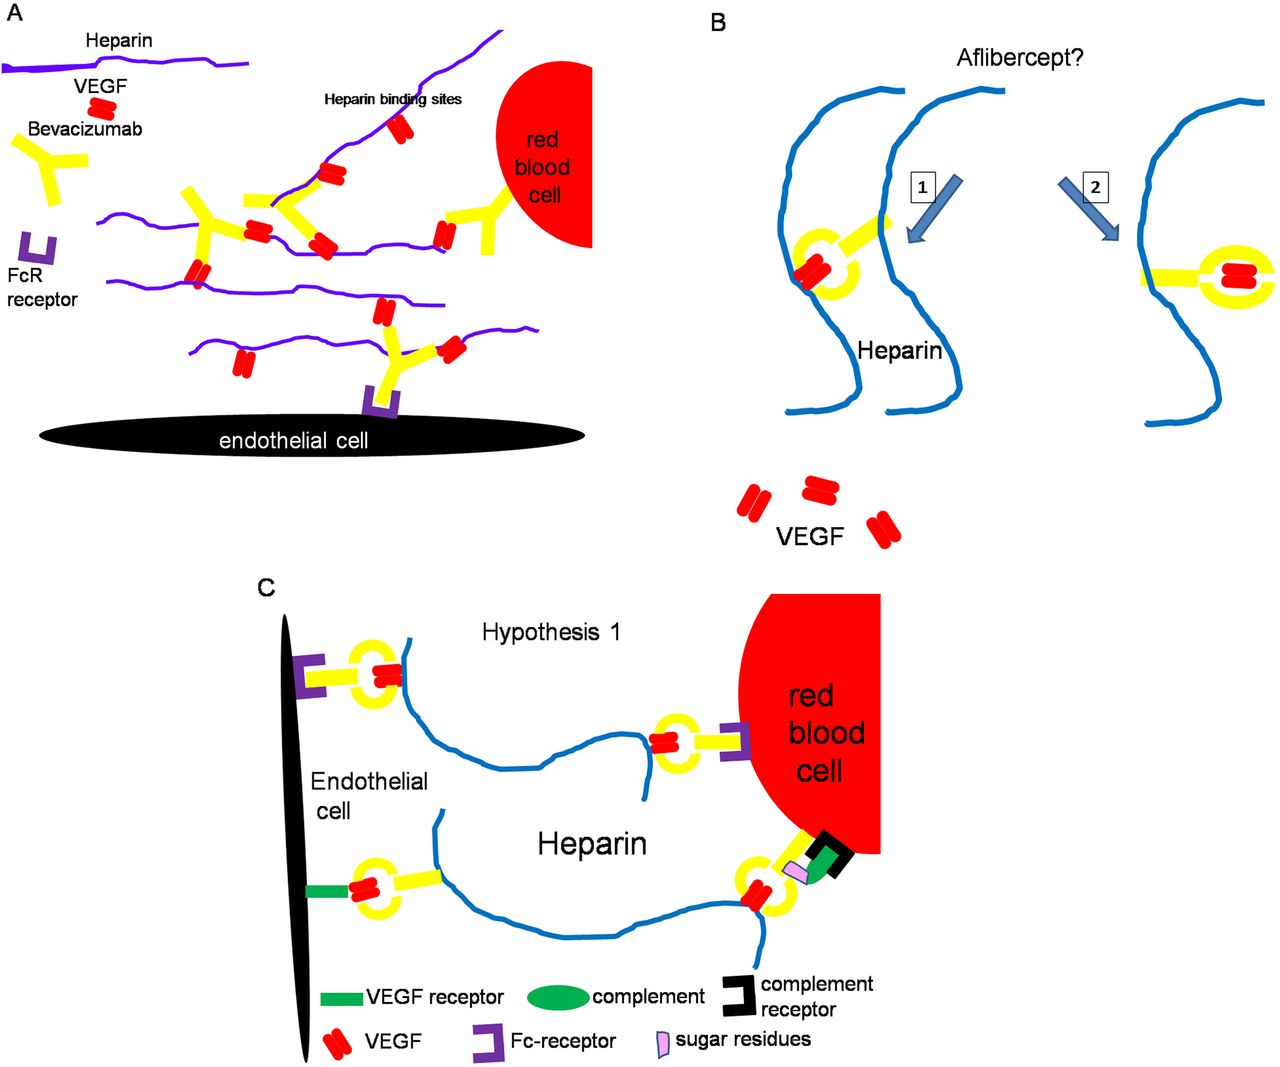
Diagrams depicting proposed mechanisms for formation of protein complexes. (A) Bevacizumab was recently shown to form immune complexes with vascular endothelial growth factor (VEGF) and heparin via the Fcγ receptor and to bind also to endothelial and red blood cells. (B) In the case of aflibercept, it is unclear whether a part of the VEGF dimer is still accessible (hypothesis 1) or whether the VEGF dimer is completely sequestrated inside the VEGF trap (hypothesis 2). The second hypothesis does not account for the formation of protein complexes between endothelial and red blood cells. (C) The first hypothesis permits an explanation of the formation of protein complexes at the interface of red blood cells and endothelial cells involving heparin, VEGF and Fc receptors. VEGF-bound aflibercept can, on the one hand, bind to endothelial cells via interactions between the Fc fragment of aflibercept and the Fc receptor (FcR) present on the surface of endothelial cells, and. on the other hand, through interaction between VEGF and VEGF receptors on the surface of endothelial cells. Moreover, heparin, which binds VEGF and Fc fragments from the endothelial side, can also bind other VEGF from VEGF-bound aflibercept that are attached to the surface of red blood cells, for example, via Fc–FcR interactions42 and/or via binding between complement and complement receptors.43 According to hypothesis 2, heparin can only bind to the Fc fragment of aflibercept as no VEGF is accessible.
A direct comparison and quantification of the immune reactivity were not possible as distinct antibodies were used for the detection of ranibizumab and aflibercept. The high concentration of both drugs in individual retinal and choroidal vessels can be easily explained by the fact that 50% of intravitreally injected ranibizumab reached the circulation after 2 days27 and that the half-life of unbound aflibercept is 1–3 days in the blood, whereas VEGF-bound aflibercept has a half-life of 18 days.3 Moreover, the VEGF concentration in the choriocapillaris must be high in order to maintain the fenestrations. Thus, it is likely that a high concentration of aflibercept as well as ranibizumab and VEGF could coincide in the choriocapillaris in the first days after injection. In previous monkey studies investigating the effect of intravitreally injected bevacizumab,18 ,19 protein complexes were also found that were more frequent (figures 5D,E in ref. 18) than after aflibercept treatment (figure 6D). After ranibizumab, only local densities were occasionally observed (figure 6C). The differences between the three drugs can perhaps be explained in part through the fact that one molecule of bevacizumab can simultaneously bind two VEGF dimers, whereas two ranibizumab molecules can bind one VEGF dimer, and aflibercept can bind VEGF-A and placental growth factor dimers in a 1-to-1 ratio.3 In the case of bevacizumab, the formation of protein complexes was investigated in vivo and in vitro20 ,28 and it was shown that they can result from the binding between VEGF, bevacizumab and heparin (figure 8A). In vitro, the same constellation with ranibizumab instead of bevacizumab did not induce formation of protein complexes.28 Regarding aflibercept, it is unclear whether the VEGF dimer is completely inside the trap or whether a part of the VEGF dimer is still accessible (figure 8B). If a part of the VEGF dimer is still accessible, heparin can be bound by VEGF via its heparin-binding sites as well as by the Fc fragment of aflibercept29 leading to protein complex formation. A hypothetical scenario of protein interaction with anti-VEGF drugs is shown in figure 8A–C.
Strong haemolysis in the choriocapillaris and in deeper choroidal vessels as well as the presence of extracellular haemoglobin known to be toxic30 were other important aspects in which aflibercept differs from ranibizumab and the controls. Ranibizumab-treated eyes showed weaker haemolysis. Aflibercept, like bevacizumab, is produced in Chinese hamster ovary (CHO) cells and therefore contains sugar residues in contrast to ranibizumab, which is produced in Escherichia coli. Thus, it is possible that the Fc domain and sugar residues31 ,32 of aflibercept (and on bevacizumab21) facilitate interference of the VEGF trap with the physiological metabolism or functioning of cells and can result in complement-mediated red blood cell death.
The results of our quantitative analysis of the area occupied by the choriocapillaris show that a single injection of aflibercept as well as ranibizumab induces a measurable reduction in choriocapillaris density. A reduction of the lumina of the choriocapillaris was also found after bevacizumab treatment.19 This finding is not surprising since VEGF plays a crucial role in the maintenance of the choriocapillaris.33 The choriocapillaris has been shown to be very vulnerable to VEGF inhibition. Indeed, decreased fenestrations and vessel occlusion were observed after one intravitreal injection of anti-VEGF (bevacizumab) in primate eyes17 and in this study after one injection of both drugs, but was particularly prominent after aflibercept treatment. Therefore, it is questionable as to what extent the chronic use of anti-VEGF therapies in the eye may influence the integrity of the choriocapillaris, particularly in the case of aflibercept, which has a higher binding affinity for VEGF-A isoforms in addition to its ability to bind VEGF-B and PlGF.
Besides, it was suggested that decreasing choriocapillaris membrane thickness is responsible for a lower count of fenestrations in anti-VEGF-treated animals. Measurement of the endothelial wall thicknesses of control and anti-VEGF-treated animals yielded a significant decrease in the treated animals compared with the control. This difference was even more obvious when focusing on the areas that were thinner than 30 nm. Here, the aflibercept-treated animals showed distinct thinning compared with all other samples, with aflibercept day 7 reaching a mean value of 21±6 nm. This implies that the two lipid layers of the membrane (each about 10 nm thick) contained no cytoplasmic lumen in these areas (figure 7C). Severe thinning of the apical endothelium is supposed to be the reason for the problems in counting the fenestration in these animals (figure 7C).
Here we show for the first time that both drugs interact particularly with red blood cells of the choriocapillaris. Eryptosis, the suicidal death of erythrocytes, is a well-known phenomenon and characterised by erythrocytes shrinkage, blebbing and phospholipid scrambling of the cell membrane.34 It can be induced experimentally by IgG antibodies.35 The milder form of red blood cell damage was observed after both drug treatments, whereas swelling and death of red blood cells indicated by haemolysis and free extravasal haemoglobin were more predominant after aflibercept treatment. We were surprised to detect so much extravasal haemoglobin, which was at the same level as after bevacizumab treatment.17 Free haemoglobin is toxic30 and may have induced the alterations in RPE and endothelial cells. It is likely that the protein-coated and affected erythrocytes were lysed particularly within the choriocapillaris because they were exposed to additional shear stress at this site. Although our results suggest impairment of blood flow in choroidal vessels, we observed healthy photoreceptors, indicated by mitochondria with a well-preserved structure, facing dead RPE cells (figure 5E). It is well known that photoreceptors can perform anaerobic metabolism,36–40 thus they can survive hypoxic conditions. The retina probably can tolerate slight hypoxic conditions better than being separated from the RPE by subretinal oedema41 or stressed by intraretinal fluid. Thus, a reduction of blood flow will reduce leakage and reduction of leakage will reduce intraretinal and subretinal oedema formation. The retina can reattach to the RPE or lose intraretinal fluid, and this event improves the function of the retina and subsequently the visual acuity. The disappearance of oedema observed after anti-VEGF therapy is indeed a key event in the improvement of vision.
To summarise, ranibizumab and aflibercept reduced the lumen of the choriocapillaris in the same manner. Haemolysis and microangiopathy were more pronounced after aflibercept treatment, whereas formation of protein complexes as well as RPE hypertrophy, and cell death, which represents the first event of geographic atrophy, was only observed after aflibercept treatment. From a theoretical point of view, it is not an advantage that aflibercept has an Fc fragment because it may cause unpredictable reactions with other molecules and cells. The clinical significance and relation of these findings to the Fc domain or to other characteristics of aflibercept remain to be investigated.
Acknowledgments
The authors thank Sigrid Schultheiss for excellent technical assistance.
References
Footnotes
-
Correction notice This article has been corrected since it was published Online First. In Table 1, the ‘Reduction of CC endothelial cell fenestrations’ row, ‘Aflibercept’ column, this has been amended to ‘Yes’.
-
Contributors No contributors.
-
Funding This study was supported by a research grant from Novartis Pharma GmbH.
-
Competing interests The study was supported by Novartis Pharma AG.
-
Provenance and peer review Not commissioned; externally peer reviewed.