Article Text

Abstract
In recent years, ophthalmology has experienced significant developments with respect to imaging modalities. Optical coherence tomography angiography is one such technology that seeks to improve diagnostics for retinal diseases. Using standard structural ocular coherence tomography hardware, optical coherence tomography angiography demonstrates the ability to non-invasively visualise the vasculature in the retina and the choroid with high resolution, allowing greater insight into retinal vascular pathologies. In addition, retinal and choroidal vessel density and blood flow can be quantified, offering potential to assist in the diagnosis of a variety of retinal diseases. To date, numerous retinal diseases, such as open-angle glaucoma, have been found to possess a vascular component. Specifically, ischaemia of the optic nerve head and lamina cribrosa has been theorised as a causative factor in ganglion cell death; however, confirmation of this mechanism has been prohibited by the limitations of currently existing imaging modalities. Optical coherence tomography angiography provides clear imaging of these regions and the possibility to elucidate further understanding of vascular factors that contribute to glaucoma development and progression. Furthermore, this imaging modality may provide insight to neural pathologies with vascular components such as Alzheimer's disease. Herein, the authors discuss the theory of operation for optical coherence tomography angiography and the current findings from pilot studies with a focus on open-angle glaucoma. In addition, speculation is offered for future applications of the technology to study other diseases with microvascular contributions.
- Glaucoma
- Imaging
- Optic Nerve
- Diagnostic tests/Investigation
Statistics from Altmetric.com
Introduction
Evaluation of retinal pathology in vivo has made great improvements as the advancement of imaging modalities has allowed for the quantification of various tissues. Optical coherence tomography (OCT) was developed in the early 1990s and has been used both in research and in clinical practice to image retinal structures such as the retinal nerve fibre layer (RNFL), macula and optic nerve head (ONH). Specifically, retinal structural deficits associated with the development and progression of open-angle glaucoma (OAG) have been identified. For example, Hoh et al1 found that in patients with OAG, OCT showed RNFL and macula thinning with disease progression. However, one limitation of OCT is that it does not provide information pertaining to retinal blood flow. As the aetiology of OAG has expanded to include multiple influences, it is now widely accepted that vascular factors play a role in the risk of development and progression of the disease.2–6 Currently, other imaging modalities are used to illustrate retinal capillary beds, such as confocal scanning laser Doppler flowmetry (Heidelberg retinal flowmetry (HRF), Heidelberg Engineering, Heidelberg, Germany), which measures the amount of a vascular tissue and blood flow within the peripapillary retinal capillary beds.7 In addition, fluorescein angiography (FA) is used to visualise the superficial retinal vascular beds and extravasation of vascular fluid secondary to retinal pathology. Other forms of OCT exist, such as Doppler OCT, which assesses the retinal branch vessels for blood velocity and volumetric flow rate.8 These imaging techniques, however, have found limitation in their ability to confirm pathological vascular mechanisms in the ONH and lamina cribrosa that could be involved in the development and progression of OAG. OCT angiography (OCT-A) is a retinal vascular imaging technology that uses a novel algorithm to generate high-resolution images and quantify vessel density and blood flow of the retina and choroid. Vessel density changes in OAG, which account for significant blindness globally,9 have been demonstrated with OCT-A. In this review, the authors discuss the OCT-A technology and current OAG findings. In addition, the authors offer speculation on further applications of OCT-A to investigate retinal vascular abnormalities associated with neurodegenerative diseases such as Alzheimer's disease (AD).
Technology overview: function, advantages and disadvantages
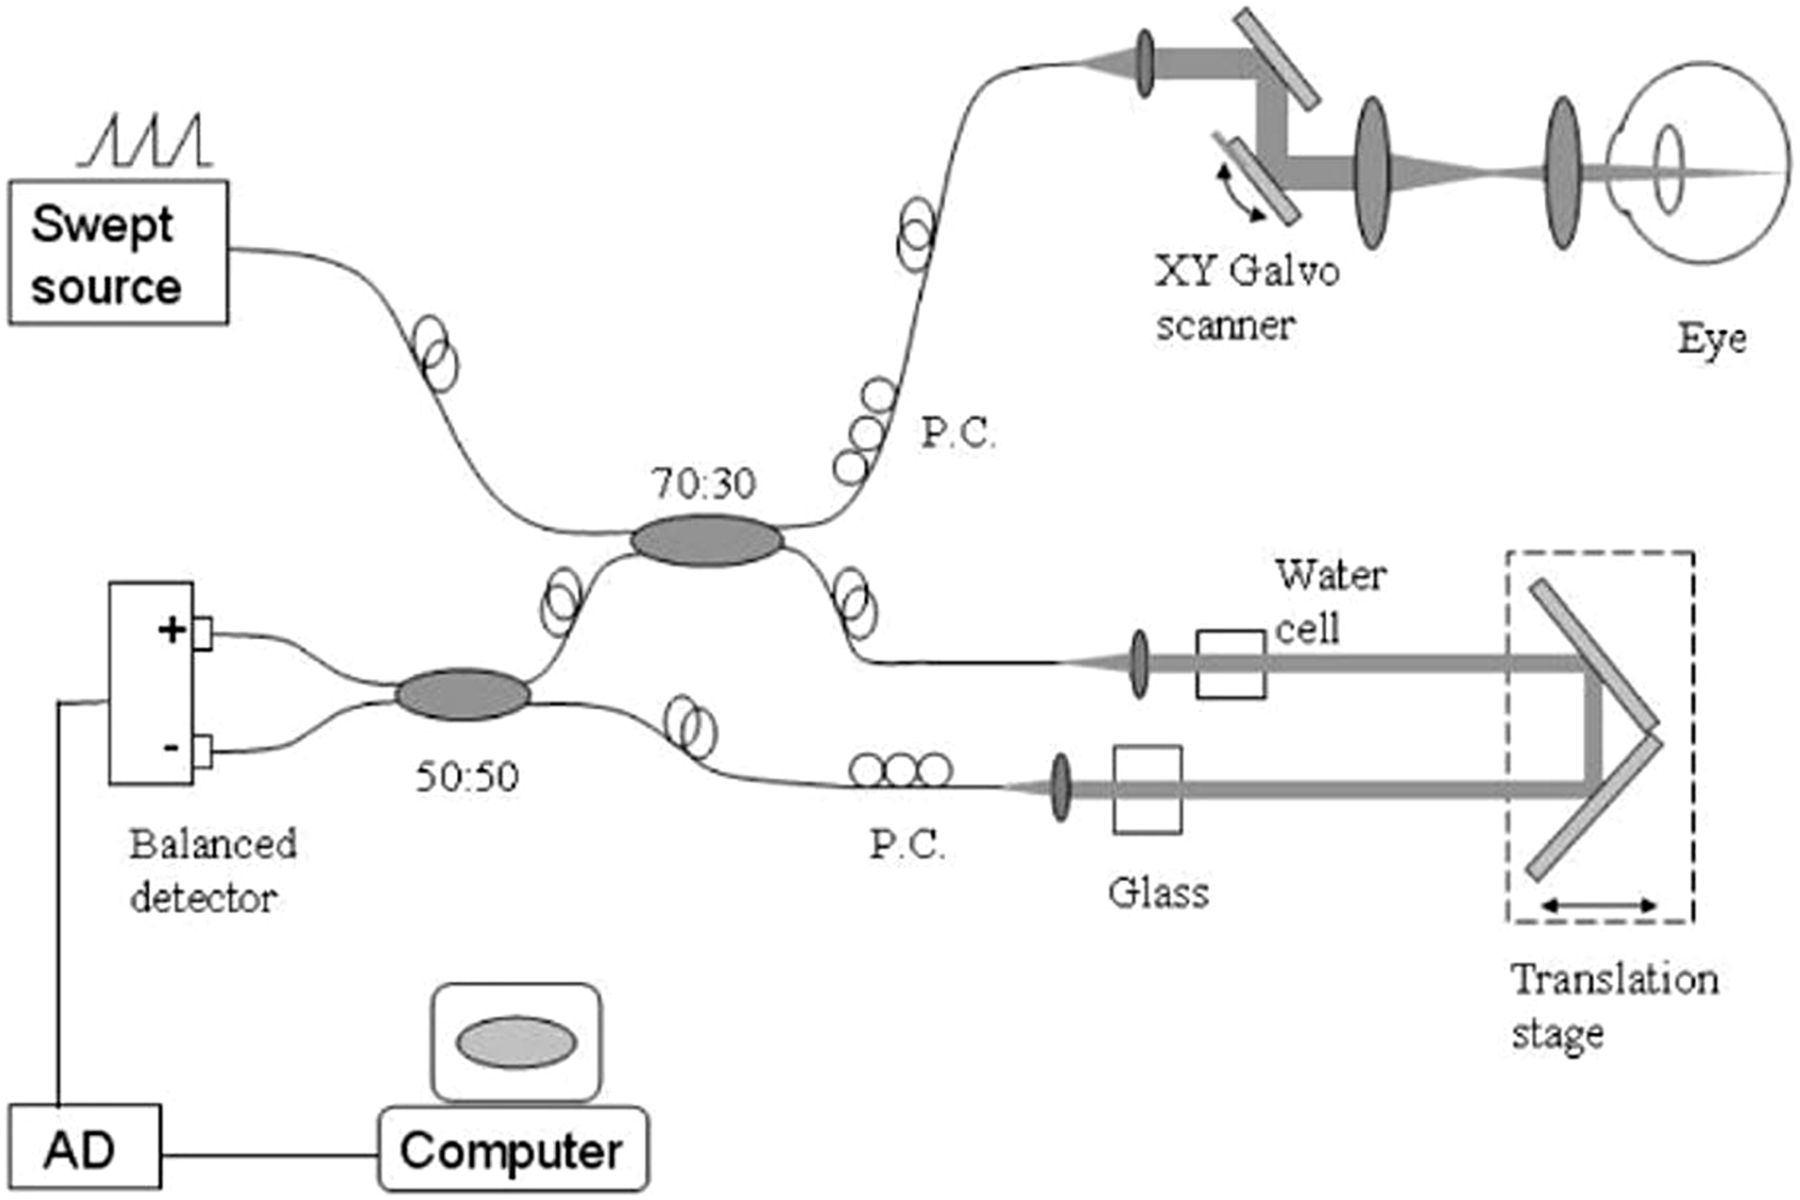
OCT-A uses laser light to produce a clear image of the retinal and choroidal microvasculature. An overview schematic of the system's operation is depicted in figure 1.

Overall schematic of the optical coherence tomography angiography system.10 Adapted with permission.
The device incorporates an infrared laser that shines on the posterior retina and is reflected by the tissue. The reflected light is detected by the instrument and, once converted from an analogue to digital signal, is processed by the system's computer.10 During a scan of an individual's retina, individual scans of layers of the retina are collected, which are known as A-scans. A-scans are compiled into a B-scan, which is used to analyse both cross-sectional structural information and blood flow information. The data collected from the reflected light are usually used to assess structural aspects of the ONH, such as RNFL and macula thickness. However, in OCT-A, an additional algorithm is applied to calculate blood flow. The algorithm discussed here is known as the split-spectrum amplitude decorrelation angiography (SSADA) algorithm. This algorithm, which calculates the decorrelation in the reflected light, is shown in equation 1.10
Equation 1: The SSADA algorithm calculates the decorrelation in reflected light at consecutive points, allowing for the vasculature to be visualised.10
The SSADA algorithm considers the fluctuation in the amplitude (A) of the reflected light between the consecutive B-scans at each spatial location within the collected data. The static tissue would have a low decorrelation value, meaning that the amplitude of reflected light does not fluctuate between B-scans. Therefore, blood flow is represented by a high decorrelation value, specifically over a threshold of D=0.125.10 A crucial advantage of the SSADA algorithm is maximising the signal-to-noise ratio (SNR). This is achieved via two methods: considering the number of B-scans (N) and the number of bandwidth segmentations (M). While the full scan is relatively short at about 3 s, saccadic movements of the eye can cause a low SNR. Therefore, averaging the decorrelation across the number of B-scans increases the SNR. In addition, the equation averages the decorrelation value across M number of bandwidth segmentations.10 This process is depicted in figure 2.

Process of bandwidth segmentation, used by the split-spectrum amplitude decorrelation angiography algorithm to increase the signal-to-noise ratio. The bandwidth was segmented into four sections to maintain appropriate image resolution.10 Adapted with permission.
In addition to having a high SNR, the SSADA algorithm has a high level of connectivity in the image. This means that the vasculature shown in the image appears smooth and continuous.11 This is important for allowing the image to be interpreted clearly.
Once the algorithm has processed the data, the output of the OCT-A algorithm is an image of the retinal and choroidal vasculature, which can be segmented into four zones: the superficial plexus, the deep plexus, the outer retina and the choroid.12 ,13 This includes the full depth of the optic disc.11 Therefore, the vasculature from the superficial retina to the lamina cribrosa can be seen,14 including into the pores of the lamina cribrosa. From this image, qualitative assessments can be made for pathologies, such as glaucoma and diabetic retinopathy.15–17 However, a quantified assessment of blood flow can be obtained in the form of the flow index, as shown in equation 2, and the vessel density, which can be calculated as the per cent of an area containing blood flow.
Equation 2: The flow index, an average of the decorrelation values for a given area, is useful in quantifying the microvasculature.11
The resulting outputs of OCT-A offer improvements over that of alternative imaging modalities. Compared with HRF, OCT-A offers insight to vessel density, whereas HRF only provides insight into blood flow velocity and the amount of avascular zone present in a field of view.7 Another common imaging modality is FA. FA is an invasive process, as it requires an injectable dye. In addition, time must be allowed for the dye to circulate throughout the body before images can be taken. Furthermore, the dye can illicit an anaphylactic reaction in some patients.18 OCT-A eliminates these disadvantages, due to the short scan time and lack of a dye. In addition, the radial peripapillary capillaries (RPCs) that supply the RNFL can be seen with OCT-A, while not with FA.11 Furthermore, FA is limited in only providing a two-dimensional image, lacking depth information, while OCT-A allows for three-dimensional imaging.19 Finally, groups have shown OCT-A to have reasonable specificity and sensitivity when detecting pathologies such as choroidal neovascularisation CNV.20
While OCT-A has advantages over other imaging modalities, it is important to recognise limitations. For example, it must be acknowledged that OCT-A specifically analyses the posterior retinal and choroidal microvasculature. While a specialised adaptor to image capillaries in the anterior segment has been developed,21 not all of the relevant ocular vasculature is imaged, such as the retrobulbar vessels. Also, if one is interested in deeper vessels of the retina, one must be aware that the superficial vessels may obscure the layer of interest.10 This issue requires the investigator to consider the image with context, adding a level of subjectivity to the interpretation. Another challenge to the interpretation of the image is the presence of artefacts. High velocity blood flow may create a void in the signal. Retinal pigment epithelial detachment may cause artefacts to present in the image, as well. An investigator should be aware of such situations when evaluating an OCT-A image.22 In addition, if the results indicate a loss of vessel density, one cannot differentiate the aetiology between tissue (capillary) loss and acute ischaemia,11 necessitating contextual information to deduce aetiology. For example, if one observed a decrease in RNFL thickness in addition to a decrease in the density of the RPCs, one could infer that there is a chronic loss of capillaries, rather than an acute ischaemic event. Furthermore, patient movement can reduce the quality of the OCT-A image, requiring the patient to remain still and avoid blinking during the examination.23 In addition, while the SSADA algorithm does improve the SNR compared with a full bandwidth variant, the resolution of the image is compromised; OCT-A with the SSADA algorithm has a resolution of 18 µm, rather than 5 µm for a full bandwidth algorithm.24 Finally, very low amounts of blood flow near the defined threshold may be undetected.25
Present findings with OCT-A in glaucoma and other diseases
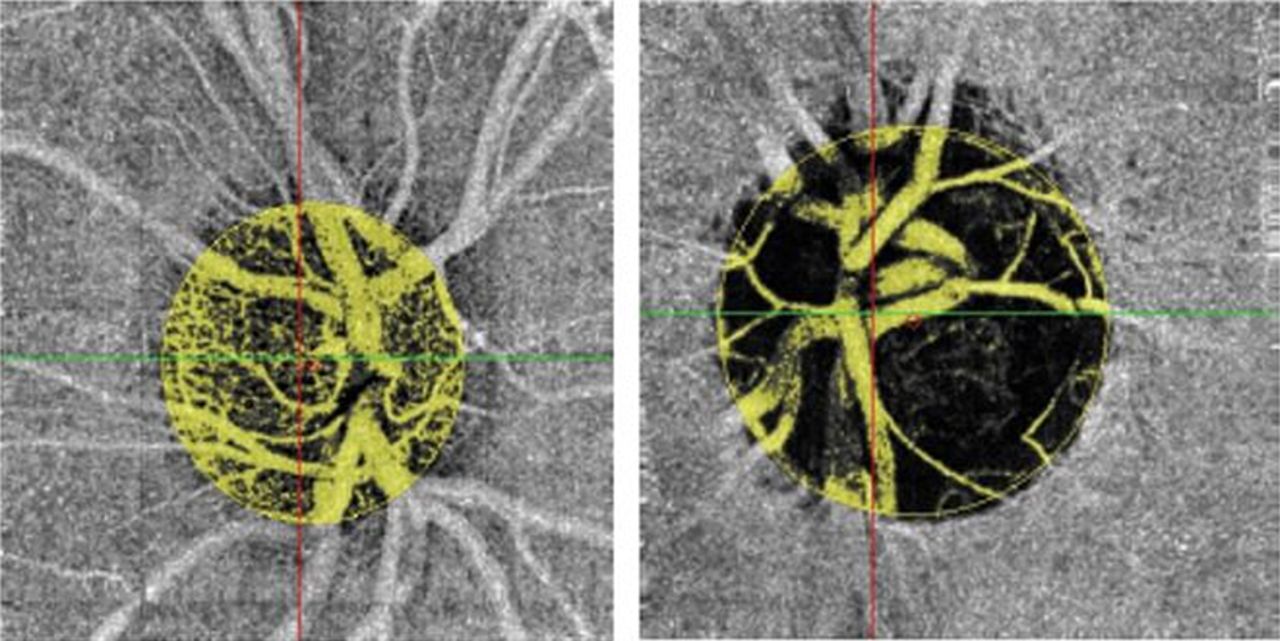
Glaucoma is a multifactorial, progressive, chronic optic neuropathy characterised by loss of retinal ganglion cells and their axons, resulting in visual field loss.26 It is the second leading cause of blindness worldwide.9 While several risk factors for glaucoma have been identified, such as increased intraocular pressure, the mechanisms underlying optic nerve damage remain a matter of debate.9 ,27 Prior studies suggest that there may be deficits in the ocular vasculature associated with glaucoma disease progression.2–6 ,8 ,26 With nearly 80 million people expected to suffer from the disease in 2020, and an increasing prevalence of disease with age, it is important to develop improved OAG diagnostic methods.28 ,29 The ability to quantify alterations in ocular blood flow via OCT-A has been demonstrated by several researchers. Using OCT-A, Leveque et al demonstrated that there is a decrease in vessel density in patients with OAG compared with healthy controls. Furthermore, the decreases in structural parameters, such as RNFL thickness, were directly correlated with the decreases in vessel density.14 Figure 3 demonstrates this difference in vessel density of the ONH between healthy control subjects and patients with glaucoma. Table 1 shows example values of the flow index and vessel density from a pilot study of patients with glaucoma and healthy controls.
Sample values of flow index and vessel density measured with optical coherence tomography angiography in patients with glaucoma
Optical coherence tomography angiography images comparing the total optic nerve head vasculature in a healthy control (left) and a patient with glaucoma (right).14 Adapted with permission.
While retinal microvascular deficits in the total ONH are important to study, consideration should be given to specific regions of the retina, as well. When imaging the retinal vasculature in the periphery of the optic nerve in patients with OAG using OCT-A, Hollo et al showed that a decrease in the density of the RPC was correlated with a decrease in the thickness of the RNFL. The areas of RPC density decreases spatially and corresponded with the areas of RNFL thinning, including early RNFL thinning.30 Studies such as these are useful in elucidating the relationship between retinal vascular changes and retinal structural changes seen in glaucoma. Yarmohammadi et al31 used OCT-A to expand these findings, observing a gradation in the decrease of vessel density relating to the severity of glaucoma, in both peripapillary capillary density and total ONH vessel density. Furthermore, patients with less severe glaucoma were found to have a smaller decrease in vessel density from healthy controls compared with those with severe glaucoma progression, as shown in table 2.31
Sample values of vessel density in healthy controls and patients with various degrees of glaucoma
These findings highlight the impact of ocular vasculature deficits in the pathophysiology of OAG. In addition, the group noted that the visual field deficits in patients with glaucoma were more strongly associated with decreases in vessel density than decreases in structural parameters such as RNFL thickness.31 Liu et al32 reported supporting data, showing that decreases in the peripapillary flow index were correlated with visual field deficits in glaucomatous eyes. These findings validate the concept that deficits in retinal microvasculature may have an important role in the development of visual field defects in patients with OAG.
OCT-A is not limited to detecting deficits in vessel density, as observed in glaucoma studies. CNV, identified as a pathological increase in vessel density, can be detected with OCT-A as well. Structural OCT is also not an ideal imaging method for CNV, as CNV appears similar to drusen.13 The dye-labelled fluid that leaks from the newly formed immature capillaries may obscure the presence of CNV when viewed with FA.33 OCT-A allows CNV to be visualised clearly and quantified. For example, CNV has been demonstrated in age-related macular degeneration (AMD) with OCT-A. Compared with FA, the visualisation of the retinal microvasculature was clearer, as haemorrhaging in wet AMD did not obscure the image with OCT-A.13 ,34 CNV has also been quantified with OCT-A in other diseases, such as in multiple evanescent white dot syndrome (MEWDS), a condition where yellow-white lesions form on the retinal pigment epithelium, causing blurry vision.33 ,35 Furthermore, researchers have demonstrated the quantification of small amounts of CNV with OCT-A, as low as 0.05 mm2.13 Detecting small amounts of CNV is useful for monitoring disease progression or treatment response.
Future applications of OCT-A to neurodegenerative diseases
The quantification of retinal microvasculature has been demonstrated with OCT-A in glaucoma studies. Certain neurodegenerative diseases with vascular components have the potential to be studied with OCT-A, as well. In general, there is value to studying the retina for neurodegenerative diseases, as the retina, due to the lack of myelin, is a convenient structure to study neurodegeneration.36 Diseases such as AD have vascular pathological components, including within the retina.37 OCT-A imaging of the retina of a patient with AD, as well as other neurodegenerative diseases, may provide a further understanding of how vascular deficits play a role in the pathophysiology of the disease.
In recent studies, researchers have used structural OCT to study structural changes in the retina in patients with AD. Studies have demonstrated a thinning of the RNFL, as well as a thickening of the macula.38–40 These alterations have been shown to occur with some gradation, with greater alterations occurring in patients with AD than in those with a mild cognitive impairment.41 In addition, groups have documented changes in the retinal vasculature in patients with AD in studies using retinal laser Doppler flowmetry. Notably, the retinal veins have been shown to have a decrease in lumen diameter.42–44 This observation is hypothesised to be the result of amyloid-β deposits on the internal vessel wall, thus causing the lumen to narrow.41 ,43 ,44 This theory, however, is debated.45 In response to the decrease in lumen diameter, the volumetric blood flow rate in the ocular venous return has been shown to decrease.41 ,42 Similar to glaucoma studies using OCT-A, these findings demonstrate a potential relationship between deficits in the retinal vasculature and retinal structure. Understanding the relationships between retinal vascular abnormalities and retinal neurodegeneration may be important to understanding the pathophysiological process of AD.
Thus far, vasculature investigations of the retina in patients with AD have used retinal laser Doppler flowmetry.41 While the structural assessments were made using structural OCT, OCT-A has not been used as an imaging modality specifically in AD studies. The effectiveness of retinal laser Doppler flowmetry is limited to detecting deoxygenated blood and blood flowing through larger vessels, making the retinal veins the more convenient vessels to analyse.41 Therefore, present studies assessing retinal blood flow in patients with AD are inherently limited. Current findings in the retinal and choroidal microvasculature of the retina in patients with AD may be expanded with OCT-A, especially considering the documented deficits in cerebral vasculature in AD and the close relationship between the cerebral and retinal circulations.37 ,46–48 Patients with AD also experience visual field deficits;42 a study using OCT-A may offer insight into the aetiology of this phenomenon.
In addition to AD, other neurological disorders have been shown to have structural deficits in the retina compared with healthy subjects. Parkinson's disease, schizophrenia and multiple sclerosis have all been shown to have some degree of RNFL thinning.48–52 Given that vascular deficits are seen in AD, it is reasonable to speculate that using OCT-A to investigate vascular changes in these diseases could expand our current knowledge.
Conclusion
Given the high prevalence of neurodegenerative diseases such as glaucoma and the importance of understanding the role of the vasculature in the pathophysiology of the disease, the quantification of blood flow in the retina and choroid is an important development. Studies have demonstrated the presence of vascular deficits in the ONH in patients with OAG with OCT-A. In addition, quantified CNV in MEWDS and AMD has been shown. While most of the results thus far are pilot data, which must be properly vetted and supported, OCT-A has contributed to improved imaging modalities. By providing high-resolution images and vessel density quantification of the retina and the optic nerve extending into the lamina cribrosa, understanding of the retinal vascular component in neurodegenerative diseases may be furthered with OCT-A. Advancing the understanding of the pathophysiology of diseases with retinal vascular components allows for more effective treatment of diseases and management of vision and health.
Acknowledgments
Dr AH would like to disclose that he receives remuneration from Stemnion, Biolight, Nano Retina, AdOM, Science Based Health, Isarna Therapeutics and Ono Pharmaceuticals for serving as a consultant. AH also holds an ownership interest in AdOM, Nano Retina and Oxymap. All relationships listed above are pursuant to Indiana University's policy on outside activities. IJ would like to disclose that she receive remuneration from Alcon, Allergan, Pfizer, Santen, Origmed and Vittamed.
References
Footnotes
Contributors All of the authors listed had substantial contributions to concept and design of this review, drafting and revision, as well as final approval of the paper for publication.
Competing interests None declared.
Provenance and peer review Not commissioned; externally peer reviewed.