Article Text

Abstract
Background/Aims To evaluate quantitative changes in the foveal avascular zone (FAZ) area after glaucoma surgery using swept-source optical coherence tomography angiography (SS-OCTA).
Methods Fifty-four consecutive patients with primary open-angle glaucoma (POAG) who met the inclusion criteria and underwent unilateral glaucoma surgery to reduce intraocular pressure (IOP) between April 2018 and July 2019.
Eyes underwent IOP-lowering glaucoma surgery and their fellow (non-surgical) eyes were included. OCTA of the macula was performed in both eyes before glaucoma surgery and 3 months postoperatively. Two blinded examiners reviewed the image quality. Within- and between-group comparisons of the FAZ area and correlation of the FAZ area with age, IOP, central sensitivity and clinical variables.
Results The mean (±SD) age was 66.7±11.3 years. After surgery, the IOP and FAZ area significantly decreased from 22.1±9.5 mmHg to 10.3±3.5 mmHg and from 0.485±0.193 mm2 to 0.446±0.174 mm2, respectively (both p<0.001). Conversely, in the non-surgery group, the preoperative and postoperative mean FAZ areas (0.398±0.119 mm2 and 0.396±0.110 mm2, respectively) did not significantly differ (p=0.469). Change in the FAZ area significantly correlated with the preoperative FAZ area, preoperative foveal sensitivity and change in IOP (all p<0.05).
Conclusions The FAZ area is decreased with IOP-lowering surgery in patients with POAG, and change in the FAZ area was significantly correlated with both preoperative foveal sensitivity and change in IOP.
- Imaging
- Glaucoma
- Anatomy
- Retina
This is an open access article distributed in accordance with the Creative Commons Attribution Non Commercial (CC BY-NC 4.0) license, which permits others to distribute, remix, adapt, build upon this work non-commercially, and license their derivative works on different terms, provided the original work is properly cited, appropriate credit is given, any changes made indicated, and the use is non-commercial. See: http://creativecommons.org/licenses/by-nc/4.0/.
Statistics from Altmetric.com
INTRODUCTION
Primary open-angle glaucoma (POAG) is a progressive optic neuropathy and a leading cause of blindness worldwide. The role of impaired ocular blood flow and alterations in retinal microvasculature in patients with glaucoma is debatable.1 2 Previous studies used fluorescein angiography to evaluate retinal microvasculature in vivo; however, optical coherence tomography angiography (OCTA) has recently been applied to a broad spectrum of diseases.3–5 OCTA allows non-invasive evaluation of retinal and choroidal vascular circulation without dye injection.6
The foveal avascular zone (FAZ) area is sensitive to ischaemic events and has been implicated in pathological processes. Previous studies have reported enlarged FAZ areas in retinal ischaemic diseases, such as diabetic retinopathy,7 and retinal vascular obstruction.8 The FAZ has also been evaluated in glaucoma.9 10
Several studies have demonstrated the reversibility of various ocular structures following intraocular pressure (IOP)-lowering in patients with glaucoma. Reversible optic disc cupping may occur following acute IOP-lowering with medical or surgical therapy, particularly in young individuals.11–13 Reversal of glaucomatous morphological features such as optic disc cupping,14 lamina cribrosa displacement,15 ocular blood flow16 and vessel density using OCTA17 after IOP-lowering treatment has been reported. OCTA has revealed increased peripapillary or optic nerve head (ONH) vessel density in patients with glaucoma with lowered IOP.18 However, the effect of IOP reduction by glaucoma surgery on the FAZ microcirculation in patients with glaucoma is unclear.19 We hypothesised that the structure of perifoveal vascular (corresponding to the central visual field (VF)) changes due to decrease in IOP. Here, we evaluated the size and shape of the OCTA-derived FAZ area in glaucomatous eyes before and after glaucoma surgery.
METHODS
Study population
This prospective study was approved by the Ethics Committee of Saitama Medical University (No. 20 013.01) and conducted in accordance with the tenets of the Declaration of Helsinki. We prospectively enrolled patients with POAG aged >20 years who fulfilled the eligibility requirements, signed informed consent after being informed of all possible consequences of the study and were scheduled to undergo unilateral glaucoma surgery at the investigation centre between April 2018 and July 2019.
All patients underwent a comprehensive ophthalmic examination, including slit-lamp biomicroscopy, IOP measurement with Goldmann applanation tonometry and fundus photography (CX-1, Canon, Tokyo, Japan). We measured the axial length (AL) and central corneal thickness (CCT) (Optical Biometer OA-2000, Tomey Corp., Nagoya, Japan). We performed an automated VF assessment using the 24-2 pattern Swedish interactive threshold algorithm standard strategy (Humphrey field analyser (HFA); Carl Zeiss Meditec, Dublin, CA, USA) to diagnose glaucoma and assess its severity. All participants had experience with VF examinations; we excluded unreliable VFs, defined as fixation losses greater than 25% or false-positive responses greater than 15%.20 Foveal sensitivity and central-4-point mean sensitivity were calculated in dB using individual test points, with each point converted to a linear scale (1/Lambert =100.1×dB; linear sensitivity)21 and averaged to obtain the mean sensitivity values.
We measured the retinal nerve fibre layer (RNFL) using spectral-domain OCT (SD-OCT) (Spectralis OCT, Heidelberg Engineering, Heidelberg, Germany).
Glaucoma was diagnosed from the following findings: (1) glaucomatous changes in the ONH, according to fundus photography, such as a vertical cup-to-disc ratio of 0.7, rim notch with a rim width ≤0.1 and/or an RNFL defect (with its edge at the ONH margin greater than that at a major retinal vessel) diverging in an arcuate or wedge shape; (2) glaucomatous VF defects that met at least one of the Anderson-Patella’s criteria, that is, a cluster of ≥3 points in the pattern deviation plot in a single hemifield (superior/inferior) with p<0.05, one of which must have been p<0.01; a glaucoma hemifield test result outside of normal limits; or an abnormal pattern SD with p<0.05.22 Other inclusion criteria were best-corrected visual acuity of at least 20/400, spherical refraction ≥—8.0 D and < +3.0 D and cylindrical correction of −3.0 D to 3.0 D.
We excluded participants with a history of intraocular surgery (except for uncomplicated cataract or glaucoma surgery); coexisting retinal pathologies; non-glaucomatous optic neuropathy; uveitis; ocular trauma; strabismus or fusion disorder; or history of Parkinson’s disease, Alzheimer’s disease, dementia or stroke. Ocular hypotensive medications were continued up to the time of surgery. Preoperative IOP was defined as the average of two measurements within 2 weeks before surgery. For all eyes, we obtained macula scans by OCTA before the glaucoma surgery and 3 months postoperatively.
Optical coherence tomography angiography
A 3×3 mm (1024×1024 pixels) OCTA image centred on the fovea was scanned using swept-source (SS)-OCTA (PlexElite 9000, Version 1.6.0.21130; Carl Zeiss Meditec). The SS-OCTA has a central wavelength of 1060 nm, an A-scan rate of 100 000 scans per second, and axial and transverse tissue resolutions of 6 μm and 20 μm, respectively. The angiography image was processed using both phase/Doppler shift and amplitude variation (optical micro-angiography). The superficial retinal layer was defined as the area between the internal limiting membrane and inner plexiform layers. The device automatically segmented the superficial capillary plexus.
Qualitative protocol
The qualitative protocol has been described.23 24 In brief, two blinded investigators (YY and HI) reviewed all images independently. Poor-quality scans were excluded if any of the following criteria were met: (1) poor-clarity images, (2) weak local signal caused by artefacts such as visual floaters, (3) residual motion artefacts visible as irregular vessel patterns or disc boundaries on enface angiography and (4) images with an off-centre fovea.25 Discrepancies were resolved by consensus or adjudication by a third experienced investigator (TS). Images with poor quality (image signal strength <8 due to signal noise; 1= minimum, 10= maximum) were excluded from the analysis.
OCTA measurement of the FAZ area
The FAZ area was that within the locus of the connected points along the borderline of the identifiable capillary network in the parafoveal area. We calculated the FAZ area (mm2) using ImageJ and an original macro language (Kanno-Saitama Macro (KSM) program); detailed methods have been published.24 In brief, KSM is an automated analysis program that extracts the FAZ area. The extracted FAZ area showed excellent reproducibility and was comparable to manual measurement. We adjusted the magnification effect due to AL according to the manufacturer’s correction formula and confirmed that the correction was comparable to that in a previous study.26
Statistical analysis
We assessed the distribution of numerical variables by inspecting histograms and using the Shapiro-Wilk W test of normality. Normally distributed variables are reported as mean±SD. Non-normally distributed variables are reported as median (IQR). The frequency of medication use between surgery and non-surgery groups, both before and after surgery, was compared using McNemar’s test. We used paired t-test to compare the FAZ area between preoperative and postoperative measurements and between eyes that underwent surgery and those that did not within patients. The Kruskal-Wallis test and post hoc Steel-Dwass test was used to independently compare changes in the FAZ area among the three groups (non-surgery, glaucoma surgery alone and glaucoma surgery combined with cataract surgery). We analysed the relationship between the preoperative FAZ area and variables such as age, AL, CCT, topical medication use, foveal sensitivity and central-4-point sensitivity by HFA 24-2 using a linear mixed model, whereby each participant was treated as a random effect. Subsequently, the relationship between the change in the FAZ area and various structural and functional parameters was evaluated using a linear mixed model. Variables with p<0.10 in the univariate analysis were used for multivariate analysis.
A p value <0.05 was considered to indicate a statistically significant difference. We used the JMP version 10.1 software (SAS Institute, Cary, NC, USA) and Stata software version 15 (StataCorp LP, College Station, TX, USA).
RESULTS
Seventy consecutive patients were enrolled. Of these, 3 and 13 eyes were excluded for off-centre images and poor image quality, respectively. The data of 54 patients were divided into a surgery group (eyes that underwent surgery) and a non-surgery group (fellow eyes) and analysed. Table 1 summarises the participants’ demographics and ocular characteristics. The mean patient age was 66.7±11.3 years; 29 patients (53.7%) were women. The median mean deviation (MD) values in the surgery non-surgery groups were −17.4 (−24.5, −11.0 (IQR)) dB and −8.5 (−16.1, −1.7) dB, respectively (p<0.001). The mean IOP was 22.1±9.5 mmHg preoperatively and 10.3±3.5 mmHg 3 months postoperatively (p<0.001).
Demographics and ocular characteristics of the study population
Table 2 shows the distribution of glaucoma medication use in the two groups preoperatively and postoperatively. Use of glaucoma medication in the surgery group was significantly lower postoperatively (all p<0.001); in the non-surgery group (fellow eyes), it tended to decrease, although this was not statistically significant. Table 2 shows the number of eyes that either discontinued or started topical medications after surgery.
Glaucoma medication use in the surgery and non-surgery groups between the preoperative and postoperative status
Representative case
Figure 1 shows two eyes of representative cases from the surgery group. Case 1 was a 55-year-old man. His left visual acuity was −0.08 (logarithm of the minimum angle of resolution (LogMAR)) and foveal sensitivity was 33 dB. Compared to preoperative OCTA images, two inner plexus vessels were confirmed at the superior FAZ area in the postoperative OCTA images. Superimposing the preoperative and postoperative images showed that the FAZ area had decreased.

Representative cases from the surgery group of preoperative, postoperative and superimposition OCTA images. The preoperative OCTA images are shown in the first row. (upper right) Magnified view and extracted red-coloured FAZ boundary using the KSM program. The postoperative OCTA images are shown in the second row. (middle right) Magnified view and extracted pink-coloured FAZ boundary using the KSM program. The superimposition OCTA images are shown in the third row. These images comprise the comparison between the preoperative and postoperative OCTA images. (bottom centre) Inner plexus microvasculature could be confirmed in postoperative images (yellow arrow) even though this plexus microvasculature was not observable on the preoperative OCTA images. (bottom right) Superimposed images after extracting the FAZ boundary using an automated macro language. The postoperative FAZ area (blue-coloured extracted) was significantly smaller than the preoperative FAZ area (pink-coloured extracted). FAZ, foveal avascular zone; KSM, Kanno-Saitama Macro; OCTA, optical coherence tomography angiography.
Case 2 was a 67-year-old man. His right visual acuity was 0.05 (LogMAR) and foveal sensitivity was 25 dB. An inner plexus vessel was partially confirmed in the preoperative OCTA image but was unclear. Postoperative OCTA revealed the vessels more clearly.
Quantitative assessment
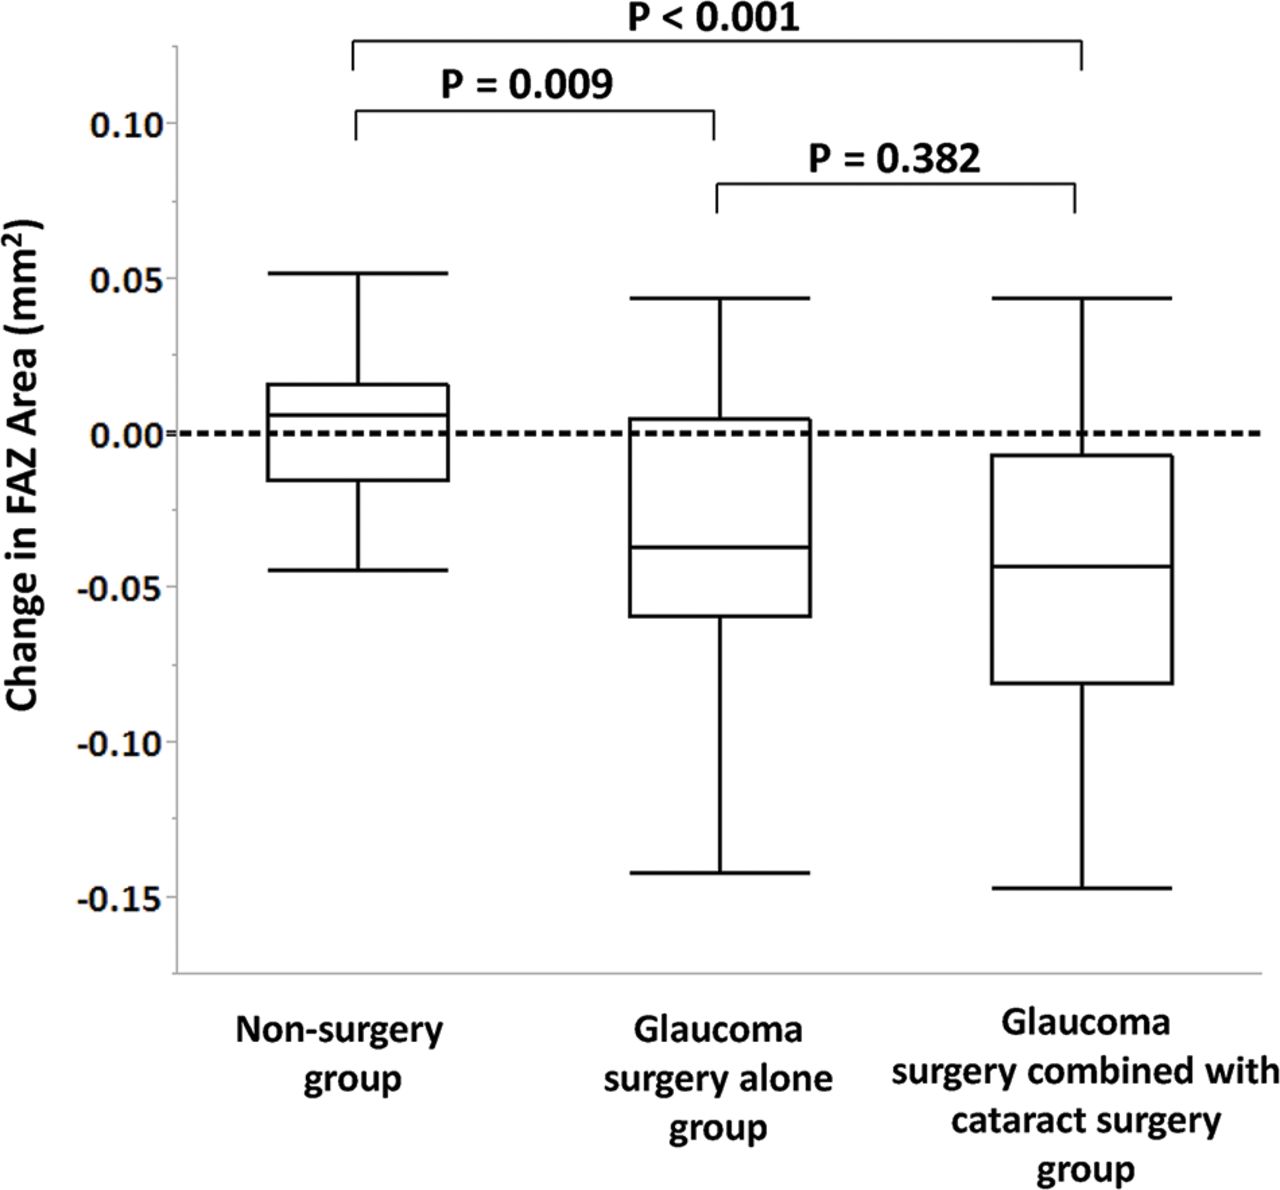
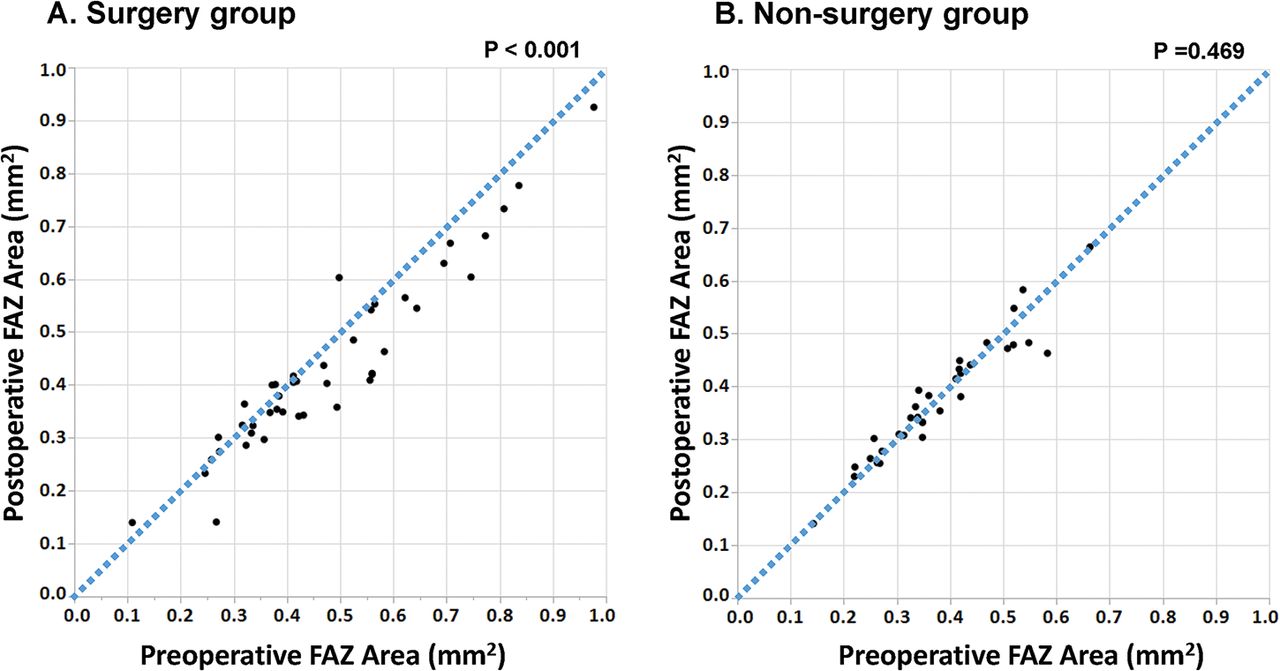
Table 3 and figure 2 show the comparison between the preoperative and postoperative FAZ areas in the surgery and non-surgery groups. Figure 3 shows the distribution of change in the FAZ area in the surgery group and the non-surgery group. The FAZ area was significantly larger in the surgery group than in the non-surgery group both preopeative- and postoperatively (all p<0.05). In the surgery group, the postoperative FAZ area was significantly smaller than the preoperative measurement (p<0.001); preoperative and postoperative measurements were similar in the non-surgery group (p=0.469). Box plots comparing the change in the FAZ area of eyes in the three groups are shown in figure 4. There was a significant difference between eyes in the non-surgery and both glaucoma surgery groups; there was no difference between those in the glaucoma surgery–alone and glaucoma surgery combined with cataract surgery groups.
FAZ area in the surgery group and non-surgery group between the preoperative and postoperative status

Scatter plots showing the comparison between the preoperative and postoperative FAZ area in the surgery group and the non-surgery group, respectively. FAZ, foveal avascular zone.

Distribution of change in the FAZ area in the surgery group and the non-surgery group. FAZ, foveal avascular zone.
Box plots showing the comparison of the change in the FAZ area among non-surgery, glaucoma surgery–alone and glaucoma surgery combined with cataract surgery groups. FAZ, foveal avascular zone.
Table 4 shows the results of univariate and multivariate models investigating putative factors for the preoperative FAZ area in all eyes (n=108) using the mixed model. Only CCT (p=0.002), HFA 24-2 (p=0.008), foveal sensitivity (p<0.001), the central-4-point mean measurement (p<0.001) and prostaglandin (PG) analogue use (p=0.025) were significantly associated with FAZ area in the univariate models. Neither baseline age (p=0.254) nor IOP (p=0.496) were related to FAZ area. We separately examined foveal sensitivity and central-4-point sensitivity in two different multivariable models, adjusted for age, HFA 24-2, CCT and PG analogue use, because there was a statistically significant correlation between them (r =0.794, p<0.001); the result showed multicollinearity, CCT, foveal sensitivity and central-4-point sensitivity correlated significantly with the preoperative FAZ area after adjusting for these factors.
Association between the preoperative FAZ area and ocular variables: univariate and multivariable analyses (n=108 eyes)
Table 5 shows the results from the univariate and multivariate models investigating putative factors, change in the FAZ area and related factors in all eyes (n=108) using the mixed model. CCT (p=0.004), preoperative foveal sensitivity (p<0.001), preoperative FAZ area (p<0.001), change in IOP (p<0.001) and glaucoma surgery (glaucoma surgery alone and glaucoma surgery combined with cataract surgery; p=0.001 and p<0.001, respectively) were significantly associated with change in the FAZ area in the univariate models. We separately examined change in IOP and glaucoma surgery in two different multivariable models. In multivariate analysis, foveal sensitivity, preoperative FAZ area, change in IOP and glaucoma surgery were significantly correlated with change in the FAZ area (all p<0.05).
Association between change in the FAZ area and ocular variables: univariate and multivariable analyses (n=108 eyes)
DISCUSSION
Following IOP-lowering surgery, we demonstrated that the FAZ area was significantly smaller and perifoveal microcirculation was enhanced. In contrast, it did not change in the fellow eye during the follow-up period. Moreover, the preoperative FAZ area significantly correlated with preoperative foveal sensitivity, and change in the FAZ area significantly correlated with both preoperative foveal sensitivity and change in IOP after adjusting for age.
Recent studies have reported that FAZ area is related to central visual-function status in patients with glaucoma.9 10 27 28 Kwon et al reported an enlarged FAZ area in the perifoveal region, which was spatially correlated with central VF loss in patients with glaucoma.27 They subsequently demonstrated that the FAZ area has significant diagnostic value in discriminating glaucomatous eyes with central VF defects from normal eyes.10 However, another study reported that subjectively measured FAZ area did not differ between normal controls and patients with glaucoma.9 We measured FAZ area objectively using an automated program24 and confirmed an inverse association between FAZ area and degree of preoperative foveal sensitivity, suggesting that FAZ area enlargement in patients with POAG is associated with central VF loss.
We demonstrated that perifoveal microcirculation was enhanced after glaucoma surgery. Possibly because they were below the detection threshold, some inner capillary blood vessels not observed on the preoperative OCTA images were seen postoperatively as shown in figure 1. The FAZ border comprises a single-layered capillary arcade that lies within the ganglion cell layer,29 and retinal ganglion cells (RGCs) depend on regional capillary networks to meet their high metabolic requirements. Moreover, deriving its oxygen supply from multiple retinal capillary plexuses,30 31 the macula is one of the most metabolically active human tissues. Thus, we speculate that the observed enhancement of the microvasculature could lead to a reversibility of macula RGC function after glaucoma surgery and IOP reduction.
We found that glaucoma surgery with IOP reduction improved perifoveal microcirculation and the corresponding FAZ area up to 3 months postoperatively. Conversely, Ch’ng et al reported an increase in the mean size of the FAZ area followed by a gradual reduction and return to the baseline sizes after 1 year.19 They speculated that surgical inflammation contributed to the enlargement of the FAZ in the immediate postoperative phase. We excluded poor-quality scans that were possibly due to surgical inflammation. Moreover, the repeatability of the intra-OCTA device was high, whereas reproducibility among other devices has been shown to be unfavourable.32 This discrepancy may be attributed to a difference in instruments (RTVue vs PLEX Elite), OCT type (SD-OCT in RTVue vs SS-OCTA in PLEX Elite), algorithm (split-spectrum amplitude decorrelation angiography in RTVue6 vs optical micro-angiography in PLEXElite33) and glaucoma severity (−10.1 dB of MD in Ch’ng et al 19 and −17.4 dB of MD in this study).
It is noteworthy that changes in the FAZ area before and after surgery correlated independently with both the preoperative FAZ area and preoperative foveal sensitivity. To our knowledge, correlation between changes in OCTA-derived FAZ area and a functional index has not been previously reported. Lesk et al suggested that improved blood flow in response to therapy might be a good prognostic sign in glaucoma.34 A recent study showed that photopic negative response amplitude increased after IOP reduction in eyes with glaucoma.35 Another electrophysiological study reported reversal of RGC dysfunction with surgical IOP reduction.36 Further, recent cross-sectional and longitudinal studies have shown that macular vessel density correlated more strongly with visual function than OCT-derived inner macular thickness.25 37 38 Our results support the hypothesis of RGC-function reversibility with IOP reduction,36 and we speculate that OCTA-derived FAZ metrics have a role as biomarkers for RGC activity and visual function.
Unexpectedly, CCT was significantly associated with preoperative FAZ area. Although CCT may be a true independent risk factor for progression due to the relationship between scleral thickness and structural properties of the posterior globe,39 how corneal properties are related to susceptibility to glaucomatous damage remains unclear. Corneal properties, including a thin CCT, might have a greater risk of progression despite apparently well-controlled IOP.39 Asian populations, including the Japanese population, have higher prevalence of normal-tension glaucoma (NTG),40 and CCT was found to be associated with the MD of VF defects in patients with NTG.41 Therefore, enlargement of the FAZ area may be partially related to corneal thickness, scleral thickness and structural properties of the posterior globe, as well as glaucoma progression. Further study is needed to clarify these associations.
In this study, various eye drops were discontinued after surgery. In addition, eye drops administered to the non-operative eye could have also affected the ocular haemodynamics in the surgical eye (table 2). It is known that topical ocular hypotensive medications can influence blood flow.42 43 We observed that the FAZ area improved in many of the operated eyes despite discontinuation of eye drops after surgery, and the effects of topical medications on the FAZ area were less significant than other factors such as central visual sensitivity or CCT (table 3).
This study had several limitations. First, the follow-up period was only 3 months. It is possible that reversal of the FAZ would not persist if the IOP remained well controlled after this time. Second, all participants were Asian (ie, Japanese). Previous studies have revealed different foveal pit morphologies across ethnicities. The FAZ area correlated significantly with foveal pit morphology44; therefore, its utility may not be generalisable. Third, combined cataract surgery may influence quantitative measurements on OCTA imaging. Yu et al reported that lens opacities significantly influenced retinal blood flow measurements on SS-OCTA.45 In this study, more than half of the patients (57%) underwent glaucoma surgery combined with cataract surgery. Thus, improved image quality due to cataract extraction may have affected the decreased FAZ area that was observed postoperatively. We found that both glaucoma surgery alone and glaucoma surgery combined with cataract surgery were correlated with change in the FAZ area (table 5). Additionally, change in image signal strength was not correlated with change in the FAZ area. Thus, although several factors are implicated in the change in the FAZ area, this study showed that change in the FAZ area was significantly correlated with glaucoma surgery and the change in IOP. Fourth, we measured the FAZ area using an automated programe. Recent reports have found perfect intra-scan variability, but good inter-session variability, of FAZ measurements in healthy and glaucomatous eyes using automated programs.24 27 Thus, we excluded poor-quality scans and images with low signal strength. Last, there was a difference in the preoperative and postoperative medical regimen in eyes that underwent surgery that may have influenced macula blood flow and OCT-derived FAZ area. IOP-lowering medications administered to the contralateral eye also could have affected the operated eye. Further study is needed to understand better the effect of topical medications on macular haemodynamics.
In conclusion, we showed that FAZ area is decreased and perifoveal microcirculation is enhanced with IOP-lowering surgery in patients with open-angle glaucoma. Further, it is shown that change in the FAZ area was significantly correlated with foveal sensitivity, preoperative FAZ area, change in IOP and glaucoma surgery. Longitudinal studies are warranted to elucidate further the relationship between visual function and alterations in OCTA-derived FAZ metrics.
REFERENCES
Footnotes
Contributors Design and conduct of the study: TS, YY and KS. Data collection: TS, JK, YY, IM, HI (Hirokazu Ishii), HI (Hisashi Ibuki). Analysis and interpretation of data: TS, JK, RNW and KS. Writing: TS. Critical revision: TS, RNW and KS. Approval of the manuscript: TS, JK, RNW, IM, YY, HI (Hirokazu Ishii), HI (Hisashi Ibuki) and KS.
Funding This study was supported in part by the Japan Society for the Promotion of Science grant (KAKENHI grant number 19K09976), Saitama Medical University (01E107) and the National Eye Institute (R01 EY029058).
Competing interests None declared.
Provenance and peer review Not commissioned; externally peer reviewed.
Data availability statement Data are available upon reasonable request.
Linked Articles
- At a glance