Article Text

Abstract
AIMS To determine the age related changes in optic nerve head structure in a group of normal subjects and assess the significance of any changes in relation to those found in open angle glaucoma.
METHODS A group of 88 white volunteers and friends and spouses of patients with a normal visual field and normal intraocular pressure was studied. Two different imaging and measurement devices were used (computer assisted planimetry and scanning laser ophthalmoscopy), and the results from each were compared. Measurements were made of the optic disc, optic cup, and neuroretinal rim areas, and the vertical optic disc diameter and cup/disc diameter ratio.
RESULTS Neuroretinal rim area declined at the rate of between 0.28% and 0.39% per year. Vertical optic cup diameter and optic cup area increased with age. The mean cup/disc diameter ratio increased by about 0.1 between the ages of 30 and 70 years.
CONCLUSIONS Age related changes are significant and measurable, and should be taken into account when assessing the glaucoma suspect, and when estimating the rate of progression of glaucomatous optic neuropathy in patients with established disease.
- optic disc
- glaucoma
- aging
- imaging
Statistics from Altmetric.com
Open angle glaucoma (OAG) is a progressive, irreversible, optic neuropathy, for which the major risk factors are raised intraocular pressure and older age. Visual field loss is associated with the increase in optic cup size and other structural changes that occur at the optic nerve head. It is a common condition, the incidence of which increases with age. Prevalence varies with ethnic origin and estimates have been calculated in a recent review of the literature.1 Around 1% of white subjects have OAG at the age of 50 years, rising to around 4% at the age of 80 years. Estimates for black subjects are 3% and 13% at the equivalent ages. It is, therefore, becoming an increasingly important disease with growing numbers of the elderly in the population. OAG is a significant cause of visual disability, with between 4.0% and 6.2% of patients blind in both eyes.2-4 The cost to the UK alone of blindness from glaucoma may exceed £100 million annually.5 OAG is asymptomatic early in the course of the disease, and patients frequently present late with irreversible loss of vision. It is estimated that up to 50% of individuals with glaucoma in the population are undiagnosed.167 Better means for case finding are therefore needed.
At present in the UK the majority of new cases are picked up by the optometrist89 on the basis of intraocular pressure tests (tonometry), visual field tests, and examination of the appearance of the optic nerve head (optic disc). Using a combination of all three results in the greatest detection rate.10 The use of these methods is, however, patchy and the only mandatory examination is ophthalmoscopy.10
Although it is well established that the incidence of OAG increases with age, little is known of the aging changes that occur at the optic disc in the normal population. The purpose of this study was to define normal aging changes in the optic disc morphology.
Methods
Measurement of the size of optic disc features is possible from fundus photographs (planimetry)1112 or images acquired with the scanning laser tomograph (Heidelberg retina tomograph, software version 1.11).13 We used these methods to describe a normal population.
SUBJECTS
Normal subjects were recruited prospectively as part of a study on the treatment of ocular hypertensive patients and the early detection of glaucoma. All gave informed consent to the investigations performed, and each had the following: medical and ocular history, slit lamp biomicroscopy, tonometry, fundus examination, visual field testing, optic disc photography, and imaging using scanning laser ophthalmoscopy (SLO).
The normal subjects were friends or spouses of patients attending the ocular hypertension clinic at Moorfields Eye Hospital (n = 40), hospital staff (n = 16), or volunteers responding to advertisements on the hospital notice boards and in a pensioners’ magazine (n = 32). Restriction criteria were Caucasian ethnic group, refractive correction <6 dioptres, visual acuity of 6/9 (20/30) or better, normal visual fields, intraocular pressure of <21 mm Hg in both eyes, no previous ocular history involving the posterior segment, no family history of glaucoma involving a first degree relative, no history of diabetes, and no systemic β blocker medication. All subjects performing a normal field test were included irrespective of optic disc appearance. One eye was included in the study, chosen at random if both were eligible.
VISUAL FIELD TESTING
All visual field testing was performed using the Humphrey field analyser 24-2 program. Reliability criteria applied were fixation losses <30%, false positive responses <15%, and false negative responses <30%. A normal visual field was taken to be one in which the retinal sensitivity at all locations was better than the eccentricity related thresholds given in the Advanced Glaucoma Intervention Study (AGIS) protocol.14
OPTIC DISC PHOTOGRAPHY AND PLANIMETRY
Subjects’ pupils were dilated with 1% tropicamide. Keratometry readings, taken with a calibrated Javal Schiotz keratometer, and spectacle refraction were used to correct for ocular magnification using a Littmann algorithm.15 Photographs of the optic disc were taken with the Canon CF60U at the 30 degree setting. Four sequential photographs of each eye were taken, with a lateral shift in camera position after two pictures, to obtain a stereo effect when the images are viewed stereoscopically. The camera is not of a telecentric design, and the camera magnification for differing degrees of ametropia was calculated by photographing a target of known dimensions in a model eye set at varying degrees of ametropia.16
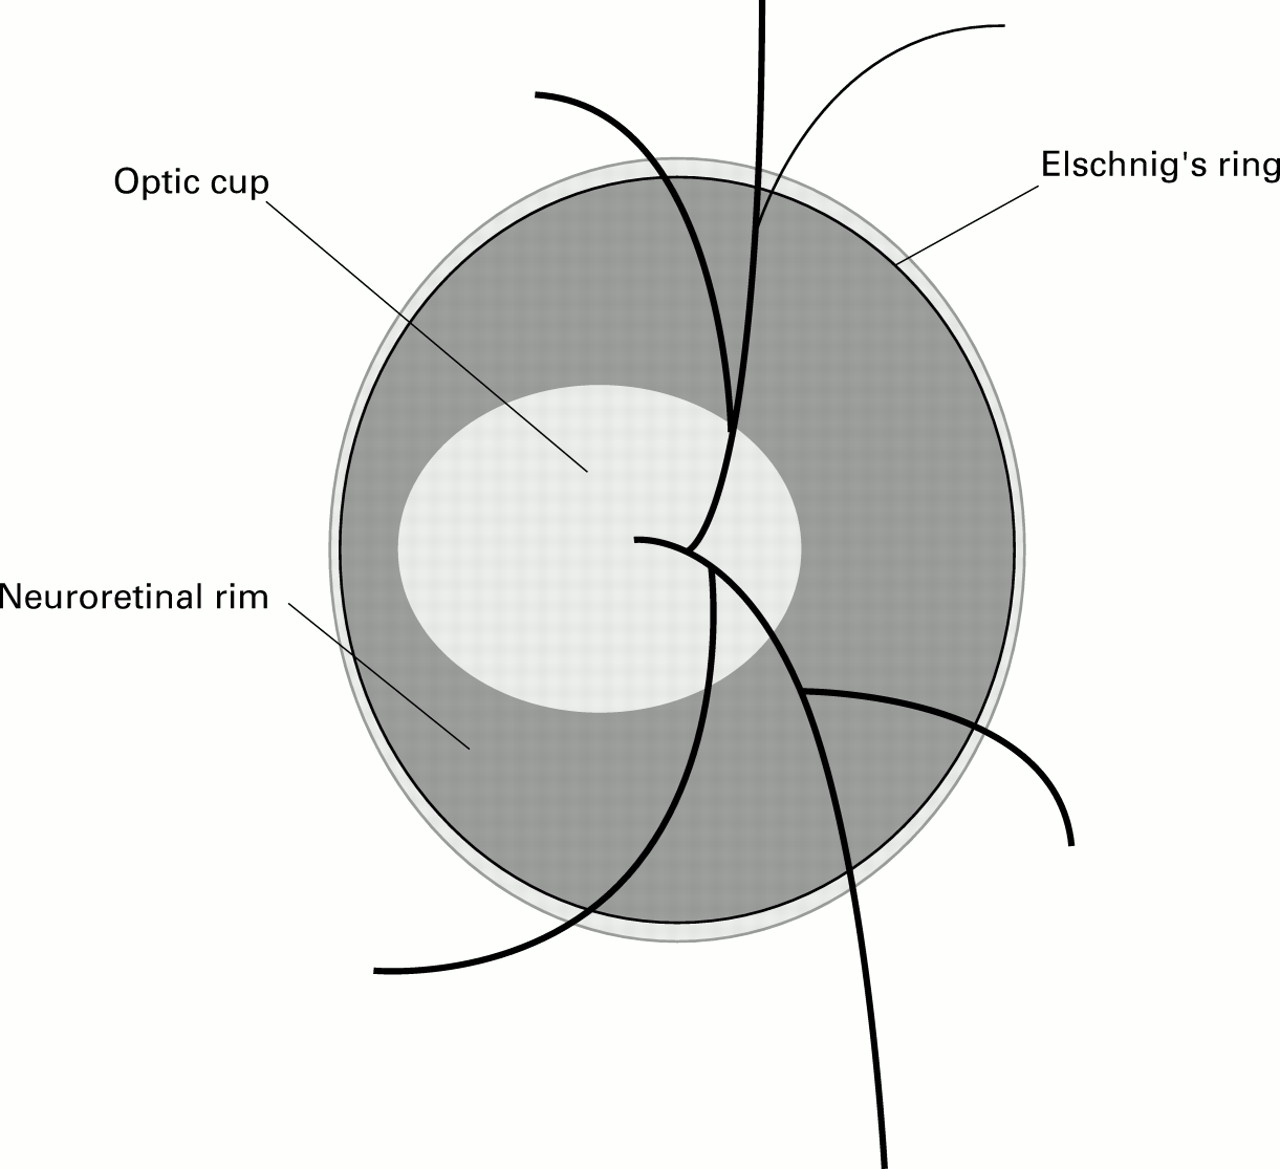
Photographs were analysed by computer assisted planimetry using thedisc-data, Thot Informatique (Pr Bechtoile, Angers, France) program. The technique and repeatability of measurements in this unit have been reported previously.17 Optic disc anatomy (Fig1) was defined according to the following conventions1819: the area of the disc was defined as the area within Elschnig’s ring, the cup was defined on the basis of contour, not pallor, and the neuroretinal rim/optic cup border was taken as the level at which the slope of the rim steepens. Vessels were considered to be part of the cup if there was no underlying rim tissue. The vertical cup/disc ratio (CDR) was taken to be the longest vertical cup diameter divided by the longest vertical disc diameter.2021

Diagrammatic representation of important optic disc features.
The optic disc photographs of the control subjects were added to those of 76 ocular hypertensive patients and 53 glaucoma patients and then examined in a masked fashion by one experienced observer (DG-H).
IMAGING WITH SLO
Subjects underwent imaging at the same session as retinal photography. Each had three consecutive images taken in the 10 × 10 degree frame. The SLO software is able to correct for small eye movements by aligning consecutive images in a scan series. Movements occurring within a single image in a series, which caused distortion of the image that could not be corrected, were excluded from the study. Analysis was performed on the mean topography. The disc margin was outlined, and measurement of the vertical CDR was performed from the colour coded map produced by the software analysis, according to the criteria given above. Measurements of optic disc, cup, and neuroretinal rim area are calculated by the SLO software.
STATISTICAL ANALYSIS
Statistical analysis was performed with the aid of the softwarespss for Windows (Version 7.0). Multiple linear regression analysis was performed with vertical cup diameter as the dependent variable, and vertical optic disc diameter, age, sex, eye side, intraocular pressure, refraction, and keratometry as independent variables. Linear regression was also performed between neuroretinal rim area and optic disc area, age, sex, eye side, intraocular pressure, refraction, and keratometry.
Results
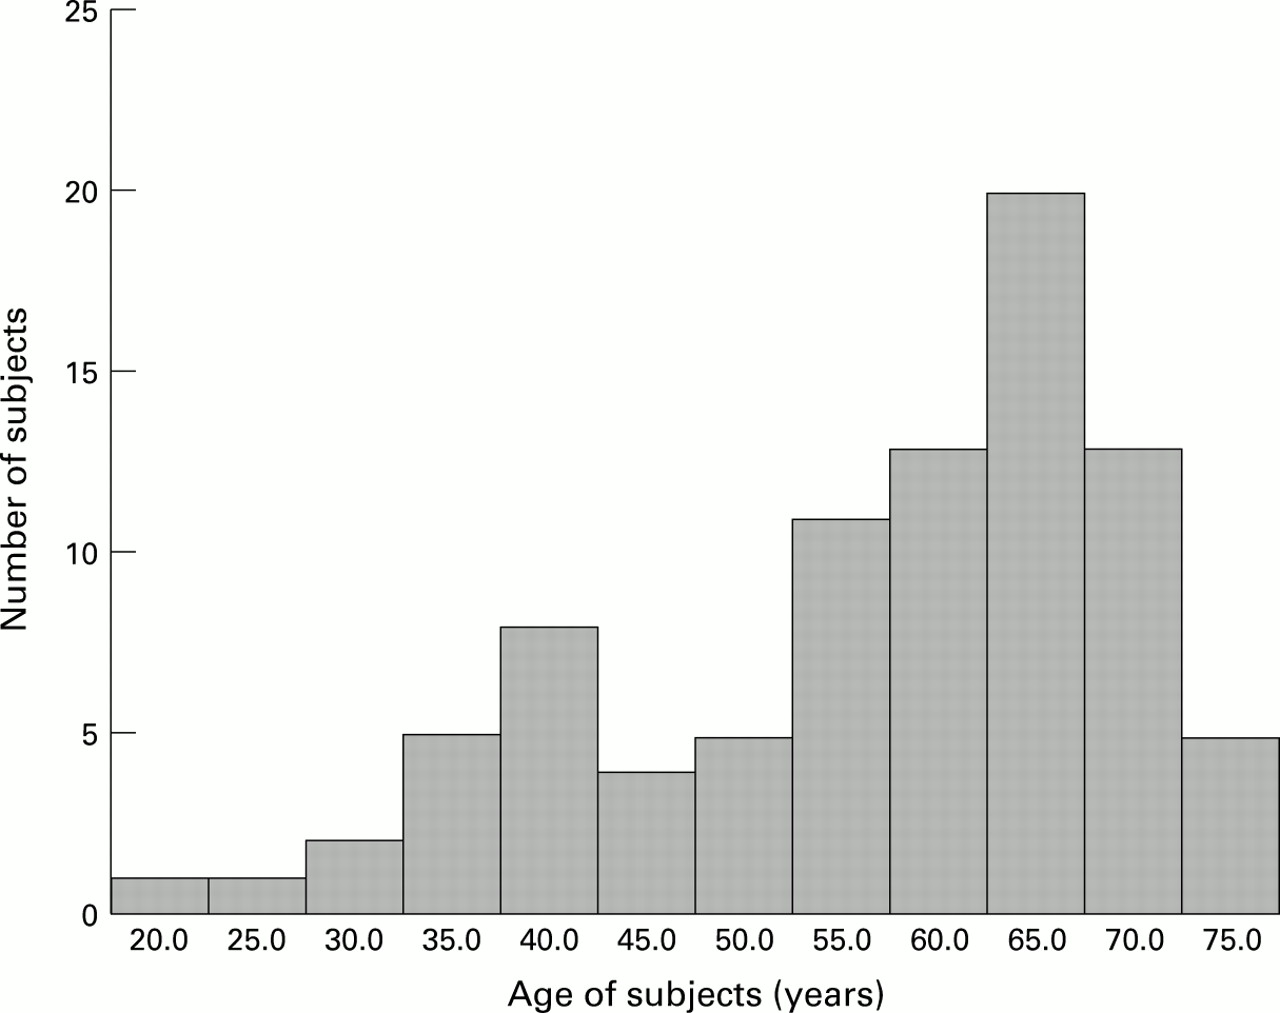
The study population characteristics are summarised in Tables 1and 2, and the age distribution is shown graphically in Figure 2. The values obtained for the optic disc morphologic variables from planimetry and SLO analysis are very similar (Table 2).
Summary of subjects’ characteristics
Summary of subjects’ optic disc morphology

Age distribution of study subjects.
Multiple linear regression analysis on the planimetric data demonstrated a strong relation between the vertical cup diameter and the vertical optic disc diameter (t=8.14, p < 0.000) and a weaker relation with age (t = 2.04, p = 0.045), the R2 value for the regression was 0.45, p <0.000. The equation for the regression line is vertical cup diameter = −1.537 + (1.204 × vertical disc diameter) + (0.0037 × age)
The 95% confidence intervals for the coefficient of regression for age are 0.000 and 0.007. A similar relation between cup diameter and disc diameter (t = 5.52, p <0.000) and age (t = 2.46, p = 0.016) was found in the analysis of the SLO data. The R2 value for the regression was 0.32, p <0.000. The equation for the regression line is vertical cup diameter = −1.269 + (1. 047 × vertical disc diameter) + (0.0051 × age)
The 95% confidence intervals for the coefficient of regression for age are 0.001 and 0.009. Optic cup diameter was not found to be related to sex, eye side, intraocular pressure, refraction, or keratometry. Optic disc diameter was unrelated to age.
Analysis of data from both forms of optic disc imaging gives very similar results for the age related increase in optic cup diameter. These figures may be translated into the more familiar form of CDR given in Table 3. for the ‘average optic disc’ (vertical diameter of 1.74 mm measured by planimetry and 1.67 mm by the SLO). The CDR increases by about 0.1 between the ages of 30 and 70 years.
Vertical cup/disc ratio for optic discs of average size at different ages
The relation between the neuroretinal rim area and optic disc area, age, sex, eye side, intraocular pressure, refraction, and keratometry was also defined by multiple linear regression. A significant association was found between rim area and disc area (t = 6.27, p <0.000 for planimetry and t = 5.62, p = <0.000 for the SLO) and age (t = −2.58, p = 0.012 for planimetry and t = −2.69, p = 0.009 for the SLO).
The equation for planimetry is neuroretinal rim area = 0.993 + (0.370 × optic disc area) + (−0.004 × age)
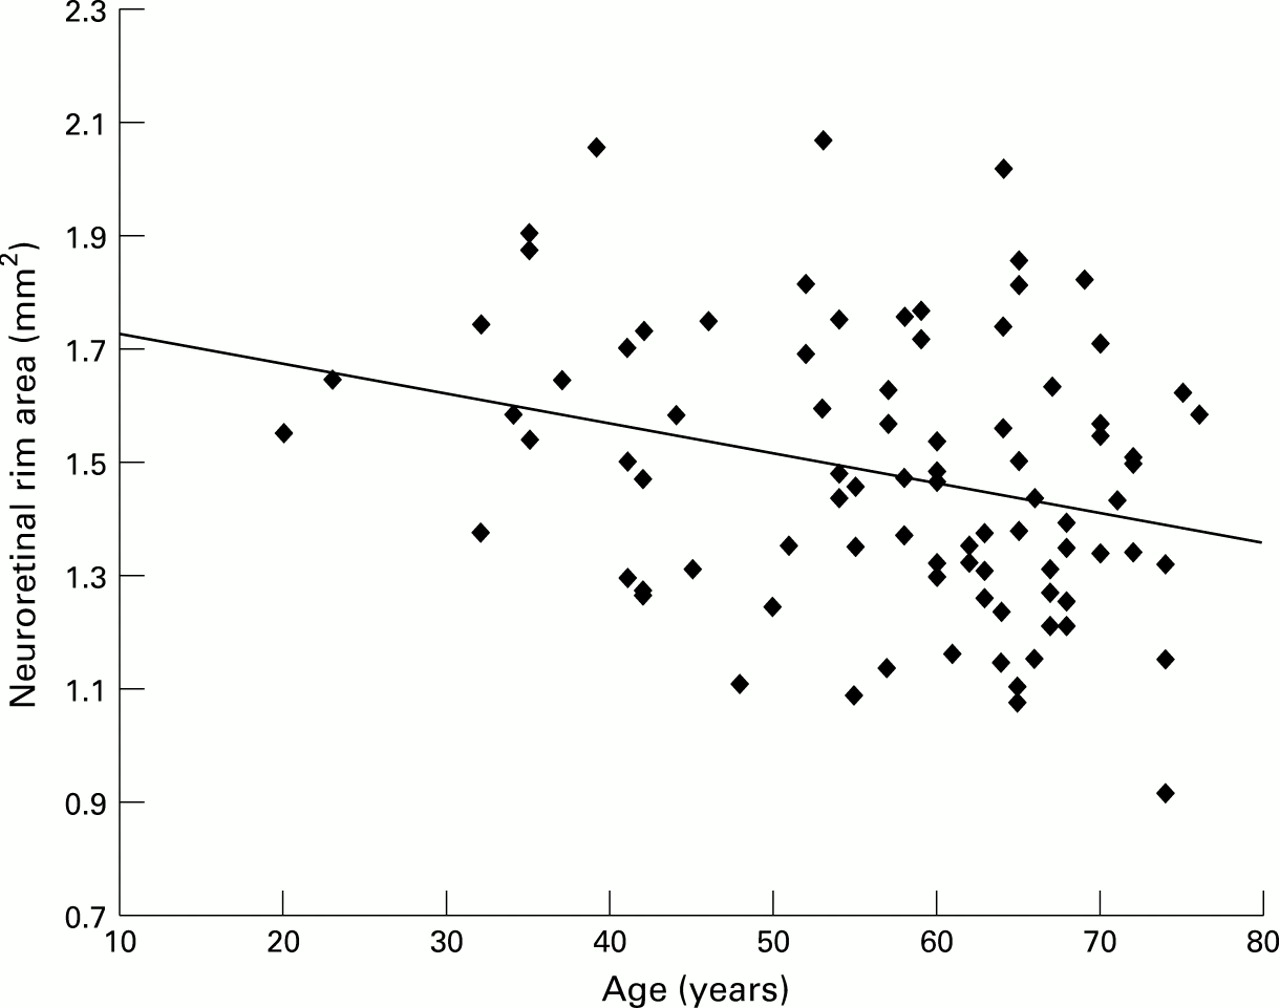
(R2 0 37, p <0.000, 95% confidence intervals for the coefficient of regression for age −0.001 to −0.008). The relations between neuroretinal rim area and optic disc area and neuroretinal rim area and age are shown in Figures 3 and 4.

Plot of neuroretinal rim area against optic disc area.

Plot of neuroretinal rim area against age of subjects.
The equation for the SLO is neuroretinal rim area = 1.021 + (0.443 × optic disc area) + (−0.006 × age)
(R2 0.36, p <0.000, 95% confidence intervals for the coefficient of regression for age −0.002 to −0.011.)
Neuroretinal rim area was not found to be related to sex, eye side, intraocular pressure, refraction, or keratometry. Optic disc area was unrelated to age.
The age related decline in neuroretinal rim area found by both methods of disc analysis was very similar. Expressed as a percentage of the mean rim area, the decline in neuroretinal rim area is 0.28% per year by planimetry, and 0.39% per year by the SLO.
Discussion
Recognition of normal aging changes is fundamental to our understanding of diseases that have an age related incidence, such as OAG. The cardinal features of OAG at the optic disc are a reduction in neuroretinal rim area and enlargement of the optic cup. This study demonstrates, by two different imaging and measurement techniques, that both rim area and cup size are related to the age of the subject. There is considerable variability in optic disc morphology in the normal population, and factors known to have a major effect on rim area and cup size include optic disc size122223 and ethnic origin.24-27 Many of the studies outlined below do not account for these variables and are therefore less likely to detect the more subtle influence of aging. In addition, studies that include an assessment of optic disc appearance when recruiting subjects are likely to bias the results towards a negative finding.
There is conflicting evidence in the literature with respect to aging changes in optic disc cupping, with some authors reporting an increase,28-34 and others finding none.1235-37 Studies looking at neuroretinal rim area changes with age have likewise had conflicting results, with some reporting a decline,38-40 and others finding none.12274142 Authors of early papers relied on optic disc drawings,28 clinical or stereo photograph comparison with diagrammatic charts,2933 clinical estimation of the CDR,30323436 or comparison of non-stereoscopic photographs with diagrammatic charts.3536 Both clinical and non-stereoscopic evaluation of the optic disc are notoriously subject to high variability between different observers.2143
More recently, techniques that allow magnification corrected measurements of optic disc images have been used. These include manual planimetry of non-stereoscopic photographs,31 computer assisted planimetry of stereoscopic photographs,12394042 and computerised digital stereo photogrammetry.273841
REVIEW OF PREVIOUS MEASUREMENT DATA
The more recent papers, using techniques to make absolute, magnification corrected measurements of neuroretinal rim and optic cup areas, will be considered in more detail.
Longitudinal studies
Airaksinen et al 40 followed five normal subjects within a group including 75 patients with ocular hypertension and 43 with glaucoma over a 5–15 (mean 10) year period. None showed a statistically significant decrease in neuroretinal rim area. The mean loss of rim area over the period (2.3%) was less than the 2.9% coefficient of variation for repeated examinations of one photograph. The patients with clinically deteriorating glaucoma lost neuroretinal rim at a mean rate of about 3.5% per year.
Similarly, Caprioli42 compared the optic disc photographs of 100 normal subjects, from a population based study, taken 9–16 (mean 13) years apart. Mean change was 1.2%, which was less than the 1.8% change found in a control group of photograph pairs taken on the same day (the power of the study to detect a 5% change was 95%).
Another study, reported 50 years ago, deserves mention,28although the method of optic disc assessment was more subjective and prone to bias than modern methods. This involved careful drawing of the disc cupping and subsequent measurement of the drawings. Pickard followed 234 undefined normal eyes for a period of 15 years. He estimated cupping as a percentage of total disc area and his figures may be converted to an estimated rim loss of 2.5% per year, 10 times higher than the present study. However, he also made estimates of disc cupping in a cross sectional study of 280 normal eyes, at the same time, and estimates from his figures give a mean loss of 0.55% per year, which is similar to the estimate from our sample.
Cross sectional studies (clinic based)
Balazsi et al 39 studied 12 eyes of 12 normal subjects with a mean age of 52.0 (SD 20.9) years in a cross sectional study, together with ocular hypertensive patients and patients with early glaucoma. The race of the subjects was not stated. A relation between neuroretinal rim area and age was found, but no details of the form of analysis in this small group were given. No relation between optic disc size and age was found.
Jonas et al 12 studied 457 eyes of 319 normal subjects with a mean age of 42.7 (SD 19.6) years in a cross sectional study. The race of the subjects was not stated and subjects with suspected optic nerve disease, on the basis of biomicroscopy, were excluded. No correlation was found between neuroretinal rim area or optic disc area and age.
Two groups have used the Rodenstock optic nerve head analyser (RODA)3841 to examine the optic disc for age related changes. The RODA performs a modification of digital photogrammetry.
Funk et al 41 studied 194 eyes of 122 normal subjects, evenly spaced between the ages of 7 and 69 years, and a few aged between 70 and 84 years. Ethnic group was not stated. No relation between neuroretinal rim area and age was found by linear regression analysis. Subjects exhibiting pathological changes capable of altering optic disc structure had been excluded, and this may have influenced the result.
In contrast, Tsai et al 38 found the neuroretinal rim area to be significantly smaller in an elderly (⩾50 years, mean 68.8) group compared with a young (<50 years, mean 27.2) group of normal white subjects. There was also a non-significant trend to smaller optic disc size in the elderly group, and it has been suggested that this may account for the finding of a smaller rim area.44
Cross sectional studies (population based)
Bengtsson31 examined the non-stereoscopic optic disc photographs of 2274 eyes in 1287 subjects from Dalby in Sweden. He found an increase in optic cup diameter with age of approximately 0.002 mm per year, which compares with 0.0037 mm per year in this study. However, he also found a small increase in optic disc diameter with age of approximately 0.001 mm per year. This was interpreted as indicating a relatively stable neuroretinal rim area. It has been suggested that the slight increase in disc size with age may be artefactual,39 and related to the method used to correct for ocular magnification,45 with magnification of the disc image resulting from increased refractive power of the lens in older subjects.
Varma et al 27 analysed data from a large population based study using a similar method to correct for ocular magnification. Optic disc features were determined by digital photogrammetry of simultaneous stereoscopic pairs from the Topcon camera: 3475 eyes of white subjects, and 2903 eyes of black subjects, over the age of 40 years were studied. Analysis was performed on the whole group, and each disc variable was entered in a multiple regression model with age, race, and sex. No age related alteration in any disc variables was found. However, a greater number of older subjects were excluded because optic disc stereo photographs, or reliable analyses, were not obtained. The following proportions were excluded, by age group: 40–49 years 16%, 50–59 years 21%, 60–69 years 30%, 70–79 years 51%, and 80+ 79%. It is uncertain how this may affect the findings.
Interpretation of the results of this study
The larger optic cups and smaller neuroretinal rims found in older subjects may be taken to mean that there is loss of the neuroretinal tissue with age, or that subjects born more recently are born with more neuroretinal tissue. In order to determine whether the differences related to age represent an aging change or a cohort effect, longitudinal studies are needed. Two such studies have been outlined.4042 It can be seen that, given the small changes predicted by this study (0.28% per year in rim area) and the variability arising from the measurement technique, a very long period between examinations is needed to detect change (18 years to detect a 5% change). Alternatively, multiple examinations over a shorter period would mitigate the effect of measurement error.
The morphological changes (loss of neuroretinal rim and increase in cupping) parallel the loss of optic nerve axons that is known to occur in glaucoma.46 A number of histological studies have found an age related decline in optic nerve axon count.47-51The estimated rate of decline ranges from around 0.36%51to 0.62%48 per year, equivalent to the rate of rim loss found in this study. Not only should this physiological decline in rim area with age be borne in mind when assessing glaucoma suspects, but also when looking for progression in glaucoma patients. The difficulty in distinguishing physiological from pathological change is compounded by the fact that other markers of glaucomatous nerve damage, such as parapapillary atrophy52 and reduced visibility of the retinal nerve fibre layer,53 have also been described as features of the aging eye.5455
If the results of this study represent a true aging change, the estimated rate of change represents a mean for the group. There is likely to be wide variation between individuals. Those exhibiting a more rapid decline in neural tissue present the greatest difficulty, as the distinction between physiological and pathological decline becomes more difficult to make. The problem for the clinician becomes even more marked when it is appreciated that 24%56 to 32%,2 or more,57 of patients with glaucoma may have intraocular pressures within the normal range, and that loss of neuroretinal rim frequently occurs before visual field defects develop.1958 Thus, distinction between early pathological change at the optic disc and normal aging change will be very difficult to make.
This study supports the conclusion that there is an age related decrease in the area of the neuroretinal rim, which parallels the decline axon numbers found by histological work. However, given the possible biases in ‘normal subject’ recruitment in studies that are not population based and the limitations of a cross sectional study, the results need to be confirmed using longitudinal data acquired over a long period in a population based sample.
Acknowledgments
The authors would like to thank Dr Alicja Rudnicka, City University, London, for establishing the magnification characteristics of the fundus camera used in the study. Mr Garway-Heath was supported in this research by a grant from the Guide Dogs for the Blind Association.