Article Text

Abstract
BACKGROUND This study evaluated the ability of laser scanning tomography to distinguish between normal and glaucomatous optic nerve heads, and between glaucomatous subjects with and without field loss.
METHODS 57 subjects were classified into three diagnostic groups: subjects with elevated intraocular pressure, normal optic nerve heads, and normal visual fields (n=10); subjects with glaucomatous optic neuropathy and normal visual fields (n=30); and subjects with glaucomatous optic neuropathy and repeatable visual field abnormality (n=17). Three 10 degree image series were acquired on each subject using the Heidelberg retina tomograph (HRT). From the 14 HRT stereometric variables, three were selected a priori for evaluation: (1) volume above reference (neuroretinal rim volume), (2) third moment in contour (cup shape), and (3) height variation contour (variation in relative nerve fibre layer height at the disc margin). Data were analysed using analysis of covariance, with age as the covariate.
RESULTS Volume above reference, third moment in contour, and mean height contour were significantly different between each of the three diagnostic groups (p<0.001). Height variation contour showed no significant difference among the three diagnostic groups (p=0.906).
CONCLUSIONS The HRT variables measuring rim volume, cup shape, and mean nerve fibre layer height distinguished between (1) subjects with elevated intraocular pressures and normal nerve heads, and glaucomatous optic nerve heads, and (2) glaucomatous optic nerve heads with and without repeatable visual field abnormality. This study did not directly assess the ability of the HRT to identify patients at risk of developing glaucoma. It is hypothesised that the greatest potential benefit of laser scanning tomography will be in the documentation of change within an individual over time.
- glaucoma
- optic nerve
- laser scanning tomography
- digital imaging
Statistics from Altmetric.com
Optic nerve head assessment is a fundamental requirement in the evaluation of glaucoma. Clinical assessment is limited by high interobserver and intraobserver variability.1-3 Such variability can be reduced by using quantitative methods of optic nerve head evaluation such as planimetry,4stereophotogrammetry,5 and computerised image analysers.6 However, these techniques yield low quality images because of scatter and poor retinal reflectivity and contrast.7
The three dimensional imaging capabilities of confocal laser scanning tomography, combined with high reproducibility,8-12 make laser scanning tomography with the HRT a promising technique for assessing the optic nerve head of glaucoma patients and suspects.
Previous morphometric studies using conventional photographic techniques have suggested that neuroretinal rim measurement is one of the best nerve head variables for distinguishing glaucomatous patients from normals.13-18 Nerve fibre layer defects have been shown to be an early indicator of glaucoma.19-23Clinically, the shape of the cup in primary open angle glaucoma has been described as having ‘steep walls’.24 With this information along with recent Heidelberg retina tomograph findings,25 an a priori hypothesis was developed stating that the three variables most likely to distinguish between diagnostic groups were volume above reference (rim volume), height variation contour (variation in relative nerve fibre layer height at the disc margin), and third moment in contour (cup shape). Subsequent to forming this hypothesis several recent studies have correlated visual field indices with HRT variables in glaucoma and reported that cup shape26 and nerve fibre layer variables2728are promising.
The nerve fibre layer variable, height variation contour, measures the difference between the maximum and minimum heights at the disc margin. It is intended to identify focal nerve fibre layer dropout; larger values are expected in normals and smaller values are expected for glaucomatous patients. The other nerve fibre layer variable, mean height contour, measures the average height at the disc margin. Since focal nerve fibre layer loss is more readily recognised19and perhaps more specific for glaucoma20 than diffuse loss, height variation contour was thought to be more likely to detect a difference between the three diagnostic groups.
The aim of this study was to evaluate whether any HRT variables could distinguish between three groups: subjects with elevated intraocular pressure, normal nerve heads, and normal visual fields (ocular hypertensive); subjects with glaucomatous optic neuropathy and normal visual fields (glaucoma normal field); and subjects with glaucomatous optic neuropathy and repeatable visual field abnormality (glaucoma field loss) (Table 1).
Study sample
The study sample intentionally excluded subjects with severe glaucoma and subjects with no risk factors for glaucoma because the inclusion of these subjects would artificially overestimate the validity of laser scanning tomography.29 Brigatti and Caprioli26 recently used a similar study population. The sample was assembled to include a clinically relevant spectrum of subjects ranging from those with only elevated intraocular pressure, normal nerve heads, and normal visual fields, to those with early to moderate glaucomatous disease.
By choosing these three groups the study evaluated whether any HRT variables could differentiate two groups that differed only in optic nerve head appearance (ocular hypertensive versus glaucoma normal field) and two groups of subjects with glaucomatous optic neuropathy that differed in visual field outcome (glaucoma normal field versus glaucoma field loss). The first comparison was of interest as separating groups based on nerve head appearance is known to be problematic.1-3 The second comparison would help validate laser scanning tomography by comparing its performance with that of automated perimetry.
Methods
Fifty seven subjects were selected for this cross sectional study from a cohort (n=150) participating in an ongoing study of glaucoma detection and progression.30-32 All subjects were recruited from eye care practitioners in the Toronto area and assessed for eligibility by clinicians of the glaucoma service at the Toronto Hospital. Baseline assessment included case history, biomicroscopy, gonioscopy, fundus examination, stereoscopic optic nerve head evaluation, intraocular pressure measurement, and automated static perimetry using the Humphrey field analyser (program 24-2, standard, full threshold strategy). Inclusion criteria included primary open angle, pigmentary and pseudoexfoliative glaucoma, elevated intraocular pressure, and logMAR visual acuity of 0.5 or better. Exclusion criteria included subjects with narrow angles, ocular disease other than glaucoma, use of central nervous system depressants or ongoing use of steroids, field defects from causes other than glaucoma, and secondary glaucomas.
Following recruitment, ocular hypertensives (n=10) were defined as having an intraocular pressure of 21 mm Hg or higher on at least one visit, no clinical signs of glaucomatous optic neuropathy, and normal visual fields. The glaucoma normal field group (n=30) had normal visual fields and glaucomatous optic neuropathy. The glaucoma field loss group (n=17) had glaucomatous optic neuropathy and a repeatable visual field abnormality.
An optic nerve head with glaucomatous optic neuropathy was defined as having one or more of the following: a difference in cup/disc ratio of greater than 0.2 between eyes, a nerve fibre layer defect, a notch, a disc haemorrhage, or a cup/disc ratio of 0.7 or greater.33
Visual field abnormality was defined using the Humphrey field analyser, program 24-2 or 30-2, standard full threshold strategy andstatpac analysis. Target locations surrounding the blind spot, and the most superior locations, were excluded when categorising the subjects’ visual fields. In the glaucoma field loss group all subjects except one had a glaucoma hemifield test which was ‘outside normal limits’. That one subject had a glaucoma hemifield test which indicated a ‘general reduction in sensitivity’, a mean deviation with a probability of 0.5% (p<0.05) of falling within the age matched normal value, and an abnormal pattern deviation analysis demonstrating a defect of 10 dB. The visual field loss was consistent with the diagnosis of glaucoma.
Subjects were excluded if they had unreliable visual fields (more than 30% fixation losses or any reliability variables outside normal limits34) or the HRT image quality was not sufficient for the operators to distinguish the disc margin. Subjects were recruited in accordance with the tenets of the Helsinki agreement. The research was approved by the Toronto Hospital committee for research on human subjects.
Table 2 lists the study population characteristics. The sample contained 34 male subjects and 23 female subjects. Their refractive errors ranged from −6.00 to +4.50 DS and plano to −2.50 DC. One subject wore contact lenses. Visual acuity (logMAR) ranged from −0.20 to +0.30. The groups were similar with regard to sex, refractive error, pupil size, and visual acuity.
Study population characteristics
The mean age of the ocular hypertensive group was 52.5 years (SD 11.7), with a range of 31–69 years; the glaucoma normal field group was 58.9 years (11.6) with a range of 41–77 years; and the glaucoma field loss group was 64.5 years (10.2) with a range of 34–78 years. The mean ages of the ocular hypertensive and glaucoma field loss groups were significantly different from each other (p<0.05).
Laser scanning tomography was performed with the HRT (Heidelberg Engineering, Heidelberg, Germany, software version 1.09). The instrument’s design has been described previously.1235-37 Briefly, a 670 nm diode laser scans the retina using a field of view of 10, 15, or 20 degrees. In 1.6 seconds, a series of 32 two dimensional transverse optic section images are acquired and digitised with 8 bit resolution, in a frame of 256 × 256 pixels. The software produces a topographic image which represents the surface height (maximum reflectivity) at each pixel. The lateral resolution, essentially limited by the optical resolution of the eye, is approximately 11 μm.38 The maximum retinal radiance is approximately 3.5 mW/cm2sr which is very low compared with a conventional fundus camera, with a typical radiance of approximately 650mW/cm2sr.37
Stereometric variables of the HRT39 are generated by the software after the operator draws a contour line around the disc margin. Two axial boundaries, the curved surface and the retinal plane, were used to generate the volumetric data.
The stereometric variables that were evaluated in this study measured disc size (disc area and mean radius), cup size (effective area, area below reference, volume below surface, and volume below reference), cup depth (effective mean depth, maximum depth in contour, and mean depth in contour), rim volume (volume above surface, volume above reference), cup shape (third moment in contour), and relative nerve fibre layer height (height variation contour and mean height contour).
After obtaining informed consent, three 10 degree image series were acquired on one eye of 57 subjects. For six subjects, only two image series were available for analysis. Automated perimetry (HFA Program 24-2 or 30-2) was performed on the same day as laser scanning tomography in 28 subjects. The remaining 29 subjects performed automated perimetry on average within 3 months of tomography.
For each subject, three topography images were generated, and corrected for horizontal and vertical tilt. The disc margin, bordered by the peripapillary scleral ring of Elschnig, was defined by one operator (WH). Standard methodology, as recommended by the manufacturer for software version 1.09, was used to define the reference plane at a level 320 μm below the retinal plane. Other studies have used the same reference plane.25-28 All variables were corrected for refractive error.
Histological40 and psychophysical41 evidence suggests that optic nerve structure and function change with age. Although the groups were approximately age matched, an analysis of covariance (ANCOVA) was used to adjust for any potential confounding effect of age.42 Although the a priori hypothesis outlined three factors of particular interest, analyses were performed on all 14 variables.
To satisfy the conditions for ANCOVA it was first established that there was no significant interaction between age and group for each variable.43 It was then ensured that residual plots for the ANCOVA were normally distributed. A logarithmic transformation was performed on the variable volume above surface, since its residual plot was not normally distributed.42
If the ANCOVA showed a significant difference among the age adjusted group means, then pairwise comparisons of group means were performed using t tests, adjusted for multiple comparisons using the Bonferroni method.42
For variables demonstrating a significant interaction between age and group, adjustments could not be made for the potential confounding effect of age, so analysis of variance was performed on the unadjusted group means. Standard normal plots revealed that none of these variables was normally distributed, so non-parametric methods were used. Firstly, a Kruskal–Wallis one way analysis of variance42 was performed. If there was a significant difference among the groups then pairwise comparisons of group means were performed using the non-parametric Mann–Whitney U test,42 adjusted for multiple comparisons using the Bonferroni method.42
For all tests of significance a two tailed p value <0.05 was used. All analyses were performed using spss for Windows, Version 6.0.1.
Results
Table 3 lists the unadjusted group means for all 14 variables.
Means (SD) of stereometric variables
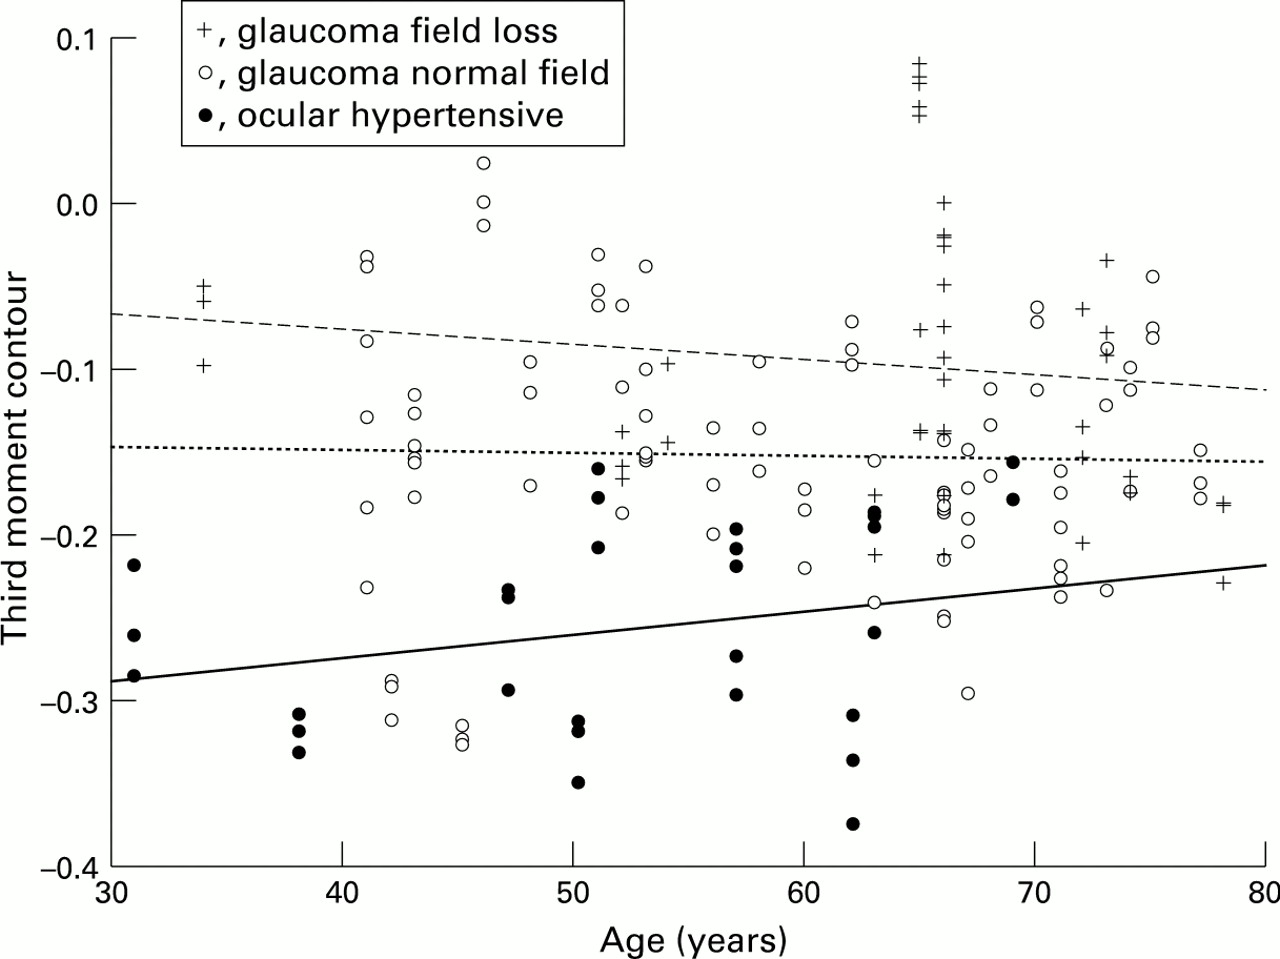
For the variables that describe the neuroretinal rim volume (volume above reference and volume above surface), the nerve fibre layer height at the disc margin (height variation contour and mean height contour), and the cup shape (third moment in contour) there was no significant interaction between group and age (Fig 1). Therefore we could adjust for the potential confounding effect of age.

Scatter plot of third moment contour versus age (showing no significant interaction).
Table 4 lists the results of these age adjusted analyses. For volume above reference, third moment in contour, and mean height contour all three diagnostic groups were significantly different from each other (p<0.001) indicating that laser scanning tomography with the HRT distinguished between the ocular hypertensive group and the glaucoma normal field group, and between the glaucoma normal field group and the glaucoma field loss group.
Significance (p<0.05) of pairwise comparisions of age adjusted group means (for variables without significant interaction between group and age) (df=108)
For the variable volume above surface, which also measures neuroretinal rim volume, the glaucoma field loss group was significantly different from the other two groups but there was no significant difference between the ocular hypertensive and glaucoma normal field groups. For the variable height variation contour, there was no significant difference among the three groups.
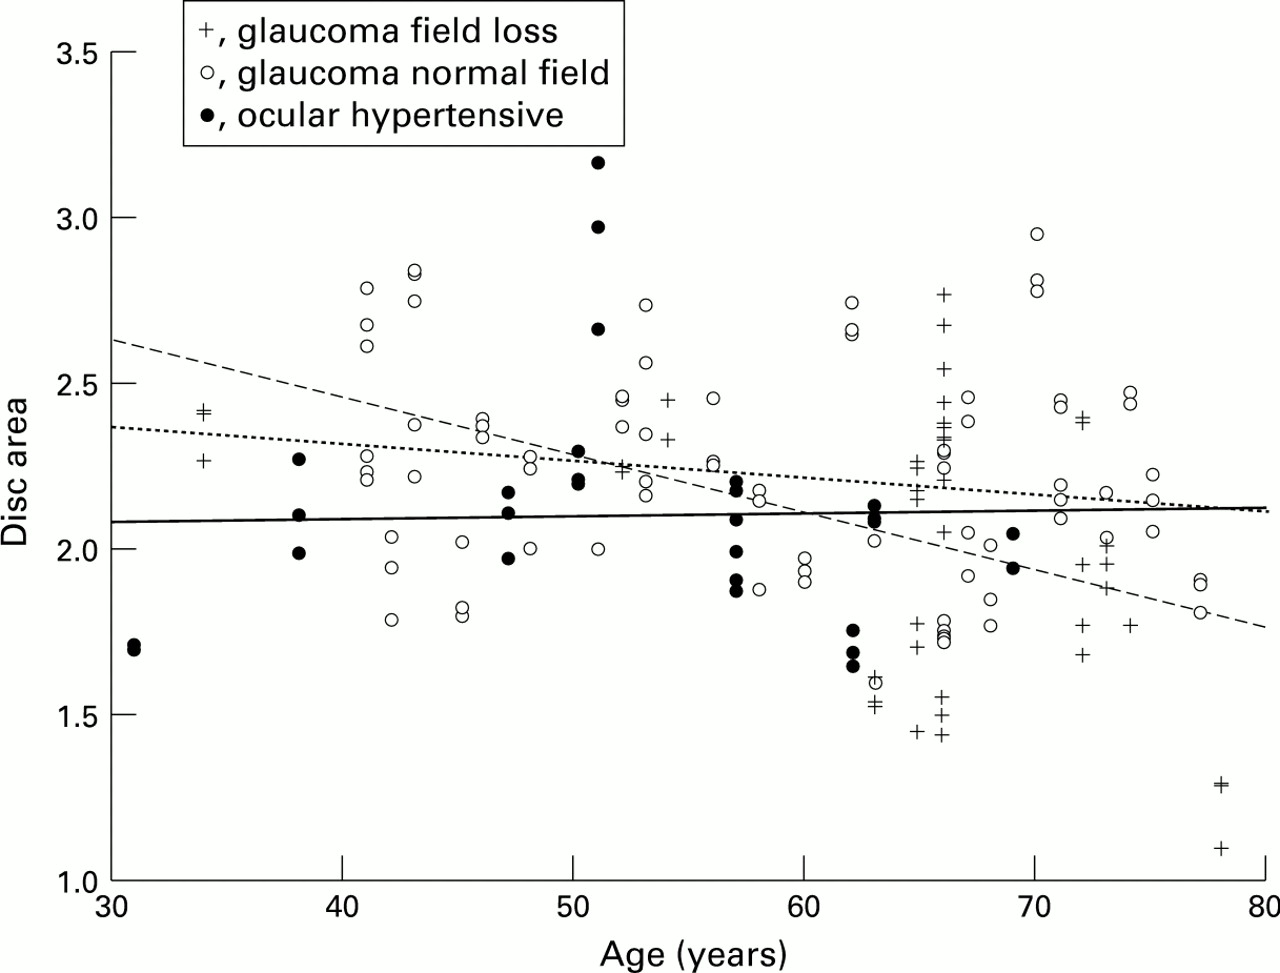
Variables with a significant interaction (p<0.05) between group and age (Fig 2) were those that describe disc size (disc area and mean radius), cup area and volume (effective area, area below reference, volume below surface, and volume below reference), and cup depth (effective mean depth, maximum depth in contour, and mean depth in contour). Therefore we were unable to adjust for the potential confounding effect of age. Analyses of the unadjusted group means revealed that the ocular hypertensive group was significantly different from the glaucoma groups for many of the variables, but there were no significant differences between the two glaucoma groups for any of the variables.
Scatter plot of disc area versus age (showing significant interaction).
The mean standard deviation for the height position of each pixel for the three measurements was 22.54 μm for the ocular hypertensive group, 31.96 μm for the glaucoma normal field group, and 39.13 μm for the glaucoma field loss group. The overall mean standard deviation for the study sample was 32.06 μm (SD 12.81).
Discussion
The results of this study indicate that laser scanning tomography with the HRT can distinguish between (1) subjects with elevated intraocular pressure and normal nerve heads and glaucomatous optic nerve heads, and between (2) glaucomatous nerve heads with and without repeatable visual field abnormality. Mean values for volume above reference (neuroretinal rim volume) and third moment in contour (cup shape) were different among all three diagnostic groups, confirming our a priori hypothesis. Mikelberg et al 25 and Burk et al 44 compared normals with glaucomatous subjects and also found rim volume and cup shape to be promising variables.
Age adjusted analyses could not be performed for several variables. Not adjusting for age makes it more likely that differences between groups would be found. Despite this, unadjusted analyses showed that none of these variables was able to distinguish among all three diagnostic groups. Therefore, it is unlikely that an age adjusted analysis would have produced different results.
Third moment in contour (cup shape) is a description of the distribution of depth values; cups with gradually sloping borders tend to have negative values and cups with steep sloping walls tend to have positive values. Before HRT, the clinical description of ‘steep walled cups’ was not quantifiable. Yet it resembles several of the clinical indicators of glaucoma (such as notches and undermining of disc rim tissue) more closely than the variables that describe cup size or rim size. Third moment in contour may prove to be particularly useful since although it is still dependent upon the contour line, it is independent of any potential error resulting from a change in reference plane over time,25 which may occur in progressive disease.45-47 Brigatti and Caprioli26recently looked at disc area, cup area and volume, mean cup depth, mean height contour, height variation contour, and third moment in contour in a population with early to moderate glaucoma. They found a significant correlation between third moment and the visual field indices mean deviation and corrected pattern standard deviation.
It was hypothesised that height variation contour would be the best nerve fibre layer variable because it is intended to identify focal nerve fibre layer dropout. This variable showed no significant difference among the diagnostic groups. However, mean height contour, which is an average of all the height values of the contour line, was significantly different between the three groups and therefore should be considered a better nerve fibre layer variable. Recent work by Mikelberg et al 10 and Chauhan et al 48 showed that height variation contour had the poorest reproducibility of all the HRT variables in part because it is grossly affected by even a single pixel measurement.10This poor reproducibility may therefore explain the height variation contour results in this study. Current software (version 1.11) allows the contour line to be extended beyond the disc rim where the variability is less.48 This new option deserves further evaluation. Tsai et al 28 recently looked at disc area, rim area, cup volume, and mean height contour. The latter was also analysed for different regions of the nerve head. In a glaucomatous population they found significant correlations between mean height contour for different regions, and the mean deviation of anatomically matched visual field regions.
Figure 2 suggests that older glaucoma patients have smaller discs. A similar trend (of decreasing values with age) was seen for the variables measuring cup size, cup depth, and nerve fibre layer height. In contrast, rim volume increased with age. Third moment in contour was not substantially affected by age (Fig 1). Although our finding that nerve fibre layer height decreases with age agrees with current theories,40 it is hypothesised that our findings for disc area, cup size and depth, and rim volume are more likely to be unique to our sample, as there is no histopathological evidence for such a trend. However, this phenomenon deserves further investigation.
The mean standard deviations for the height position of each pixel were largest in the glaucoma field loss group and smallest in the ocular hypertensive group. The difference between groups may, in part, be due to the age differences. The glaucoma groups were slightly older and therefore more likely to be affected by media opacities, smaller pupils, and degraded tear films all of which can lead to poorer image quality and increased intrasubject variability.
The HRT variables that measured rim volume (volume above reference), the average relative nerve fibre layer height at the disc margin (mean height contour), and cup shape (third moment in contour), distinguished between subjects with and without glaucomatous optic neuropathy (ocular hypertensive and glaucoma normal field), and between glaucomatous nerve heads with and without visual field abnormality (glaucoma normal field and glaucoma field loss). In spite of different study designs, our results for cup shape agree with Mikelberg et al,25 Burk et al,44 and Brigatti and Caprioli26; for rim volume with Mikelberget al 25 and Burk et al44; and for mean height contour with Tsaiet al 28 and Weinreb et al.27 Tsai et al 28 and Weinreb et al 27 did not investigate cup shape or rim volume. Brigatti and Caprioli26 did not investigate rim volume, and found no significant correlation between visual field results and mean height contour.
This study did not directly assess the ability of laser scanning tomography to identify patients who will develop glaucoma. The large standard deviations around the means shown in Table 3 indicate that there is significant overlap between groups. Therefore, it is hypothesised that the greatest potential clinical benefit of laser scanning tomography in glaucoma will be in the documentation of change within an individual, rather than in the comparison of an individual to established group normal limits. The results suggest that it will be critical to utilise previously established disc margin tracings when looking for change over time. Prospective cohort studies are being conducted to establish which HRT variables can best identify the subjects who will develop field loss.
In summary this study has shown that the HRT variables volume above reference (rim volume), third moment in contour (cup shape), and mean height contour (mean nerve fibre layer height) can distinguish between (1) subjects with elevated intraocular pressure and normal nerve heads, and glaucomatous optic nerve heads, and between (2) glaucomatous nerve heads with and without repeatable visual field abnormality.
Acknowledgments
This study was presented as a paper at the ‘Imaging of the optic nerve head and retina with the Heidelberg retina tomograph and flowmeter’ Conference, Manchester, England, 17 and 18 February 1995, and as a poster at the ARVO Annual Meeting, Fort Lauderdale, 14–19 May 1995.
This study was funded by the Medical Research Council of Canada (operating grant No 11023 to JF and GT), the Glaucoma Research Society of Ontario (to the THGRU) and the Canadian Optometric Trust Fund (to WH).
Each author states that s/he has no proprietary interest in the development or marketing of the Heidelberg retina tomograph or any competing instrument.
The authors wish thank Drs William Macrae, Robert Wagman, Maureen Wolpert, and all the other practitioners who aided in the recruitment of subjects for this study.