Article Text

Abstract
AIMS To determine the improvements in clinical and functional vision and perceived visual disability after first and second eye cataract surgery.
METHODS Clinical vision (monocular and binocular high and low contrast visual acuity, contrast sensitivity, and disability glare), functional vision (face identity and expression recognition, reading speed, word acuity, and mobility orientation), and perceived visual disability (Activities of Daily Vision Scale) were measured in 25 subjects before and after uncomplicated cataract surgery (10 first eye surgery and 15 second eye surgery) and in 10 age matched controls.
RESULTS Significant improvements were found after surgery in clinical and functional vision and perceived visual disability. Greater improvements were found after first eye surgery than after second eye surgery. However, first eye surgery did not return all scores to age matched normal levels. There were significant improvements in several of the tests measured after second eye surgery, and all postoperative values were similar to those from age matched normals.
CONCLUSIONS Significant improvements in clinical, functional, and perceived vision are obtained by cataract surgery. The improvements in objective measures of functional vision found in this study support previous findings of improvements in patients’ perceived functional vision. In addition, these data provide support to the necessity of second eye surgery in some patients to improve certain aspects of visual function to age matched normal levels.
- vision
- visual disability
- cataract surgery
Statistics from Altmetric.com
Cataract surgery with lens implantation has been shown to be a highly effective treatment for vision loss due to cataract.1-7 Despite considerable expenditure on cataract surgery in the UK, there is significant unmet need for surgery with long waiting times and poor visual acuity at listing within some ophthalmology units.8 Given the expected continued growth of the elderly population, this problem can only increase. About one third of cataract operations are performed on the ‘second eye’.4-7 Despite the obvious importance of second eye cataract surgery, only a small number of studies have assessed the usefulness of modern second eye surgery4-7910 (that is, after extracapsular cataract extraction and intraocular lens implantation) or compared the outcomes of first and second eye surgery.4-7 Most of these studies have measured perceived visual disability and Snellen visual acuity,4-7 while others have assessed patients’ symptoms and a wide range of clinical measurements such as visual acuity, contrast sensitivity, stereopsis, and anisometropia.910 In this study, we measured clinical vision (anisometropia, monocular and binocular high and low contrast visual acuity, contrast sensitivity, and disability glare), functional vision (face identity and expression recognition, reading speed, word acuity, and mobility orientation) and perceived visual disability (Activities of Daily Vision Scale5) in 35 subjects. Assessments were made before and after uncomplicated cataract surgery in 10 subjects undergoing first eye surgery and 15 subjects undergoing second eye surgery. The results were compared with data from 10 age matched controls who were tested on two separate occasions but did not undergo surgery.
Methods
Cataract subjects were volunteers recruited from a local ophthalmologist’s office in Waterloo, Canada. Informed consent was obtained, as was approval of the Office of Human Research of the institution. Because of logistical considerations all patients had to be tested within a 4 month period. Given the limited time span of the study which we knew would result in a relatively small number of subjects, strict inclusion criteria were used to keep the study sample as homogeneous as possible. Inclusion criteria were that subjects were scheduled for cataract surgery within the next month and had no signs of comorbid ocular disease. Second eye surgery subjects were only included if the pseudophakic eye had no surgical complications and visual acuities were better than 6/7.5. All patients were screened for neuromuscular, skeletal, or cardiovascular disorders that could interfere with mobility orientation using a self report questionnaire. Twenty eight cataract patients were recruited from a sample of approximately 120 patients, of which only about 50 were eligible for inclusion. The non-participants were generally older, with worse visual acuity and more comorbid ocular disease and systemic disease, particularly diabetes. Three patients could not attend for their second visit within the 4 month period because of ill health (two) and surgical complications. Pre and postoperative data from 15 patients (mean age 68.9 (SD 8.9) years) undergoing second eye surgery and 10 (mean age 72.9 (6.3)) undergoing first eye surgery were obtained. Surgery consisted of phacoemulsification with intraocular lens implantation in all cases. The time between preoperative and postoperative testing averaged 8.7 weeks for the second eye surgery group and 8.9 weeks for the first eye group (range 6–12.3 weeks). Owing to logistical considerations, mobility data were only obtained from 16 cataract patients (10 undergoing second eye surgery of mean age 67.4 (8.3), and six first eye surgery of mean age 72.8 (7.5)) and perceived visual disability data were obtained from 22 cataract patients (13 undergoing second eye surgery of mean age 68.5 (8.2), and nine first eye surgery of mean age 72.1 (6.2)). In addition, data were obtained from 10 age matched controls (mean age 69.1 (4.3)) who were tested twice with a mean test retest time of 4.2 weeks. Control patients were phakic with clear lenses and visual acuities of 6/7.5 or better. There were no significant differences between the ages of the three groups (F<1.2, p>>0.1).
CLINICAL VISION TESTING
Clinical tests were selected on the basis that they have established reliability and validity and that they allowed binocular measurement.11 Monocular and binocular measurements were made using the following tests: Bailey-Lovie high contrast visual acuity, low contrast visual acuity with and without glare and Pelli–Robson contrast sensitivity. All measurements were made using natural pupils and the optimal refractive correction for the test distance. The optimal distance refractive correction was determined by objective refraction using streak retinoscopy followed by subjective refraction including a determination of astigmatism using the Jackson cross cylinder technique. Anisometropia was calculated as the difference between the mean spherical refractive correction (sphere plus half the cylinder) of the two eyes. Bailey-Lovie high contrast logMAR visual acuity was measured at 6 metres. A chart luminance of 100 cd/m2 and a by letter scoring system (0.02 log units per letter) was used. Low contrast visual acuity was measured using the Berkeley glare test.12 This consists of a reduced low contrast Bailey-Lovie chart (Michaelson contrast 10%, Weber contrast 18%) mounted on a triangular opaque panel at the centre of a 30 × 27 cm opal Plexiglass panel. The chart is front illuminated (80 cd/m2) and the glare source provided by transillumination of the Plexiglass panel. At the medium setting the glare source luminance is 750 cd/m2. Measurements of low contrast visual acuity were made at 1 metre with and without the glare source, with credit (0.02 log minarc) given for each letter read correctly. Other reliable disability tests were considered,6 —for example, the Brightness Acuity Tester and the Straylight Meter, but were not used since they do not assess binocular performance. A disability glare score was calculated as the difference in low contrast visual acuity with and without the glare source.12 The Pelli–Robson chart is a 86 × 63 cm chart containing 4.9 × 4.9 cm letters arranged in 16 triplets. At a test distance of 1 metre these letters correspond to a spatial frequency of about 1–2 c/deg. Within each triplet the letters have the same contrast and the contrast in each successive triplet decreases by a factor of 0.15 log units. The chart luminance was 100 cd/m2 and a by letter scoring system that gives credit (0.05 log units) for each letter read correctly was used.13
FUNCTIONAL VISION ASSESSMENT
Functional vision was assessed using laboratory based tests which attempted to simulate real world tasks. These have been successfully used in a previous study using a cataract simulation14 and shown to provide reliable data.
Three real world tasks were adopted:
- (1)
Mobility orientation
- (2)
Reading speed
- (3)
Face recognition.
Safe travel relies on our ability to use and interpret visual information and select and implement adaptive strategies. Rather than study each of the many adaptive strategies in isolation, two travel paths were designed that required most adaptive strategies to be implemented by the subjects. These included a variety of obstacles, both on and above ground, of different shapes, sizes, and contrast placed in a variety of configurations. The travel paths were tortuous in order to emphasise the need for accurate navigation during locomotion. In addition to assessing visual perception, this approach also evaluates visual attention and search skills and requires changes in both upper and lower body movements. Mobility performance was assessed by recording the time needed to travel the path and the number of ‘mistakes’ made by the subject. A mistake was defined as contact with an obstacle, stopping, straying outside the pathway and avoidance strategies when none were required—that is, changing locomotor patterns when no obstacles were present. The vision of patients with media opacities is poor in dim illumination and is furthered hindered by glare sources (cataract patients particularly complain of problems with night driving). The illumination for the two pathways was less than 1 lux, to simulate twilight. One of the two travel paths included appropriately placed glare sources. A previous study using a course with illumination in the photopic range had shown no change in performance with simulated cataract and was not used.14
Reading speed was measured by having subjects read Bailey-Lovie word charts at 40 cm.15 These are non-continuous text charts with print ranging in size from 10M to 0.25M (80 point to 2 point) in 0.1 log unit steps. Subjects read aloud and were taped for analysis at a later time. Each subject read three different word charts. Reading speed for each print size was calculated in words per minute, and was averaged across the three charts. Consistent with previous reports, reading speed is relatively constant for print sizes greater than five lines above threshold size.15 Reading speed for 1M print (8 point) was determined as this was assumed to represent the size typically encountered in newspapers.
Face recognition was assessed using the method developed by Bullimore and colleagues.16 Black and white photographs of four male and four female faces were selected from ‘Pictures of Facial Affect’ (Consulting Psychologists Press, Palo Alto, CA, USA). For each individual, there were four different facial expressions; happy, sad, angry, and afraid or surprised giving a total of 32 photographs. The photographs were cropped to remove the hair outline so that identification was predominantly dependent on the facial features. The photographs were arranged in a letter chart format. There were five faces per line with each line decreasing in size by 0.15 log units. The angular size of the faces was expressed in terms of the equivalent viewing distance (EVD), the distance at which a real face would subtend the same angle that the photograph subtends. The subject’s performance was scored in the same way as the visual acuity charts with credit given (0.03 log units) for each correct answer. Two threshold scores were obtained: for correct recognition of identity and for correct recognition of expression. During testing subjects could refer to a panel with large photographs of the eight characters in neutral facial expressions.
PERCEIVED VISUAL DISABILITY
Perceived visual disability was assessed using the Activities of Daily Vision Scale (ADVS) instrument developed by Mangione and colleagues.517 ADVS scores differ from the clinical and functional vision scores as they relate to habitual vision (the patient’s vision with their own spectacles) rather than vision with the patient’s optimal refractive correction. The ADVS was administered by one investigator. All the questionnaires were administered in person preoperatively, and by telephone postoperatively. Mangione et al showed no significant differences when collecting ADVS data using these two different methods.17 The ADVS determines perceived disability in 20 visual activities, and provides an overall perceived visual disability score and scores in five subcategories of distance vision, near vision, glare disability, night driving, and daytime driving. The ADVS has been shown to be a reliable and valid measure of perceived visual disability in cataract.517
Results
Clinical and real world vision data assumed a normal distribution and parametric statistical analyses were used. The significance of any change from pre to postoperation was assessed using two tailed paired t tests. Because of multiple t test comparisons (25 for both groups), we would expect about one change in each group proving significant as a result of chance. The significance of differences between first eye, second eye, and control groups was assessed using one factor analyses of variance and post hoc Scheffe F tests. Some subjects could not see any of the letters on the low contrast visual acuity test preoperatively in the operated eye (11 with glare, three without) so that their mean data are from a smaller sample.
CLINICAL VISION SCORES
No significant changes occurred for any measurement in the control group or in the non-operated eye of those undergoing surgery from test to retest. Clinical vision pre and postoperative data from the first and second eye subject groups are shown in Table 1. There were significant improvements in all clinical measures for the operated eye (t test p values <0.05). Postoperatively, all clinical tests scores from the operated eye were statistically similar to the control (F2,32.<2.7, p>0.05).
Mean (SD) data of pre and postoperative monocular clinical vision scores from the operated eye and binocular data of 25 patients undergoing first (n=10) and second eye surgery (n=15). An improvement in score is shown as a positive change. Also shown are mean and SD data from 10 age matched controls
There were significant improvements for the first eye subject group in all binocular vision scores (all t test p values <0.01) except contrast sensitivity (Table 1, Figs 1 and 2). The second eye subject group only showed significant improvement for binocular high contrast visual acuity (p<0.01, Table 1, Fig 1). Binocular clinical vision scores were statistically similar to age matched normal levels postoperatively except for high and low contrast visual acuity and contrast sensitivity after first eye surgery (F2,32.>5.7, p<0.01, Table 1, Figs 1 and 2). The amount of anisometropia did not change significantly after first eye surgery and remained high at an average of nearly 2.00 DS (range 0.00 to 4.75 DS). However, anisometropia became significantly less after second eye surgery (p<0.05), falling from a mean of nearly 2.00 D to 1.00 D. Postoperative amounts of anisometropia were significantly different between the three groups (F2,32=2.61, p<0.05), and Scheffe post hoc testing indicated that this was due to differences between the first eye group and control only (p<0.05). That is, the second eye group’s anisometropia was not significantly different from control levels.

Pre and postoperative values of high contrast visual acuity after first (n=10) and second eye (n=15) cataract surgery compared with age matched control (n=10).

Pre and postoperative values of low contrast visual acuity (with and without glare) after first (n=10) and second eye (n=15) cataract surgery compared with age matched control (n=10).
FUNCTIONAL VISION TESTS
Mean and SD functional vision data before and after surgery are shown in Table 2 and Figure 3. There were significant improvements for the first eye subject group in face identity and face expression recognition, newspaper print reading speed, word acuity, and the number of hits in both travel pathways (all t test p values <0.05). The second eye subject group only showed significant improvement for face identity and face expression recognition and word acuity (p<0.05, Table 2, Fig 3). All real world vision scores were statistically similar to age matched normal levels postoperatively except for word acuity (F2,32 = 17.1, p<0.001) and face identity recognition (F2,32 = 4.3, p<0.03; Fig 3) after first eye surgery.
Mean (SD) data of pre and postoperative real world vision scores of 25 patients undergoing first (n=10) and second eye surgery (n=15). The mobility orientation data are from 16 patients (6 undergoing first eye surgery and 10 second). Also shown are mean and SD data from 10 age matched controls. An improvement in score is shown as a positive change
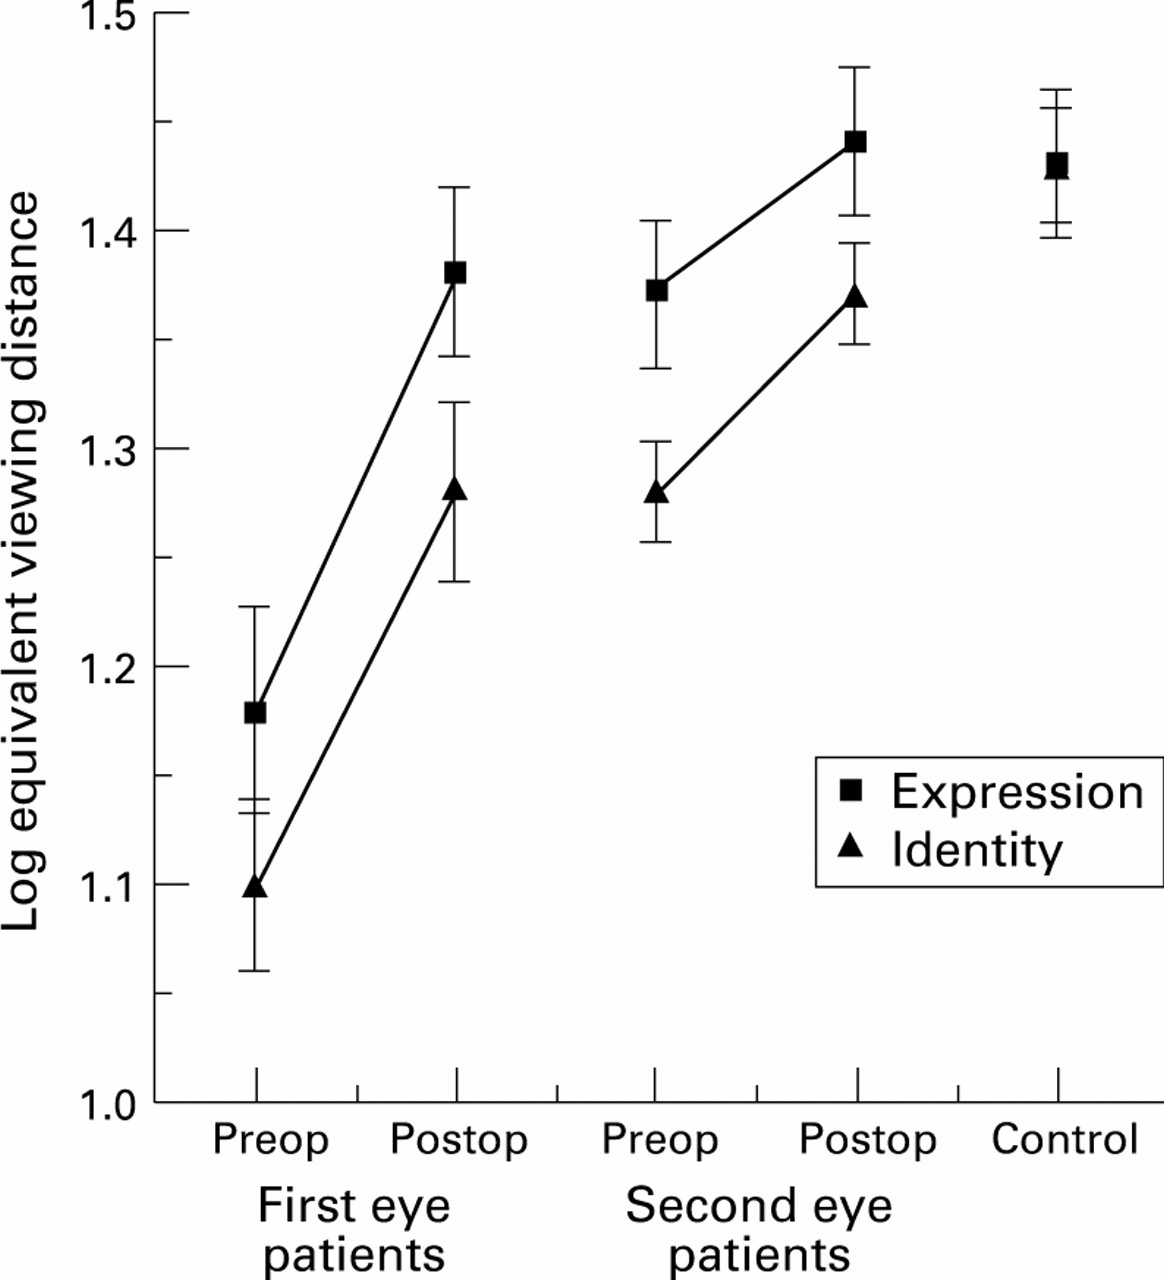
Pre and postoperative values of face identity and face expression recognition after first (n=10) and second eye (n=15) cataract surgery compared with age matched control (n=10).
PERCEIVED VISUAL DISABILITY
ADVS data did not assume a normal distribution because of a ceiling effect as many subjects could see well enough to perform certain tasks and scored a maximum 100, so non-parametric statistics were used. The percentage of subjects scoring the maximum 100 for the overall ADVS score and for the five subcategories of distance vision, near vision, glare disability, night driving, and daytime driving are shown in Table 3. The percentage of subjects scoring the maximum score improved after surgery. The overall and five subcategory ADVS scores are shown in Table 4. Most ADVS scores improved significantly after surgery (Table 4). Significant improvements in perceived visual disability were not found for near vision and disability glare in the first eye surgery group. All ADVS scores were statistically similar to age matched normal levels postoperatively except for night driving after first eye surgery (Mann–Whitney U test, z=−2.11, p<0.05).
Percentage of maximum scores (scores of 100) obtained using the ADVS on 22 patients undergoing first (n=9) and second eye surgery (n=13) and 10 age matched controls
Median and range data of pre and postoperative ADVS scores of 22 patients undergoing first (n=9) and second eye surgery (n=13) and median data from 10 age matched controls. Median improvement due surgery is also shown
Discussion
Mean monocular high contrast visual acuity of the 25 cataract subjects improved after surgery by over three lines from 0.37 (SD 0.28) logMAR (Snellen 6/14) to 0.01 logMAR (6/6). The preoperative mean of 6/14 is indicative of the early nature of the cataracts being extracted. Similar monocular improvements were found for low contrast visual acuity, contrast sensitivity, and disability glare (Table 1). All postoperative clinical vision scores of the operated eye were similar to normal age matched levels.1819
There was much less improvement in binocular clinical scores than those from the operated eye (Table 1). For example, binocular high contrast visual acuity improved by an average of 0.10 logMAR (one line) after surgery compared with the 0.36 logMAR (three and a half lines) improvement in the operated eye. This is because in patients with bilateral cataract, it is usual to operate on the eye with the worse vision first (all patients in this study had the eye with the worse visual acuity operated on), and binocular improvement relates to the improvement in the best monocular score. Preoperatively, the non-operated eye had the best visual acuity in all cases. Most binocular clinical vision tasks improved more after first eye surgery than after second, and in most binocular measurements the improvement due to second eye surgery was small. For example, there was a 0.15 logMAR (1.5 lines) high contrast visual acuity improvement after first eye surgery and a 0.08 logMAR improvement (0.8 lines) after second eye surgery. The 0.08 logMAR improvement after second eye surgery is similar to that found by Laidlaw et al (0.074 logMAR) with a much larger sample (n=208).10 It was surprising to find effectively no change in binocular low contrast visual acuity after second eye surgery yet two and three line improvements after first eye surgery (Table 1, Fig 2). The small changes after surgery in Pelli–Robson CS were also unexpected as Laidlaw et alfound a 0.21 Pelli–Robson CS improvement after second eye surgery.10 This may indicate the very early nature of the cataracts in this study as Pelli–Robson CS has been shown to be relatively unaffected by early cataract.20 One aspect of clinical binocular vision, anisometropia, did not improve after first eye surgery, but did after second eye surgery (Table 1). Anisometropia remained at an average of nearly 2 dioptres after first eye surgery, but returned to near normal levels after second eye surgery. Laidlaw and Harrad also found an improvement in anisometropia after second eye surgery.9 Milder21 suggests that anisometropia is responsible for more problems than any other refractive error, and within this group asymmetric index myopia caused by nuclear lens sclerosis provides the greatest problems. In addition to blurred distance vision, anisometropia can produce complaints of depth perception problems and asthenopia.2122 Correcting the anisometropia can produce further symptoms as a result of spectacle induced aniseikonia and anisophoria.2122 Returning anisometropia to normal levels is therefore a highly desirable aspect of second eye surgery. In addition, although all scores were at normal levels postoperatively after second eye surgery, scores were below normal after first eye surgery for high and low contrast acuity and contrast sensitivity (Figs 1 and 2). So, although the greatest improvement in most binocular clinical vision tests is gained after first eye surgery, further improvement can be provided by second eye surgery, particularly for anisometropia. Laidlaw and Harrad showed improvements in symptoms, binocular summation of visual acuity and contrast sensitivity, stereopsis, and anisometropia in 28 subjects following second eye cataract surgery, although there was no comparison with first eye surgery.9
There were significant improvements in the functional vision tests after first eye surgery. For example, mean face expression recognition improved from 1.18 log EVD (15 metres) to 1.38 log EVD (24 metres), so that patients could now recognise facial expressions an average of 9 metres further away. Mean newspaper print reading speed improved from 1.66 log wpm (45 wpm) to 1.85 log wpm (70 wpm), so that patients could read newspaper print an average of 65% faster after surgery. The number of hits on the travel pathways reduced by an average of four or five and the time taken also reduced by between 12% and 20%. The majority of falls are the result of trips23 and serious injury due to falls is a significant problem to the aging adult. It has been suggested that falls cause more than two thirds of the accidental deaths in the over 75 age group.24 The reduction in the number of hits around the travel pathway after cataract surgery suggests that surgery may prevent trips and subsequent falls occurring. The 12–20% reduction in travel time should also be considered. The consequences of a long travel time, such as when crossing a road, can also be serious. Similar improvements in patients’ perceived ability to recognise friends at a distance, read newspapers, and in mobility/orientation after surgery have also been reported2-7 and the improvements in objective measurements of functional vision found in this study support these subjective findings.
The improvement in the functional vision tasks after second eye surgery was relatively small (Table 2, Fig 3). Mean face expression recognition improved from 1.28 log EVD (19 metres) to 1.37 log EVD (23 metres), an improvement of 4 metres. This compares with the improvement after first eye surgery of 9 metres. However, the equivalent viewing distance for mean face expression recognition was below age normal values after first eye surgery (19 metres v 27 metres), but returned to near normal values after second eye surgery (23 metres). Similarly, word acuity was below age normal values after first eye surgery but returned to near normal values after second eye surgery. For the functional vision tests used, second eye surgery showed a smaller improvement than first eye surgery, but did improve some aspects of functional vision from below normal to near normal levels. It may be that other aspects of functional vision which were not assessed in the study may improve after first and second eye surgery. Hand-eye coordination tasks which requires good binocular vision and stereopsis and perhaps night driving may be particularly improved by second eye surgery and this requires further investigation. The smaller improvement in objective functional vision after second eye surgery compared with after first support results which have found smaller improvements in patient’s perceived visual disability after second eye surgery.67
Some subjects had a maximum 100 score in certain subcategories of ADVS before surgery, indicating that they had no problems with certain aspects of their vision before surgery. The percentage of subjects scoring the maximum score improved after surgery. All subjects had some problems with night driving before surgery, as no subjects scored a maximum 100. Even after first eye surgery, all subjects still had some problems with their vision for night driving, yet after second eye surgery, approximately one third of subjects were completely happy with it. The largest increases occurred for the percentage of subjects completely happy with vision for day driving. This increased from 0 to 57% after first eye surgery, and from 25% to 75% after second eye surgery.
The preoperative ADVS scores of both groups in this study were appreciably higher than those reported by Mangione et al.517 For example their overall ADVS scores preoperatively were 67 and 72 for first and second eye surgery groups respectively5 compared with values of 75 and 86 found in this study. This reflects the early nature of the cataracts undergoing surgery in this study and the exclusion of subjects with coexisting eye disease. All ADVS scores were statistically similar to age matched normal levels postoperatively except for the night driving subcategory after first eye surgery. There were slightly greater improvements in the median overall ADVS scores after first eye surgery than after second eye surgery (Table 4). The median overall ADVS score improved by 16 for the first eye surgery patients and by 9 for the second eye surgery patients. This may in part be due to the ceiling effect, in that ADVS scores in several subcategories were already at or near the maximum 100 and could not improve substantially, particularly in the second eye subject group (Tables 3 and 4). Mangione et alfound similar improvements in ADVS scores after first and second eye surgery,5 as did Javitt et al using a different instrument.4 More recently, two reports have shown that patients who went on to have second eye surgery obtained a significant improvement in perceived visual disability after second eye surgery, but one which was smaller than after first eye surgery.67 One of these reports also found improvements in perceived quality of life after second eye surgery, although once again the improvement was not as great as after first eye surgery.7
In summary, significant improvements in binocular clinical vision tests and objective assessments of functional vision were found after cataract surgery. The improvements in functional vision support the improvements in patient perceived functional vision found by other studies.2-7 There were greater improvements in most of the binocular clinical and functional vision tests and perceived visual disability scores for the first eye surgery group than for the second eye surgery group. However, not all vision assessments returned to normal age matched levels after first eye surgery (high and low contrast visual acuity, contrast sensitivity, anisometropia, face identity recognition, word acuity, patient’s problems with night driving). In addition, there were significant improvements in some of the binocular measurements after second eye surgery (high contrast visual acuity, anisometropia, face identity and face expression recognition, word acuity, all perceived visual disability tasks) and all postoperative second eye surgery values approached age matched normal levels. These data provide support to the necessity of second eye surgery in some patients to improve certain aspects of visual function to age matched normal levels.
Acknowledgments
Presented at the ARVO annual meeting, Sarasota, May 1994.
Supported by a grant from the Atkinson Charitable Foundation, Toronto.
We would like to thank Stephanie Millar and Cynthia Merritt for collecting some of the data, and Dr Hugh Jellie for access to his patients.