Article Text

Abstract
BACKGROUND/AIMS A photostress recovery test was designed to differentiate macular diseases from optic nerve disorders, but recently an abnormal recovery time was reported in glaucoma. The purpose of this study was to search for the difference in abnormality of the photostress recovery test between glaucoma and idiopathic central serous chorioretinopathy (ICSC).
METHODS This study involved 21 normal subjects, 14 patients, with ICSC and 10 patients with primary open angle glaucoma (POAG). A scanning laser ophthalmoscope (SLO) was used with microperimetry for bleaching the test point and measuring the recovery of sensitivity. Photostress recovery time (SLO-PSRT) could be measured at extrafoveal points outside and inside the affected area. The initial sensitivity change and the time constant of recovery after bleaching were calculated by fitting an exponential equation to the data.
RESULTS In normal subjects, neither the initial sensitivity change nor the time constant were correlated with the location of the test point. In 14 patients with ICSC, the initial sensitivity change in the detached area was significantly smaller than that in the unaffected area which was not significantly different from that in the age matched normal subjects. The time constant in the detached area was significantly longer than that in the unaffected area, which was not significantly different from that in the normal subjects. In 10 patients with POAG, the initial sensitivity change inside and outside the scotoma was not significantly different from that of age matched normal subjects. The time constant inside the scotoma was significantly longer than that outside the scotoma, which was not significantly different from that of the age matched normal subjects.
CONCLUSION Both ICSC and POAG showed a prolonged time constant of recovery, but the initial sensitivity change was reduced only in ICSC. The difference in our results between ICSC and POAG may be caused by the difference of the retinal pathology. Further, the SLO-PSRT is very useful when the lesion is located outside the fovea.
- glaucoma
- idiopathic central serous chorioretinopathy
- photostress recovery test
- scanning laser ophthalmoscope
Statistics from Altmetric.com
- glaucoma
- idiopathic central serous chorioretinopathy
- photostress recovery test
- scanning laser ophthalmoscope
The photostress recovery test (PSRT) measures the time to recovery of light threshold after bleaching,1-5 which mainly depends on resynthesis of visual pigments. This test has been used to evaluate macular function. Previous reports demonstrated prolonged photostress recovery times in patients with idiopathic central serous chorioretinopathy (ICSC),1 age related macular degeneration,6 7 diabetic retinopathy,7 Anandron,8 or digitalis toxicity.9 Abnormal recovery times in retinal diseases or toxicity suggests that the pathology in these conditions involves the outer layer of the retina or the pigment epithelium. Optic nerve diseases can be differentiated from retinal diseases with the PSRT,5 because optic nerve dysfunction does not affect the PSRT. However, a prolonged recovery time,10 11 or delayed dark adaptation,12-14 were reported in glaucoma, which mainly affects ganglion cells. This suggests that a ganglion cell abnormality may delay recovery or that glaucoma may cause visual pigment abnormality.
The purpose of this study is to investigate the difference in abnormality of photostress recovery between retinal diseases with affected photopigment, and glaucoma. ICSC was the first disease in which PSRT was tested, and in this disease a prolonged recovery time and abnormal kinetics of visual pigment were found. Therefore, we tested patients with ICSC as a model of retinal diseases with abnormal visual pigment.
PSRT can be performed using an acuity chart (conventional PSRT),1-5 a pattern VEP (VEP-PSRT),11 15 16 or a pupillometer (pupil PSRT).17 Conventional and VEP-PSRTs measure macular function, and pupil PSRT tests the central 30° area of the visual field. On the other hand, the extrafoveal PSRT technique which we have developed with microperimetry in a scanning laser ophthalmoscope (SLO) (Rodenstock, Germany) can measure the recovery time while monitoring the fundus continuously, and at any points on the TV monitor of a SLO (SLO-PSRT). Previous reports on the PSRT in glaucoma used conventional and VEP-PSRTs, but defects of the visual field are often located outside the fovea. We tested the points inside and outside the scotoma, using an extrafoveal PSRT technique. In ICSC, the recovery time was also measured inside and outside the detachment and the results were compared with those in glaucoma.
Subjects
This study involved 21 normal subjects (age 40.4 (SD 14.0) years, sex: 10 males and 11 females), 14 patients with ICSC (age 42.7 (8.2) years, sex: 11 males and three females), and 10 patients with primary open angle glaucoma (POAG) (age: 48.6 (13.2) years, sex: seven males and five females). All of the subjects had little opacity of the crystalline lens and normal visual acuity. Since aging affects the kinetics of visual pigments, an age matched control group was selected from 21 normal subjects for glaucoma and ICSC (age 46.6 (18.4) years, sex: three males and seven females). All subjects in the ICSC group had macular detachment with one or two leaking points seen in fluorescein angiograms. Indocyanine green (ICG) angiogram was performed on all subjects, and revealed abnormality in the choroid as reported previously.18 19 None underwent photocoagulation therapy before our examination or had a history of other chorioretinal diseases. The visual acuity was better than 0.8, and the intraocular pressure was normal. All patients in the POAG group had scotoma in the upper visual field (Bjerrum area) and the visual acuity was normal. The intraocular pressure was kept at less than 20 mm Hg with β blocker eyedrops only at the time of our testing. Mydriasis was full in all patients. Since acetazolamide alters the function of the retinal pigment epithelium,20 21 patients using this medication were excluded. All patients in POAG group had been followed by one of the authors (MH) for more than a year and the diagnosis was made carefully by routine examinations. None of the normal subjects has a history of chorioretinal disease or colour vision defects, and fundus examination using a SLO and fluorescein angiogram revealed no lesions.
Methods
The SLO-PSRT required an unmodified and commercially available SLO, a Wratten filter (No 21, Eastman Kodak) and a personal computer for fitting an equation to the data. The SLO-PSRT was performed in the following manner.
After the subjects’ pupils were dilated with a combination of 0.5% tropicamide and 0.5% phenylephrine hydrochloride, the subjective threshold for the red target was measured by microperimetry with a SLO at testing points. The recovery time was defined as the time from the end of bleaching to recognition of the red test spot. The size of the test spot was 0.86 degrees in diameter and the intensity of the background illumination of 10 cd/m2. The test spots, background illumination and a fixating point were all 633 nm in wavelength and stemmed from a He-Ne laser. Therefore, the colour of test targets and background illumination is different from that in conventional or VEP-PSRT, but it does not seem to affect the results in PSRT.
After subjects had dark adapted for 15 minutes, argon green bleaching illumination (argon green 9), 514 nm in wavelength, and an intensity of 4.7 log cd/m2 was projected onto the fundus for 20 seconds. When we measured the recovery time at the extrafoveal points, we only bleached the small area including the testing point using a Wratten 21 filter on the instrument window of a SLO, which absorbed all light below the wavelength of 520 nm. The filter placed on the window was not confocal with the retina but did not affect bleaching light or test spot focused on the retina. The fovea was left unbleached so that the subjects could see the central fixating point during and after bleaching. This filter blocked the bright green illumination (514 nm) bleaching the retina but did not prevent the subjects from seeing the red background illumination and the 633 nm fixating point. Figure 1A shows the image on the fundus monitor of a SLO during extrafoveal bleaching. The area with stripes was covered with a Wratten filter, a cross indicates a fixating target, and “A” indicates a testing point. When we tested the fovea, we bleached only the central area including the fovea, leaving the extrafoveal area unbleached by the filter on the instrument window of the SLO. Four fixating points were placed in the unbleached area. Figure 1B shows the image of the fundus during foveal bleaching. The area with stripes was covered with Wratten filters, four crosses indicate fixating targets, and “A” indicates a testing point. This technique reduces the amount of light entering the eye, thus reducing the subjects’ discomfort. As soon as the bleaching was completed, the test spot 6 dB in intensity above threshold was presented about every 3 seconds on a background illumination of 10 cd/m2. Subjects indicated that they had located the red test spot by pressing a button, and immediately after they had done so the spot 4 dB above threshold was presented every 3 seconds from then on. In the same manner, spots 6 dB, 4 dB, 2 dB, 1 dB, and 0 dB in intensity above threshold were presented, and the recovery times to each spot were measured. The fundus was monitored during all procedures so that steady fixation could be confirmed.

(A) The image on the fundus monitor of a SLO during extrafoveal bleaching. The area with stripes was covered with a Wratten filter. A cross indicates a fixating target and “A” indicates a testing point. (B) The image of the fundus monitor during foveal bleaching. Four crosses indicate fixating targets and “A” indicates a testing point.
Figure 2 illustrates the testing points in this study. In order to test the effect of the location of the test spot on PSRT, the recovery times were measured at the points, 7.5° temporally, nasally, above and below from the fovea, 15° temporally and at the fovea in 12 normal subjects (age 37.3 (16.0) years) (Fig 2A). The recovery times were measured at extrafoveal points inside and outside the detachment in the ICSC group (Fig 2B). The recovery times were measured at the points inside and outside the scotoma in the POAG group (Fig 2C).
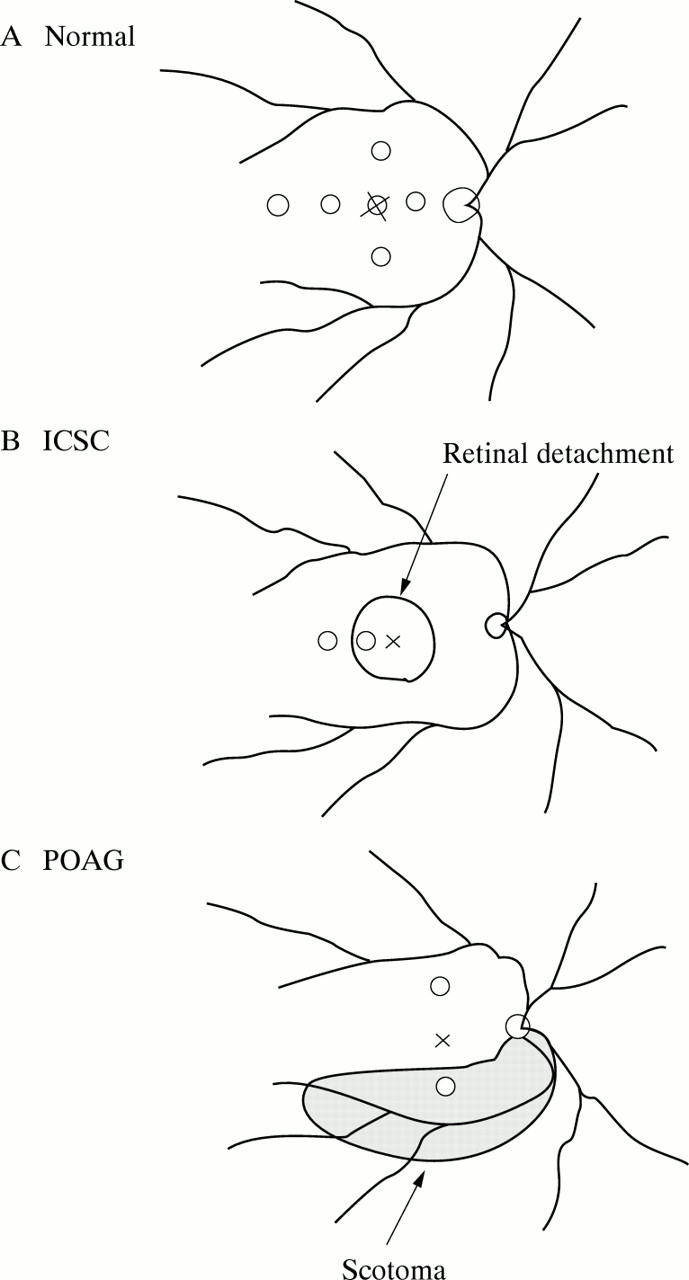
(A) Location of the testing points for 12 normal subjects. The recovery times were measured at the points, 7.5° temporally, nasally, above and below from the fovea, 15° temporally and at the fovea. (B) Location of the testing points in idiopathic central serous chorioretinopathy (ICSC) group. (C) Location of the testing points in primary open angle glaucoma (POAG) group.
The recovery times and the intensities of test spots were fitted by the following exponential equation, and two variables, to and A + B, were evaluated.
R(t) = Ae-t/to + B where R(t)= intensity difference (intensity of test spot threshold intensity); A = initial change of sensitivity; to = time constant of recovery; t = recovery time
Our foveal densitometer22 indicated that the bleaching light in SLO-PSRT bleached about 60% of the red cone photopigment in one of the authors (MH). The intensity of the light was measured before and after each measurement to confirm consistence of laser power.
Results
In all subjects, the recovery times and the intensities of the spot were fitted well by the exponential equation. Figure 3 illustrates the recovery times (mean (SD)) to test spots of five intensities at 7.5° temporal points in normal subjects. Figure 4A and B show two variables of the PSRT at six points in normal subjects. No significant differences in either the initial sensitivity change or time constants were found among testing points (paired t test, p >0.05). Threshold for the red target was lowest in the fovea (pairedt test, p,<0.0001, fovea v other points), because the density of cone pigment is the highest (Fig 4C). These results indicate that the PSRT does not correlate with location of the test spot and we can directly compare the variables of the PSRT obtained at two different points on the fundus. Figure 5A and B show two variables at the points inside and outside the detachment in the ICSC group. The initial sensitivity change was significantly reduced inside the detachment compared with that outside the detachment (pairedt test, p=0.001). The time constant was also significantly longer inside the detachment than outside the detachment (pairedt test, p=0.001). Both variables outside the detachment were not significantly different from those in normal subjects. Figure6A and B shows two variables at the points inside and outside the scotoma in the POAG group. The time constant was significantly longer inside the scotoma than outside the scotoma, but no significant difference was found for the initial sensitivity change. Both variables outside the scotoma were not significantly different from those in normal subjects.

The recovery times to test spots of five intensities at 7.5° temporal point in normal subjects.

The initial sensitivity change(A), the time constant (B), and the threshold for the red target (C) at six points in 12 normal subjects.

The initial sensitivity change (A) and the time constant (B) in normal control group, and outside and inside the lesion in ICSC group. The closed circles indicate individual datum points.

The initial sensitivity change (A) and the time constant (B) in normal control group, and outside and inside the lesion in POAG group. The closed circles indicate individual datum points.
Discussion
The PSRT has been tested at the central portion of the retina, but the peripheral region should be tested in cases in which the lesion is located outside the fovea, such as in glaucoma. Even in macular diseases, it will be beneficial if we can compare the results of the PSRT inside and outside the lesion. Our technique can perform the PSRT at any region of the field of view. The advantage of the SLO is that we can monitor the fundus in all processes of this test, which allows us to check whether or not the bleaching light and the test spot are located on the testing point. However, this technique has several limitations; measurement of sensitivity is manual, the bleaching light is 514 nm in wavelength, and the test spot is 633 nm. The light 514 nm in wavelength was more effective for the middle wavelength sensitive cones (M cones) than the long wavelength sensitive cones (L cones). On the other hand, the test spot 633 nm in wavelength was absorbed only by the pigment in L cones.23 Therefore, SLO-PSRT tests only L cones system. This test can be performed with only a Wratten filter and a commercially available SLO which is widely used in the world.
The exponential equation fitted to the data in the PSRT was applied in the pupil PSRTs in optic nerve diseases.17 The time constants of the PSRT at extrafoveal points and the fovea in the normal group are shorter than those observed in densitometry.24They are also shorter than those observed in the pupil PSRT.17 This is probably because the technique used for measuring sensitivity was different. Threshold for the red target measured before bleaching was the lowest at the fovea, because it has the highest density of visual pigment. However, neither the initial sensitivity change nor the time constant showed a significant difference among the testing points, suggesting that both variables are identical throughout the fundus as viewed on the TV monitor of a SLO and independent of the density of cone cells. Therefore, it will be possible to compare these variables obtained at different points with each other.
Normal initial sensitivity change and time constant were observed at testing points outside detachments in the ICSC group. Abnormal findings in ICG have been reported, suggesting that a choroidal abnormality is one of the causative factors of this disease.18 19 In our cases, ICG did not reveal a circulatory disturbance at these testing points outside the lesion. These results suggest that the bleaching and recovery processes are functioning normally in the area without retinal detachment and choroidal abnormality. Slow regeneration of visual pigment in the detached area has been reported using conventional PSRT1and foveal densitometry.24 Densitometry revealed a reduced two way density and a prolonged time constant, indicating a reduction and abnormal kinetics of the visual pigment. Prolonged time constants in the PSRT in our ICSC group confirms previous results with the conventional PSRT and coincides with the data in densitometry.
In the glaucoma group, the initial sensitivity change and time constant outside scotoma did not reveal a significant difference from those in the normal group, indicating that bleaching and regeneration processes were not affected outside the scotoma. Inside the scotoma, the time constant was significantly prolonged but the initial sensitivity change showed no significant difference from that of the normal group. The prolonged time constant found in our study is in accord with previous studies in glaucoma using the conventional PSRT10 and VEP-PSRT,11 in which the authors did not address whether abnormalities of the retinal inner layers or the retinal outer layers caused the delayed recovery times found. In our study, the results inside the scotoma in glaucoma did not show the reduction of the initial sensitivity change that was observed in the ICSC group, which may suggest some difference in mechanism for the prolongation of the recovery time between these diseases. Many studies25-28have demonstrated abnormalities of the nerve fibres in glaucoma, which correlate with visual field defects, and Panda and Jonas29have indicated a decreased photoreceptor count in traumatic glaucoma. A reduction in the photoreceptor count may result in abnormal a-waves of electroretinograms as found in previous reports.30-32However, a loss of cone cells does not explain the prolongation of the time constant in our study, because the results from our normal group suggest that the variables in the SLO-PSRT are independent of the density of cone cells. If a prolonged time constant was caused by abnormal visual pigment, retrograde trans-synaptic degeneration might occur in the outer segments, because the time constants were prolonged only inside scotoma. Retrograde trans-synaptic degeneration in the inner nuclear layers has been reported to occur in optic nerve damage,33 34 but it is unknown whether or not such change can occur in the outer segments. If abnormal nerve fibres affect the recovery of sensitivity, then it could partly explain our results. The relation between regeneration of cone pigment and the recovery of visual sensitivity has been studied previously. Dowling and Rushton found a linear relation between log threshold and the fraction of unbleached pigment.35-37 However, Eisner has suggested that there is a contribution of neural components to the recovery of visual sensitivity.38 Our results probably imply that neural components contribute to the recovery of sensitivity, and they can be removed by nerve fibre damage in glaucoma, but this issue requires further investigation.
In summary, our results in this study suggest that the mechanism of a prolonged recovery time in glaucoma was different from that in ICSC. Further, SLO-PSRT, requiring just an ordinary SLO and a Wratten filter, can measure PSRT in extrafoveal area, and fitting the equation provides more information than conventional or VEP-PSRT. Our technique will be very useful for the diagnosis and study of cases where the lesion is located out side fovea.
Acknowledgments
This research is supported in part by Grant in Aid for Scientific Research from Ministry of Education, Science and Culture of the Japanese Government (05404058).