Article Text

Abstract
Aim To evaluate an interferon γ release assay in the diagnosis of uveitis associated with tuberculosis (TB), in the absence of a gold standard.
Methods We conducted a prospective 1-year study on consecutive patients with a new diagnosis of uveitis presenting with ocular signs suggestive of TB-associated uveitis (TAU). All subjects underwent ocular and systemic review with investigations, including T-SPOT.TB assay and tuberculin skin test (TST). The main outcome measures were sensitivity and specificity; positive and negative predictive values (PPV, NPV) of T-SPOT.TB were estimated using Bayesian statistics (presented with 95% Bayesian credible intervals (CrI)).
Results Analysis after exclusion of patients with indeterminate results and other diseases included 191 patients, with mean age of 47.2±15.3 years. The majority were Chinese (n=110, 57.6%) and women (n=102, 53.4%). The TST (0.70, 0.65 to 0.75) was more sensitive compared to T-SPOT.TB (0.53, 0.42 to 0.66) but the T-SPOT.TB (0.91, 0.88 to 0.93) was more specific than TST (0.71, 0.58 to 0.83). The T-SPOT.TB had a higher PPV (0.88, 0.80 to 0.93) compared to the TST (0.76, 0.57 to 0.90), but a lower NPV (0.60, 0.38 to 0.78) than the TST (0.65, 0.46 to 0.78). Patients who are TST and T-SPOT.TB positive are very likely (95.1% likelihood) to have TAU (39/41 95% CrI 35 to 41). Based on statistical decision theory, in populations where the prevalence of TAU is high the TST should be the first-choice test; the T-SPOT.TB should be performed if the prevalence of TB is low.
Conclusions The T-SPOT.TB assay is more specific but less sensitive than the TST and should be used in preference to the TST in low-TB-prevalence populations. Used in conjunction, the likelihood of TAU is greatest if the T-SPOT.TB and TST are both positive.
- Inflammation
- Infection
- Diagnostic tests/Investigation
Statistics from Altmetric.com
Introduction
The diagnosis of uveitis associated with tuberculosis (TB) is controversial.1 The term ‘ocular TB’ implies that there is a true tubercular infection of the eye.2 However, most patients have no evidence of Mycobacterium tuberculosis (MTB) in their ocular biopsies.3 ,4 In addition, tests that detect the growth of MTB in cultures, acid-fast bacilli (AFB) on smears, or MTB DNA using currently available PCR in ocular biopsies often yield no results.2
A presumptive diagnosis of TB-associated uveitis (TAU) is made in patients with uveitis and a positive tuberculin skin test (TST), a positive interferon γ release assay (IGRA), lesions suggestive of pulmonary TB on a chest x-ray (CXR) and/or evidence of associated systemic TB infections in the absence of any other underlying disease.2 The TST or Mantoux test has a low specificity due to a false-positive response in patients infected with non-tuberculous mycobacterium (NTM) or vaccinated with bacillus Calmette–Guérin (BCG).5 Thus, there has been increasing use of the T-SPOT.TB assay (Oxford Immunotec, Oxford, UK), which is reported to be more specific and more sensitive than the TST in diagnosing pulmonary TB.6
When evaluating new medical diagnostic tests, data may be obtained from one or more tests, but none of these can be considered a gold standard, ie, a diagnostic test with 100% sensitivity and specificity.7 ,8 Bayesian analysis allows the disease prevalence, sensitivity and specificity of a diagnostic test to be estimated in the absence of a gold standard test without placing constraints on any of the test parameters.8 Several studies have already used this approach to evaluate diagnostic tests, especially for infectious diseases where few patients have positive culture results, as well as for diseases with latent forms of infection (such as in the case of TB infection).9–15 In this study, we used the Bayesian approach to evaluate the utility of the T-SPOT.TB as a diagnostic test for TAU in the absence of a comparative gold standard test, and we used the ‘traditional’ TST as a comparative test.
Materials and methods
Study participants and overview of management
We conducted a prospective study of consecutive patients presenting with a new diagnosis of uveitis to the Singapore National Eye Centre Ocular Inflammation and Immunology Service over a 1-year period. Ethics approval was obtained from our local Singhealth institutional review board, and our research adhered to the tenets of the Declaration of Helsinki. Patients were enrolled if they had clinical ocular signs indicative of TAU such as extensive or broad posterior synechiae, vasculitis, granulomatous inflammation or serpinginous choroiditis,16 ,17 and consented to participate in the study.
Briefly, all of the study subjects underwent a full systemic review, ocular examination and standard baseline investigations.18 Blood was taken for the T-SPOT.TB before the TST was performed. Patients were excluded if they had (1) any other possible infectious or non-infectious cause that could account for the uveitis or (2) a T-SPOT.TB result that was ‘indeterminate’.19
Investigations
All of the subjects underwent a complete blood count, erythrocyte sedimentation rate analysis, liver enzyme panel analysis and infectious disease screening, which included a venereal disease research laboratory (VDRL) test for syphilis, as well as a TST, urine microscopy and a CXR. Other tests such as human leukocyte antigen (HLA)-B27 screen, IGRA, an AFB smear from throat swabs and PCR assays for TB DNA from aqueous humour samples were performed if the patient consented to the procedure. The T-SPOT.TB was performed according to the manufacturer's instructions, and blood was taken before the TST was administered.6 The T-SPOT.TB test was considered positive if there were >8 spots compared with the negative control well, negative if there were <4 spots compared with the control well or equivocal if the test wells had 5–7 spots more than the control. If the negative control well had >10 spots and/or <20 spots in the mitogen-positive control wells, the result was considered to be indeterminate.19 Indeterminate T-SPOT.TB results were excluded as these results have been considered to be invalid and should be repeated—if considered they would have affected our statistical analysis, which relies on a binary outcome. The TST was performed with the standard Mantoux method: intradermal injection of 0.1 ml (2 tuberculin units) purified protein derivative (RT23 SSI–2 T.U./0.1 ml Statens Serum Institut, Copenhagen, Denmark).20 Induration was measured at 72 h with a ruler and considered positive if it was more than or equal to 15 mm (as validated in our population).
Statistical analysis
The study cohort was described using frequency with percentages or mean with SD. ‘Classical’ estimates such as sensitivity and specificity are fixed quantities (unknown parameters but not random variables) based on direct empirical comparisons to an established ‘gold standard’. In contrast, Bayesian statistics considers unknown parameters as random variables, to which probabilistic statements about parameters of interest can be made from the posterior distribution (combining information from sample data, expressed formally by the likelihood function and the prior distribution). Bayesian inferences can be computed exactly even in complex situations and can be used to estimate the true prevalence of a disease and the accuracies of tests in the absence of a well defined ‘gold standard’, which is a difficult problem to deal with using the well known ‘classical’ approach.
We used a Bayesian latent class model to evaluate the frequencies of true positives diagnosed from TST and the T-SPOT.TB tests as well as the sensitivities and specificities of the tests. As the ‘true’ numbers of patients with uveitis due to TB are unknown, these were termed as ‘latent data’ for the purposes of this analysis.9 The Gibbs sampler algorithm, an iterative Markov-chain Monte Carlo technique, was used to estimate these unobserved data using the R and WinBUGS program.21 We used the WinBUGS software (V.1.4.3), running from R V.2.13.2 (R Development Core Team, 2011) to implement the Gibbs sampler, using specific marginal posterior densities.21 Convergence of estimation was checked and confirmed using the Gelman–Rubin convergence statistics.21
Statistical analyses were performed in three parts, outlined below.
Prevalence, sensitivity, specificity, negative and positive predictive value estimation
The sensitivity (S) and specificity (C) of each test, as well as the prevalence of TAU (π), were the proposed model parameters to be estimated. Positive predictive value (PPV) and negative predictive value (NPV) can then be calculated with the three estimated parameters using Bayes’ formula (see the formulae in the online supplementary material).
The β distribution is a very flexible distribution family that applies to an unknown quantity that takes values between 0 and 1 (ie, proportions). Hence it is appropriate to be used as the prior distribution for the prevalence of TAU, sensitivity and specificity of each test. Due to the lack of similar studies, we used the information from a meta-analysis of published studies representing different populations, which analysed the sensitivity and specificity of each test in the absence of a gold standard, as the next best alternative.7 The prior information for sensitivity and specificity of TST and T-SPOT.TB that were used are presented in table 1. We then confirmed the robustness of this analysis by performing sensitivity analyses with multiple trial data (described below). The shape of the β distribution is determined by a two parameter specification, α and β. Based on the obtained prior information, α and β were calculated to be 219.84 and 90.01 for prior distribution of sensitivity of TST, 22.14 and 10.27 for specificity of TST, 17.64 and 17.64 for sensitivity of T-SPOT.TB and 560.31 and 58.48 for specificity of T-SPOT.TB. A non-informative or uniform prior distribution was used for prevalence of TAU for our study cohort (ie, α=1 and β=1).
Prior distribution and the estimated sensitivity and specificity and the positive and negative predictive values for the TST and T-SPOT.TB assay with 95% Bayesian credible interval
Analysis of the TST and T-SPOT.TB in combination
In order to obtain the marginal posterior distribution of the three parameters (S, C and π), as well as that of the PPV and NPV, prior information was integrated into the likelihood function of disease diagnosis as described above. We then estimated the number of ‘true positives’ using a multinomial distribution incorporating prior information and reported the results as a median with a 95% Bayesian credible interval (CrI).
Sequential testing of the TST and the T-SPOT.TB
The choice of the diagnostic test sequence was analysed using statistical decision theory by choosing the smaller risk of the decision rules.22 The two decision rules were: (1) to perform TST first followed by T-SPOT.TB or (2) to perform T-SPOT.TB first followed by TST. A ‘0–1 loss function’ was used to calculate the risk of performing a diagnostic test where a loss or a risk was calculated for misclassification, ie, false positive or false negative. The formulae used to calculate the risk of a diagnostic test, ie, the misclassification rate, is provided in the online supplementary material. Lastly, sensitivity analyses were performed to validate our model results. Multiple trial or mock data were applied into our Bayesian model to investigate if our data or the priors are driving model results. Varying posterior distributions should be observed with the application of multiple trial or mock data (ie, changing likelihood functions) to suggest that posterior distribution was calculated by the likelihood (ie, data) incorporated with prior information rather than prior distribution alone influencing the results.
Results
Patient demographics and clinical results
A total of 215 consecutive patients with a new diagnosis of uveitis were enrolled during the study period. After an initial assessment, we excluded 21 patients (9.7%) with underlying diseases, which may confound the cause for their uveitis, and 3 patients (1.4%) with ‘indeterminate’ T-SPOT.TB results. Patients who were HLA-B27 positive (n=10), VDRL positive (n=5), or those diagnosed as having herpetic anterior uveitis (n=4), or sarcoidosis (n=2) were excluded, in accordance with other studies on presumed TAU.2 ,17 ,18 All three patients with ‘indeterminate’ T-SPOT.TB results had unilateral acute anterior uveitis successfully treated with topical steroids with no recurrence of inflammation at the end of our study period. None of the study subjects were found to be immunocompromised, or had BCG vaccinations within 10 years from the study enrolment. Neither an infectious nor a non-infectious cause of ocular inflammation was detected by the end of the follow-up period in the remaining 191 patients.
The clinical characteristics of the 191 study subjects are summarised in table 2. The patients had predominantly anterior (98/191, 51.6%), intermediate (15/191, 7.9%), or posterior uveitis (42/191, 21.9%), although 36/191, 19.0% had panuveitis. Suggestive clinical features of a tubercular cause such as granulomatous inflammation (n=67, 35.0%), extensive posterior synechiae (n=60, 31.4%), vasculitis (n=79, 41.4%), single nodular or serpinginous choroiditis (n=9, 4.7%) were observed in our study cohort. We found no significant differences in terms of age, gender, race or anatomical classification of uveitis when we compared the different T-SPOT.TB and TST test results for the patients. There were no cases of definite ocular TB infection in this study cohort. A total of 11 patients (5.7%) had AFB smear-positive sputum samples and 2 (1.0%) patients had positive PCR results from urine samples. The majority of the patients (181/191, 95%) had CXR findings that were not suggestive of pulmonary TB infection as defined.
Demographics and clinical characteristics of our study cohort
Estimation of the prevalence, sensitivity, specificity, PPV and NPV of the individual and the combined tests
Table 1 describes the prevalence, sensitivity, specificity, PPV and NPV of the TST and the T-SPOT.TB calculated from each individual marginal posterior distribution as described above. Although the TST (0.70, 0.65 to 0.75) was more sensitive compared with the T-SPOT.TB (0.53, 0.42 to 0.66), the T-SPOT.TB (0.91, 0.88 to 0.93) was more specific than the TST (0.71, 0.58 to 0.83).
Analysis of the TST and the T-SPOT.TB in combination
Table 3 shows the estimated number of ‘true positives’ corresponding to each of the four possible outcomes of the diagnostic tests. A total of 39 of 41 subjects (95.1%) who were TST and T-SPOT.TB positive were very likely to have TAU (95% CrI 35 to 41). However, if only one test, ie, the TST or the T-SPOT.TB, was positive, this likelihood was reduced to 63% (36/57, 95% CrI 18 to 50) and 77% (20/26; 95% CrI 14 to 24), respectively. Nonetheless, discordant test results suggest higher likelihood of having TAU, with T-SPOT.TB-positive cases more likely be TAU than TST-positive cases.
Estimated ‘true positives’ in our study data
Sequential testing: TST or T-SPOT.TB
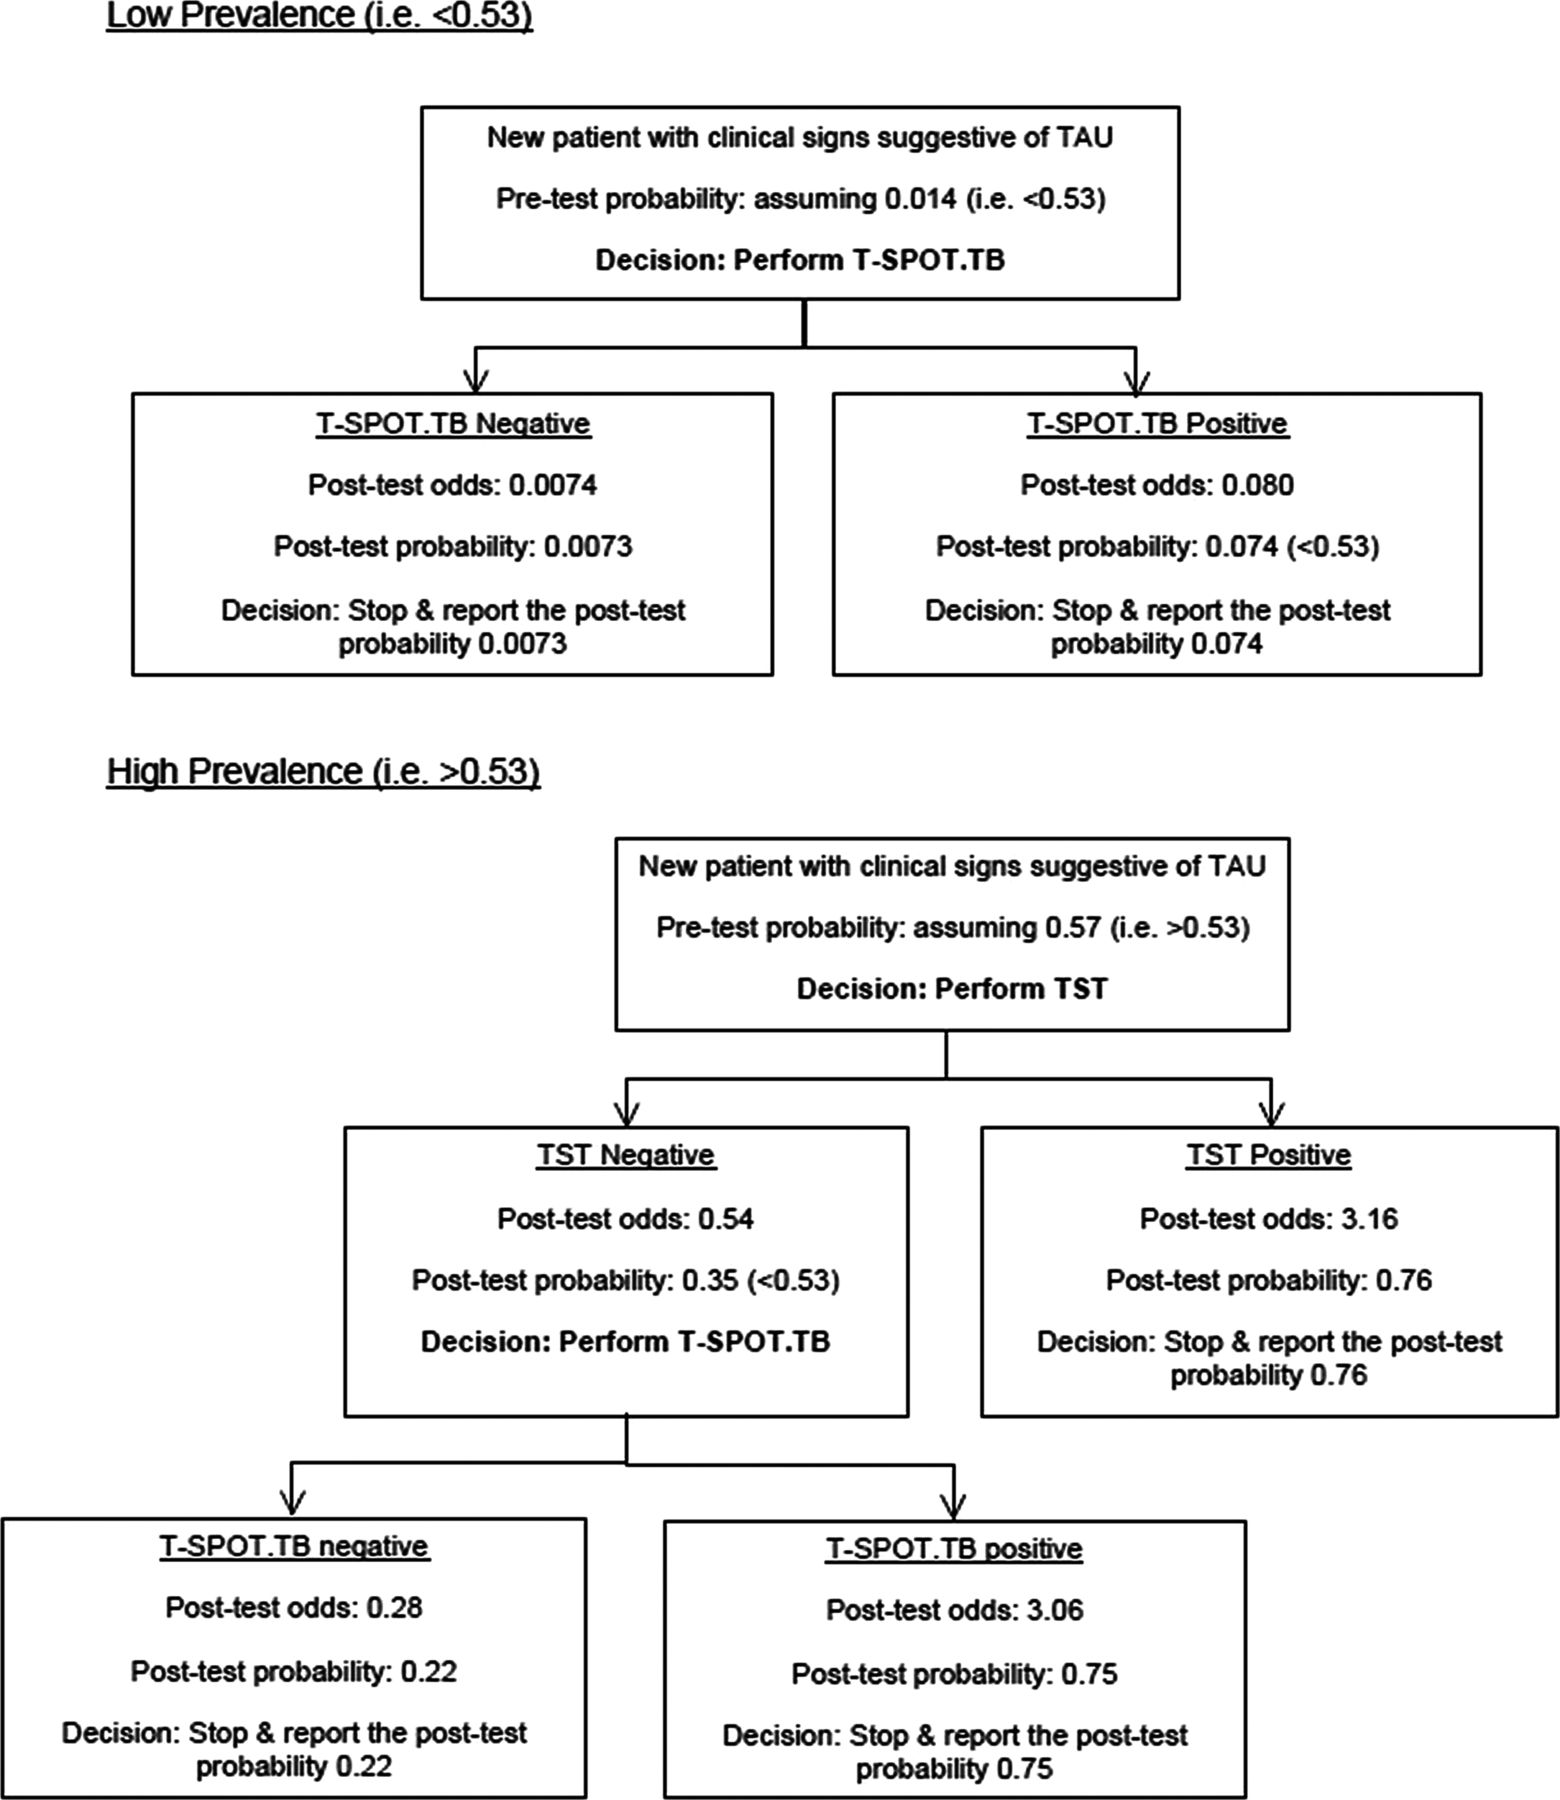
Given the sensitivity and the specificity of each test (TST and T-SPOT.TB), we calculated the risk of each test expressed as the function of probability of TAU (figure 1). Based on statistical decision theory, in study populations where the prevalence of TAU is low, then the T-SPOT.TB is more optimal and could be used as the first-choice investigation. We used a previously published prevalence of TAU (0.014) in figure 2 to illustrate this.23 However, if the actual proportion of TAU is high among patients with suggestive clinical signs (eg, prevalence of more than 0.53), then the TST is the more optimal investigation to be used. However, if T-SPOT.TB testing is required thereafter, this may be possible as the boosting effect is likely to be insignificant from TST on subsequent T-SPOT.TB testing, if T-SPOT.TB is performed within 3-7 days after TST testing.24 Our sensitivity analysis showed that posterior distribution of parameters with mock data varied appreciably with the changing likelihood functions and hence our results were data driven and were not overly influenced by priors.

Sequential testing of the tuberculin skin test and the T-SPOT.TB assay. The optimal risk (statistical decision theory) of each test variation varied with the prevalence of uveitis associated with tuberculosis (TB). In populations where the prevalence of TB was higher than 0.53, the tuberculin skin test had a smaller risk and was more optimal; the T-SPOT.TB assay was more optimal when the prevalence was less than 0.53. TST, tuberculin skin test; TAU, TB-associated uveitis.
Flowchart depicting statistical decision theory on performing sequential tests using the high (assuming a high prevalence of 0.57 among patients with suspected clinical TB-associated uveitis, presenting to a tertiary uveitis centre) and low prevalence (assuming a low prevalence of 0.014 among patients with uveitis from a general population) and the estimated sensitivity and specificity of tuberculin skin test and T-SPOT.TB assay. TST, tuberculin skin test; TAU, TB-associated uveitis.
Discussion
In this study, we provide a new perspective on the evaluation of T-SPOT.TB to diagnose TAU. Due to small numbers of patients who have positive cultures or have evidence of AFB on smears or MTB DNA using PCR from ocular biopsies, it is difficult to evaluate the T-SPOT.TB as a diagnostic test using ‘classical’ hypothesis testing. A Bayesian analysis using the established latent class model allows us to estimate the accuracy of the T-SPOT.TB compared with the traditional TST without a gold standard. Our study helps to answer three important clinical questions on performing the T-SPOT.TB and/or the TST when a patient presents with clinical signs suggestive of TAU.16
First, we determined which test is more useful for diagnosing TAU in patients with uveitis and suggestive clinical signs of TB: TST or the new T-SPOT.TB. We found that in diagnosing TAU, the T-SPOT.TB is more specific but less sensitive than the TST. This finding is similar to that reported in other studies of the T-SPOT.TB in the diagnosis of extrapulmonary and latent TB.25 More important to clinicians, the T-SPOT.TB has a high PPV with a moderate NPV, ie, a positive T-SPOT.TB strongly suggests a tubercular cause in patients with uveitis and clinical ocular signs consistent with TAU, whereas a negative T-SPOT.TB in such patients should be interpreted with caution.
Second, we studied the usefulness of the TST and the T-SPOT.TB in combination. If both were positive, it increased the likelihood of a tubercular cause in our patients who present with suggestive clinical signs to 95%. However, if either or both tests were negative, the possibility of excluding a tubercular cause was only 77%, ie, there is a 23% chance that the patient has TAU. Discordant results (a positive TST with a negative T-SPOT.TB or a positive T-SPOT.TB with a negative TST) reduced the likelihood of TAU to 63% and 77%, respectively, and widened the 95% Bayesian credible intervals. These results suggest that performing both tests increases the accuracy of diagnosing TAU, although discordant or negative results are less useful.
Finally, if the TST and T-SPOT.TB cannot be preformed due to cost or logistical issues, we analysed which test to perform first. Using the information on sensitivity and specificity, we derived the optimal risk using the TST and the T-SPOT.TB, which varies with the prevalence. Our analysis using statistical decision theory suggested that where the prevalence of tubercular uveitis is low, the T-SPOT.TB should be preferred to the TST as the first-choice test. However, in countries where the prevalence of tubercular uveitis is high, the TST is more useful as a first-choice test (figure 2). In our study cohort, using a presumed diagnosis of TAU,26 among patients with uveitis clinical signs suggestive of tubercular cause,16 the estimated prevalence could be as high as 0.57 (123/215 patients). Thus, the TST should be the first optimal test recommended to our patients where there is already a high index of suspicion for TAU (ie, >0.53). However, in populations where the ‘true’ prevalence of TAU is low (eg, 0.014)27 then T-SPOT.TB is a better test to be used as the first-choice investigation. Our analysis illustrates how sequential testing could useful in decisions leading to more efficient diagnosis of TAU.
A positive TST has traditionally been used as an evaluation tool for antitubercular therapy (ATT), which has been shown to reduce the recurrence in patients with TAU.28 However, this study was performed in a country with a high prevalence of TB and may not apply to areas where the endemicity of TB is low. Our study suggests that the T-SPOT.TB may be more useful in regions where the endemicity of TB is low; or in patients with uveitis in the absence of findings suggestive of TB, such as granulomatous inflammation, broad posterior synechiae, vasculitis or choroiditis. Due to the long course of multiple medications and their potential side effects, clinicians and patients alike, are averse to ATT.1 Our study suggests that the addition of T-SPOT.TB to TST is useful when justifying the need for ATT if both tests are positive. Although the T-SPOT.TB is unaffected by prior BCG immunisation, the TST may be inaccurate in BCG vaccinated populations. This further strengthens the need for T-SPOT.TB to be used as an adjunctive tool in such populations. We also attempted to analyse the effect of TST size but found a non-linear association that did not significantly correlate with our T-SPOT.TB results.
The limitation with all studies involving extrapulmonary TB, including ‘ocular TB’, is the small number of patients who actually have a positive TB culture from ocular samples, which is the ‘gold standard’ for diagnosis.29 Thus, most studies use a diagnosis of ‘presumed’ tubercular uveitis or employ meta-analysis to evaluate new diagnostic tests such as T-SPOT.TB. We used the Bayesian technique, which has also been employed in a variety of studies of other infectious diseases that face the same diagnostic dilemmas as tubercular uveitis.9–15 We recognise the limitation of applying prior information into our model with relatively limited data as priors are subjective and may influence the final results. However, our choice of prior distribution used was based on prior information derived from a recent meta-analysis performed on published studies.7 ,8 Sensitivity analyses also showed that our results were data driven, and were not overly influenced by prior information. Moreover, we re-examined our model using the combined TST and T-SPOT.TB data, which was found to be the same as the prevalence of ‘presumed TB uveitis’ in our own study cohort.
In conclusion, in patients who present with uveitis suggestive of TAU, the T-SPOT.TB is a useful diagnostic test that may be used in conjunction with the traditional TST to support the diagnosis of TAU. Our Bayesian analysis in the absence of a gold standard provides new insight into the usefulness of T-SPOT.TB in the diagnosis of TAU. We found that for TAU, T-SPOT.TB is more specific but less sensitive than TST; and thus should be used in preference to TST in low-TB-prevalence populations. However, the likelihood of TAU is greatest if T-SPOT.TB and TST are positive.
References
Supplementary materials
Supplementary Data
This web only file has been produced by the BMJ Publishing Group from an electronic file supplied by the author(s) and has not been edited for content.
Files in this Data Supplement:
- Data supplement 1 - Online supplement
Footnotes
-
The first two authors contributed equally to this work.
-
Contributors All authors contributed to study design, work and preparation of the manuscript. Authorship statement: all authors met the International Committee of Medical Journal Editors (ICMJE) criteria: (1) substantial contributions to conception and design, acquisition of data, or analysis and interpretation of data; (2) drafting the article or revising it critically for important intellectual content; and (3) final approval of the version to be published.
-
Competing interests None.
-
Patient consent Obtained.
-
Ethics approval Ethics approval was obtained from our local Singhealth institutional review board, and our research adhered to the tenets of the Declaration of Helsinki.
-
Provenance and peer review Not commissioned; externally peer reviewed.