Article Text

Abstract
Aims This study has been designed to describe the functional impact of distinct pathologies within the retinal layers in patients with geographic atrophy (GA) by means of a point-to-point correlation between optical coherence tomography (OCT) and microperimetry.
Methods Retinal morphology and function of 23 patients suffering from GA of the retinal pigment epithelium (RPE) have been investigated using the Spectralis OCT (Heidelberg Engineering) and the MP1 microperimeter (Nidek Technologies). The point-to-point overlay of morphology and function has been done using proprietary software, allowing OCT image grading to define distinct alterations of the neurosensory retina, the RPE and the choroid. By overlaying the retinal sensitivity map on the OCT data set, retinal layer alterations could be evaluated regarding their impact on visual function.
Results A total of 1005 stimulation points in the lesion area in 2107 spectral domain OCT B-scans were graded in 43 eyes of 23 patients (mean best corrected visual acuity=20/70). Retinal sensitivity decreases with an increasing number of morphological alterations graded (p<10−13). Alterations of the RPE and the external limiting membrane (p<0.02) were associated with absolute scotomas. Furthermore, the loss of the external limiting membrane as the largest area of morphological alteration among our patients with GA (mean area=5.65 mm2), had a significant impact (p<10−4) on sensitivity (−1.3 dB).
Conclusions Mapping retinal sensitivity to distinct retinal pathologies revealed outer retinal layers, in addition to the RPE, as significant for sensitivity loss. Therefore in GA the RPE loss and the alteration of outer retinal layers should be analysed, which could also provide insight into lesion progression.
- Retina
- Imaging
Statistics from Altmetric.com
Background
Geographic atrophy (GA) secondary to dry age related macular degeneration (AMD) is a disease typified by thinning and loss of the retinal pigment epithelium (RPE) and concurrent atrophy of photoreceptors and choriocapillaris.1–3 In order to find new therapeutic approaches to stop the progression or even the outbreak of GA, precise retinal imaging complemented by gene analysis or histopathological examinations seem to be mandatory, if new insights are to be gained.4–6 Optical coherence tomography (OCT), especially the introduction of the spectral domain technology (SD-OCT) revolutionised retinal imaging as an in vivo method for retinal diagnosis with histological detail.7 The SD-OCT provided higher axial and transversal resolutions at reduced acquisition times and the possibility to obtain a complete three-dimensional dataset of the posterior pole.8 The precise delineation of pathological processes within the retina is especially valuable to gain insights into the pathomorphology of neovascular and dry AMD.9 ,10 The acquisition of three-dimensional volume scans allows cross-sectional as well as planimetric evaluation of the disease process.9 ,11
Fundus-controlled microperimetry (MP) on the other hand is a valuable tool for the precise assessment of retinal sensitivity over areas of retinal pathology.12 This functional imaging modality has been evaluated in numerous studies in macular disease.13–15 There is a clear benefit of precisely imaging the retina and assessing retinal function in a point-to-point fashion, especially in a disease where there is still considerable scope for the understanding of disease processes and finding therapeutic approaches such as in GA. In GA research there is an ongoing debate in the scientific community whether RPE alterations precede photoreceptor alterations or vice versa.10
The present study has been designed to establish a precise correlation between function and morphology and to discern if outer retinal layers contribute substantially to a measurable sensitivity loss in patients with GA.
Patients and methods
This prospective non-interventional study was conducted at the Department of Ophthalmology at the Medical University of Vienna. Over a screening period of 3 months 23 consecutive patients were included. All patients had to sign a written informed consent prior to inclusion. The study design was approved by the local ethics committee (EK569/2011) and followed the tenets of the Declaration of Helsinki. Patients had to be at least 55 years of age and present GA secondary to AMD in at least one eye with a minimum of one disc size (1.5 mm2).16 Patients were excluded if there were signs or history of choroidal neovascularisation or if RPE atrophy was due to high myopia or macular dystrophy. Furthermore clear ocular media were required to assure good imaging quality. Minimum best corrected visual acuity (BCVA) was 20/200 Snellen equivalent. Examinations at the study visit included: BCVA testing based on Early Treatment Diabetic Retinopathy Study charts, slit-lamp examination, biomicroscopy, SD-OCT and microperimetry.
Microperimetry
Monocular fundus-controlled static threshold perimetry was performed using the MP1 microperimeter (software V.1.4.2; Nidek Technologies, Padova, Italy). The MP1 system ensures the correct projection of stimuli on the corresponding infrared (IR) ophthalmoscopic image of the retina by using an integrated eye tracking system. In the course of this examination 33 stimulation loci in a standardised quadratic grid consisting of a 5×5 grid and eight peripheral points covering an area of 12×12° of the retina were tested (figure 1B). Stimulus size was Goldmann III (ranging from 0 dB to 20 dB), presented for a time-interval of 200 ms. A 4-2-1-staircase strategy and a red 3° circle-shaped fixation mark was used throughout the study but the size of the mark was enlarged if the patient was not able to fixate. Patients were tested under mesopic light conditions after 10 min dark adaption in a dedicated MP1 examination room. Background illumination was set at 1.27 cd/m2.
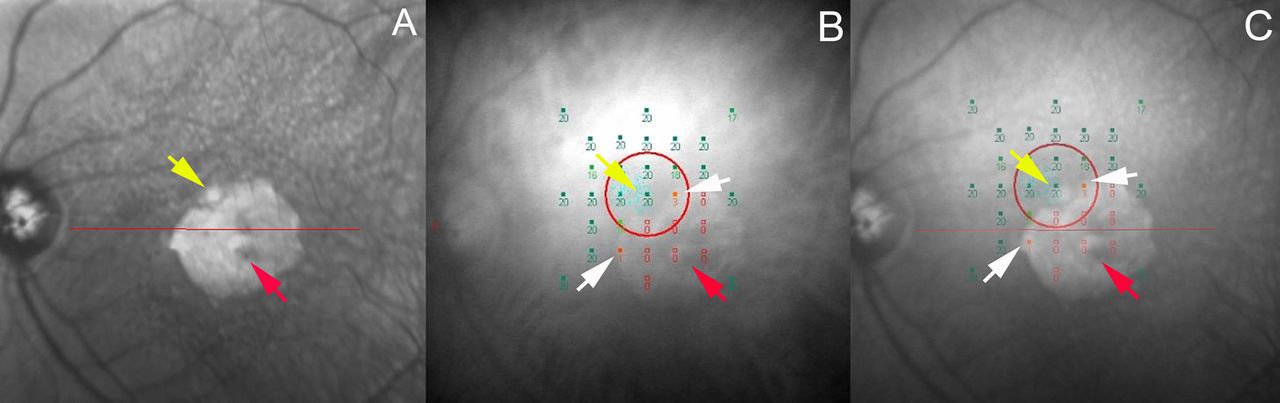
Overlay of the infrared image acquired by spectral domain optical coherence tomography and the MP1 microperimetry fundus image of a patient with geographic atrophy: (A) Infrared image of the Spectralis HRA- optical coherence tomography (OCT); red arrow represents the area of atrophy, yellow arrow represents a light artefact obtained by the fixation of the patient during image acquisition, (B) Fundus image of the MP1 microperimeter with the stimulation loci and the sensitivity values; red arrow represents the area of atrophy; yellow arrow shows the fixation pattern of the patient during sensitivity testing; white arrows show positive sensitivity results at the edge of the area atrophy (C) Overlay of (A) and (B) using the updated OCT-toolkit; red arrow represents the area of atrophy; yellow arrow shows the fixation pattern of the patient during sensitivity testing, corresponding to the light artefact obtained by infrared imaging; white arrows show positive sensitivity results at the edge of the area atrophy.
SD-OCT imaging procedure
SD-OCT imaging was performed using the Spectralis HRA-OCT system (Heidelberg Engineering, Germany) capable of simultaneously recording an IR image and SD-OCT volume scans. The SD-OCT protocol comprised a standard of 49 B-scans per volume scan with a width and height of 20°×20°, and each scan was averaged using the automatic real-time mode of the Spectralis device with 30 frames per B-scan. The distances from B-scan to B-scan were registered automatically and exported together with all B-scans into an extensible markup language (.xml) file. The obtained .xml file was then used for further analysis in an updated version of the previously described OCT-Toolkit software.9
Microperimetry/SD-OCT overlay
In this study an updated version of the OCT-Toolkit was used allowing planimetric measurements of areas of interest in SD-OCT volume stacks as in our previous work,9 and an exact overlay of the en face IR image of the Spectralis device registered in the .xml file with any other en face image by marking three identical points on both images.
The OCT-Toolkit imports the .xml file generated by the Spectralis Data Export Interface and allows for the grading of any area of interest (eg, loss of RPE or choroidal signal enhancement in GA) in each SD-OCT B-scan. The grading, of these prospectively chosen areas of interest (table 1), is then projected on the IR en face image resulting in a planimetrically measured en face area based on SD-OCT cross-sectional images.
Graded areas of interest in spectral domain optical coherence tomography in patients with geographic atrophy
Aiming to correlate morphology and sensitivity in patients with GA, we overlaid the IR images displaying the sensitivity results from the MP1 device using the OCT-Toolkit with the IR images recorded by the Spectralis, enabling us to localise the exact location of the stimulation points in the SD-OCT B-scans and then to analyse the retinal morphology at these points. Figure 1 and figure 2 show the consecutive steps of this procedure. The grading of the volume scans was performed by a grader uninvolved with the SD-OCT procedures and prior to the overlay of the microperimetry image in order to ensure objectivity for the systematic point-to-point correlation.
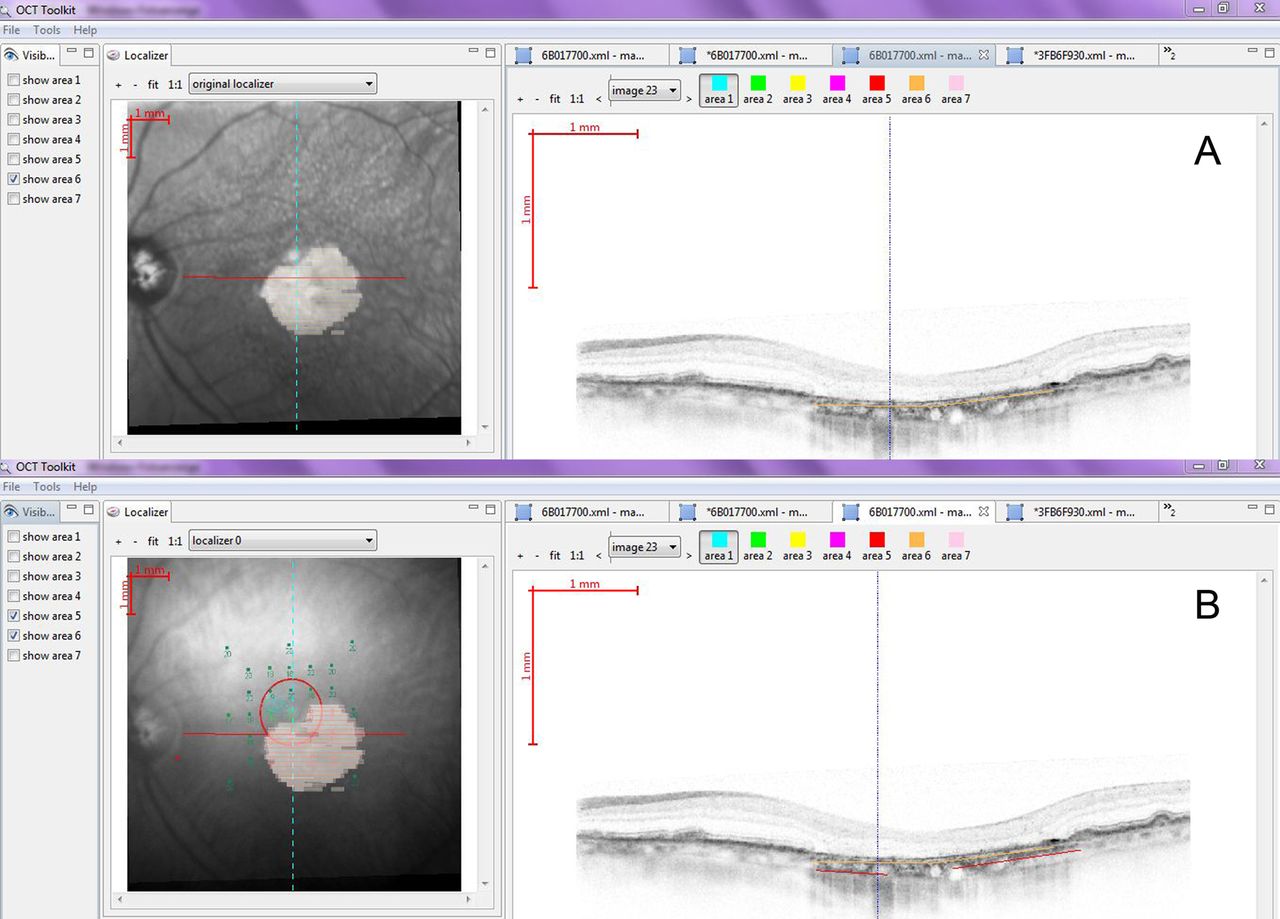
The user interface of the optical coherence tomography (OCT)-toolkit. (A) Exact grading of an area of interest in the atrophic lesion. (B) Exact evaluation of the stimulation point in the infrared image and corresponding region in the spectral domain optical coherence tomography B-scan with the corresponding graded areas of interest.
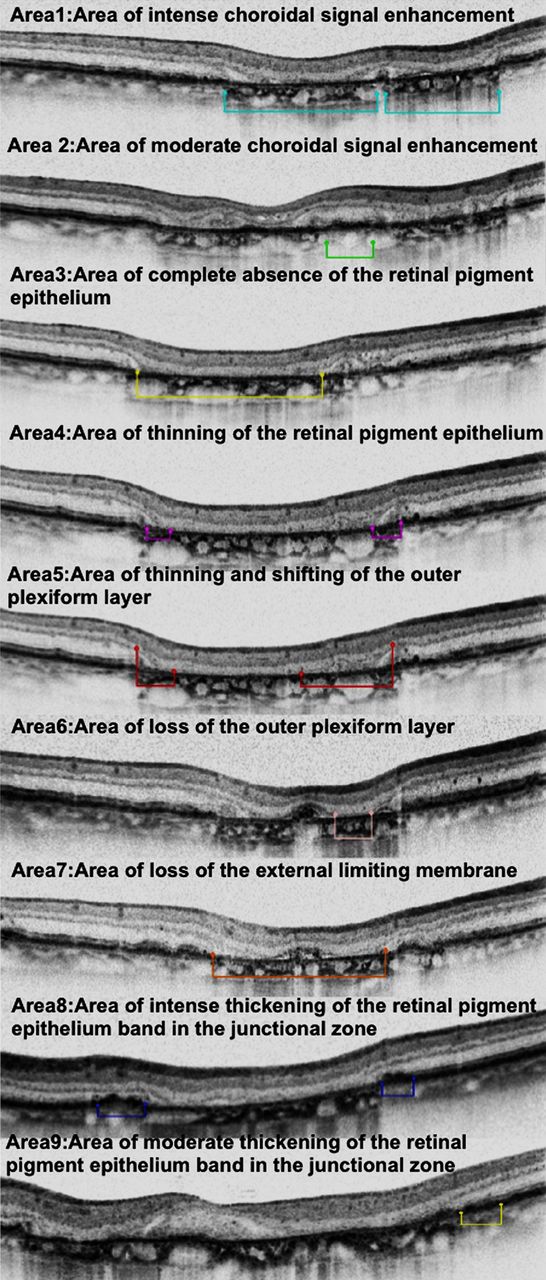
Individual areas of interest graded in SD-OCT B-scans of patients with GA included changes at the level of the outer neurosensory retina, the choroid and alterations of the RPE (thickening or loss) (figure 3).
Spectral domain optical coherence tomography B-scans of a patient with geographic atrophy displaying our analysed areas of interest.
Statistical analysis
To compute first-order descriptive statistics for simple characterisation of the measured values, we first determined the mean planimetric areas measured by SD-OCT. Then we focused on determining how many microperimetry stimuli were present in the graded area of atrophy determined by SD-OCT (area in which choroidal signal enhancement was present, the retina appeared thinner and the RPE was altered substantially: conclusion from our previous study on GA)9 and on the sensitivity outcome in dB for every graded area (area 1–9). For that purpose every stimulation point present in the graded area of atrophy was entered in a datasheet and coded in a binary system where the point was given a code corresponding to the nine areas of interest: ‘graded’=1 or ‘not graded’=0 (eg, point 161: 14 dB: 1.0.0.1.1.0.1.0.0). We correlated every graded stimulation point with its binary code defining the morphology in this exact location with the sensitivity value.
Further statistical analysis was performed in an established statistical environment (R V.2.13.0, http://www.r-project.org). Logistic regression was performed to assess which variables were good predictors of visual function. Their relation to sensitivity (dB) was examined by linear regression tests. Stepwise selection of models with or without interaction terms by the Akaike Information Criterion (AIC) gave similar optimal models with AIC of 2312.4 and 2311.7, respectively. We therefore work without interaction terms. The optimal multilinear model turns out to have only one significant independent variable, area 7. Considering the relevance of different graded areas for the prediction of visual function, stepwise selection of multiple logistic regression models by AIC was performed, yielding a model with five graded areas and an AIC of 1281.7.
Results
Forty-six eyes of 23 patients (12 women; mean age 85 years, range 62–91 years) were included in this prospective study. All patients presented with bilateral GA. Three eyes were excluded due to poor imaging quality. The remaining 43 study eyes showed a mean BCVA of 20/70 Snellen equivalent.
Measured areas of interest in SD-OCT
Two thousand one hundred and seven SD-OCT B-scans from 43 eyes (49 B-Scans per volume scan) were graded regarding each of the morphological parameters described above. The mean areas of interest measured in SD-OCT are summarised in table 2.
Absolute values of the areas of interest measured by spectral domain optical coherence tomography in our study population
Descriptive statistics concerning the microperimetry results
A total of 1005 stimulation points were located in those areas of the SD-OCT volume scans which showed pathological alterations and were therefore graded by the readers. From these 1005 points, 623 (62%) showed a sensitivity of 0x dB (0x=not seen at 0 dB) and therefore an absolute scotoma, 106 points were seen at 0 dB (10,5%), 120 (12%) points had a sensitivity between 1 dB and 5 dB, 95 points (9,5%) between 6 dB and 10 dB and therefore 32% of the points showed a relative scotoma, 43 points had a sensitivity (4,3%) between 11 dB and 15 dB and 18 (1,7%) between 16 dB and 20 dB and therefore 6% showed a relatively normal sensitivity. The sensitivity cut-offs have been chosen according to the work of Prager et al.17
Further descriptive statistics differentiating sensitivity and morphology are summarised in table 3.
Absolute and relative sensitivity results of the areas of interest graded in spectral domain optical coherence tomography
Correlations of the graded areas and the sensitivity points
Logistic regression identified a highly significant (p<10−13) correlation between the increasing number of morphological graded areas in SD-OCT and the results in the microperimetry device concerning the ability to see the stimulus (ranging from: seen at 0 dB and seen at 20 dB) and the disability to see the stimulus (=0x dB). One-way analysis of variance concerning the impact of increasing numbers of pathologically graded areas on the retinal sensitivity at this exact locus was found to be not significant (p>0.25), suggesting that some layer alterations may be more and others less relevant to sensitivity. We therefore analysed the relationship between each graded area of interest and the sensitivity results with linear regression tests. The area of external limiting membrane loss (area 7) had a significant impact (p<10−4) on the sensitivity loss (−1.3 dB). Furthermore area 1 and area 2 had no effect on sensitivity if present. The remaining areas were also not significant (p>0.05, see Methods section).
Furthermore, logistic regression testing concerning the relevance of graded areas for visual function (total loss of vision (0x dB)/in comparison with seen at ≥0 dB), showed the areas 3, 4, 7 and 8 to be significant predictors for absolute scotomas (p<0.02), while area 5 was only marginally significant (p<0.06).
Discussion
Using distance visual acuity to follow-up on patients with macular disease may be misleading especially in AMD where varying disease sizes and affected retinal layers do play a role.18 This also holds true in GA, where foveal sparing is a common and previously described phenomenon enabling patients with late-stage AMD and large areas of atrophy to retain a tolerable visual acuity.19 Fundus-controlled perimetry related to SD-OCT morphology revealed the importance of the outer retinal layers in addition to the RPE in GA disease. Combining those methods could be useful to determine paracentral relative and absolute scotomas and to determine truly spared areas. Multimodal imaging using microperimetry and OCT could therefore be helpful in order to get deeper insights into pathology and corresponding function.
Recently, studies performing a point-to-point correlation of fundus-controlled perimetry and SD-OCT morphology in AMD were performed using the OPKO-OTI SD-OCT system (Miami, Florida, USA), combined with a microperimetry device. These studies concentrated on the inner segment/outer segment interface (IS/OS) morphology as seen in SD-OCT and correlated the results to sensitivity measurements.18 ,20 ,21 For example, in the study by Landa et al the disruption of the IS/OS at every stimulation point was correlated to the mean sensitivity of patients with dry AMD. They found a strong inverse correlation between those entities. Moreover they found a significant difference in sensitivity when comparing groups with >75% and <75% of complete IS/OS disruption among all sensitivity points. It is also described that retinal sensitivity remains high until the size of IS/OS disruption exceeded 70%. Furthermore, in many patients visual acuity remained high with a BCVA of 20/40 and above even after a complete loss of the IS/OS layer. They concluded that the loss of the visualisation of the IS/OS boundary was associated with a decrease of sensitivity but not with absolute loss of sensitivity.18 The present prospective study did not focus on the IS/OS layer, because it is absent in the area of interest as studied herein. Then the study of Querques et al compared near IR autofluorescence, blue fundus autofluorescence and SD-OCT with microperimetry results in patients with dry AMD. In SD-OCT they analysed the IS/OS interface and found similar results as Landa et al: they found that retinal sensitivity, in areas of reduced or increased fundus autofluorescence was not statistically different but that sensitivity differences occurred when compared with normal fundus autofluorescence.20 The work of Pilotto et al21 showed that inner and outer retinal layers’ thickness changes correlate with sensitivity changes. These longitudinal results are in accordance with our findings.
Our results showed that the largest morphological defect in the area of atrophy graded by SD-OCT was in the photoreceptor layer (external limiting membrane (ELM) loss and outer plexiform layer (OPL) thinning and shifting) and not within the RPE layer. Therefore it may be possible that outer retinal layer loss (ELM) and disruption (OPL) precedes the complete loss of the RPE. These observations may also help to explain the positive effect of ciliary neurotrophic factor in patients with GA as described by Zhang et al2 showing that visual acuity could be stabilised over 1 year due to a retarded photoreceptor loss. This result seems to underline the importance of properly monitoring the outer retinal layer structure in patients with dry AMD, especially when testing new agents with a protective effect on the outer retinal layers.
Forte et al,22 analysing dry AMD in SD-OCT and fundus autofluorescence, stated that choroidal hyperreflectivity is known to be derived from the reduction of the blocking effect of the RPE cells. The results of the present and our previous study9 in evaluating GA in SD-OCT show that the signal enhancement in the choroid was larger than the area of complete RPE alteration, leading us to the assumption that complete RPE loss may not be the only parameter responsible for this characteristic feature. When analysing the results of this study we found that an area of absolute scotoma correlated morphologically with severe RPE alterations and ELM (p<0.02).
We detected that 38% of all stimulation points were perceived in the area of atrophy. In 27% more than 1 dB was registered in the lesion area, but in approximately 95% of stimulation points in an atrophic area, sensitivity was reduced dramatically. These stimulation points were found mainly in the borders of the area of atrophy (see figure 1). In a study by Hartmann et al analysing sensitivity results in patients with GA, a mean sensitivity of 5.29±2.49 dB at the margin of the lesion was discovered in comparison with 14±2.4 dB in the area of uninvolved retina.23
Limitations of this study are mainly attributable to MP testing. Patient's compliance and fatigue can perturb examination performance and microsaccades occurring during testing might as well not be corrected adequately by the system leading to inaccurate fundus positioning relative to the stimulation location. We furthermore want to mention that only points previously graded in the lesion area were analysed regarding sensitivity and that therefore no conclusions on the mean sensitivity among the patients can be drawn.
The findings of this study support the hypothesis that photoreceptor layer degeneration may precede RPE alterations and therefore analysing retinal sensitivity and morphological features as displayed by SD-OCT may lead to a better understanding of the pathophysiology underlying dry AMD. Changes in retinal function as tested by retinal sensitivity could precede morphological changes. Therefore SD-OCT and retinal sensitivity testing may be beneficial in addition to fundus autofluorescence, mainly displaying diseased RPE and not the photoreceptor layers which are clearly playing a pivotal role for the functional loss associated with AMD.
References
Footnotes
-
Contributors Conceptions and design: RGS, CGK, CS, MB, DPK, US-E. Data acquisition: RGS, JK, TM, AM, MA. Analysis and interpretation of data: RGS, CGK, AM, DPK, MB, US-E. Drafting the article: RGS. Revising it for intellectual content: all authors. Final approval of the version published: all authors.
-
Competing interest None.
-
Ethics approval Local ethics committee (EK569/2011).
-
Provenance and peer review Not commissioned; externally peer reviewed.