Article Text

Abstract
Aims To evaluate postural fluctuations (PFs) and diurnal variation (DV) of intraocular pressure (IOP) in patients with untreated glaucoma, glaucoma suspects and healthy volunteers, and study their relationship, if any, to the extent of glaucomatous damage.
Methods This prospective, observational cross-sectional study was carried out in a tertiary care referral institution. The patient population included five groups of patients comprising the following: 19 with ocular hypertension (OHT), 26 with optic discs suspicious for glaucoma (DS), 18 with normal tension glaucoma (NTG), 19 with primary open angle glaucoma (POAG) and 20 normal subjects. The IOP was measured at four time periods using Perkins tonometer, in sitting and supine positions. The main outcome measures were change in IOP with posture, the DV in both postures and the relationship between PF, DV and the extent of visual field damage.
Results The supine IOP was significantly higher than the sitting IOP, at all time points of the day, in all groups (p<0.001). The PF at 04:30 was significantly higher in POAG, OHT and NTG. The PF at 09:00 correlated significantly with the mean deviation (MD) on visual fields in the NTG group (r=0.735; p=0.001). The DV did not correlate with the MD in any of the five groups studied.
Conclusions The significantly higher supine IOP is frequently missed in routine glaucoma practice. An early morning supine IOP measurement may reveal a peak IOP hitherto not picked up during routine office IOP measurements, and may be a useful measurement in unexplained progressive glaucoma.
- Glaucoma
- Intraocular pressure
Statistics from Altmetric.com
Introduction
High intraocular pressure (IOP) is the main risk factor for the onset and progression of glaucoma.1 However, IOP is not a static parameter, but is dynamic with a circadian rhythm and spontaneous changes with posture.1
Conflicting information is available in the literature with regard to the importance and predictive value of IOP peaks and fluctuations on the risk of glaucoma development and progression. Some studies report large diurnal and postural fluctuations (PFs) in IOP to be potential independent risk factors leading to the progression of glaucomatous optic neuropathy.2–6 However, post hoc analyses of two large prospective studies (Early Manifest Glaucoma Treatment Trial (EMGT) and Ocular Hypertension Treatment Study) did not support this association.7 ,8
It is thus as yet unclear whether detecting large IOP fluctuations in addition to peak IOP measurement is also important in day-to-day glaucoma management.
The aim of our study was to evaluate diurnal variation (DV) and PFs of IOP in glaucoma suspects (GS) (ocular hypertension (OHT) and suspicious discs) (DS) and glaucoma patients (open angle glaucoma and normal tension glaucoma (NTG)), and to compare them with normal subjects. Repeated tonometry throughout the day can be cumbersome and impractical. We tried to evaluate whether PFs in IOP at any time of the day had any correlation to the severity of glaucoma and whether PFs at any time point can possibly be used as a surrogate for DV of IOP.
Materials and methods
This prospective cross-sectional study was carried out in a tertiary care referral institute. The study adhered to the tenets of the Declaration of Helsinki and was approved by the Institute Ethics Committee of the Postgraduate Institute of Medical Education and Research, Chandigarh. There were five groups of participants: patients with OHT, DS, NTG and primary open angle glaucoma (POAG) and normal subjects. An informed consent was taken from all subjects enrolled for the study.
Inclusion criteria
Subjects more than 18 years of age, with visual acuity 20/40 or above, clear cornea and ocular media and no associated ocular disease were enrolled for the study.
Each subject underwent comprehensive ophthalmic examination including best-corrected visual acuity, IOP measured by Goldmann applanation tonometry (GAT), slit lamp biomicroscopy, gonioscopy, stereoscopic fundus evaluation using a 90.0-D lens, two consecutive and reliable visual field (VF) tests by Humphrey's Visual Field Analyser 750 II (Carl Zeiss-Humphrey Systems, Dublin, California, USA) using the 24-2 protocol; SITA-Standard strategy. Reliable VF tests had fixation losses less than 33% and false-positive and false-negative rates less than 25%. Normal VF was defined as mean deviation (MD) and pattern SD values within 95% CI and Glaucoma Hemifield Test classified as ‘within normal limits’. Abnormal VFs not conforming to these criteria were repeated and repeatable defects corresponding to the optic nerve head appearance were considered glaucomatous. Central corneal thickness or pachymetry (CCT) was obtained by A scan pachymeter (available on Alcon OcuScanRxP). The average of three best readings was taken.
Inclusion criteria
Patients were categorised into GS and manifest glaucoma groups. GS had open angles and (1) either DS for glaucoma (cup–disc ratio >0.6, diffuse or focal neuroretinal rim thinning, disc haemorrhage and/or retinal nerve fibre layer (RNFL) defects) with normal VFs or (2) IOP >21 and <32 mm Hg on at least two successive measurements with normal optic discs and VFs (patients with OHT).
Patients with manifest glaucoma had primary glaucoma and open angles, glaucomatous optic neuropathy as defined above, with corresponding VF defects. They were segregated into NTG if their IOP was never recorded >21 mm Hg at any time of the day and were designated POAG if the IOP was >22 mm Hg.
Only patients with newly diagnosed glaucoma and ocular hypertension not on any treatment were included for the study.
Exclusion criteria
Patients who had a history of any ocular surgery, were on treatment for glaucoma or were receiving any antihypertensive/cardiac medications were excluded from the study.
Consecutive patients presenting between January and June 2014 fulfilling the inclusion criteria were prospectively enrolled for the study.
IOP was measured by portable Goldmann–Perkins applanation tonometer (Clement Clarke, London, UK) employing the following protocol for all patients. All measurements were taken by a single examiner (NG). The IOP was recorded at four time intervals during the day while the patient was admitted in the hospital (09:00, 16:30, 22:00 and 04:30). The patient was asked to rest for 30 min prior to taking the IOP measurements. After anaesthetising the cornea locally with a drop of proparacaine 0.5% and staining the tear film with 2% fluorescein in both eyes, IOP was measured while subjects were sitting, and then they were asked to lie supine for at least 30 min before IOP measurement was repeated while they were lying down. The average value of three measurements was taken for all readings. In each group the postural and diurnal fluctuations were computed separately. We defined PF and DV as follows:
PF—Difference of IOP in the supine and sitting position at each time point.
DV—Difference between maximum and minimum IOP during the 24 h period DV for sitting and supine postures was computed separately.
The severity of glaucoma in POAG and NTG groups was assessed by the MD of VFs.
Statistical analysis
Statistics were done using the IBM SPSS Statistics V.19 programme. For all statistical purposes, IOP values from one eye were considered for calculation. By default as a matter of protocol the right eye was measured first followed by the left. The IOP of the right eye of all patients at all time points was computed for analysis. The IOPs at each time period in each group in sitting and supine postures were compared using the paired t test. The PF was compared in all the groups using repeated measures analysis of variance (ANOVA) test to find significant correlations between intragroup as well as intergroup IOP measurements after applying Mauchly's test of sphericity to the comparisons. Bivariate correlation between MD on VFs and PF as well MD with DV in each group at different time intervals was analysed using the Pearson's correlation test. A p value of <0.05 was considered significant. A minimum sample size of 80 patients was found, assuming difference of 3 mm Hg between supine and sitting IOP (to detect minimal difference of 1 mm), and power of study to be 80%.
Results
Table 1 presents the demographic profile of all the five groups of patients.
Patient demography
The groups showed no difference with respect to age, gender distribution or mean pachymetry. The DV of IOP in the sitting and supine positions in all groups is depicted in figure 1.

Diurnal variation of intraocular pressure in sitting and supine postures in all groups tested. NTG, normal tension glaucoma; OHT, ocular hypertension; POAG, primary open angle glaucoma.
Postural fluctuation of IOP within each group
The PF in all groups at different times of the day is depicted in tables 2⇓–4 and figure 2. The IOP was significantly higher in the supine position compared with the sitting IOP at all time points of the day in all the groups including normal subjects (p<0.001), However, in normal subjects there was no significant difference in the PF between any time point (table 2).
Postural and diurnal IOP fluctuation in normal subjects
Postural and diurnal IOP fluctuation in glaucoma suspects
Postural and diurnal IOP fluctuation in patients with glaucoma

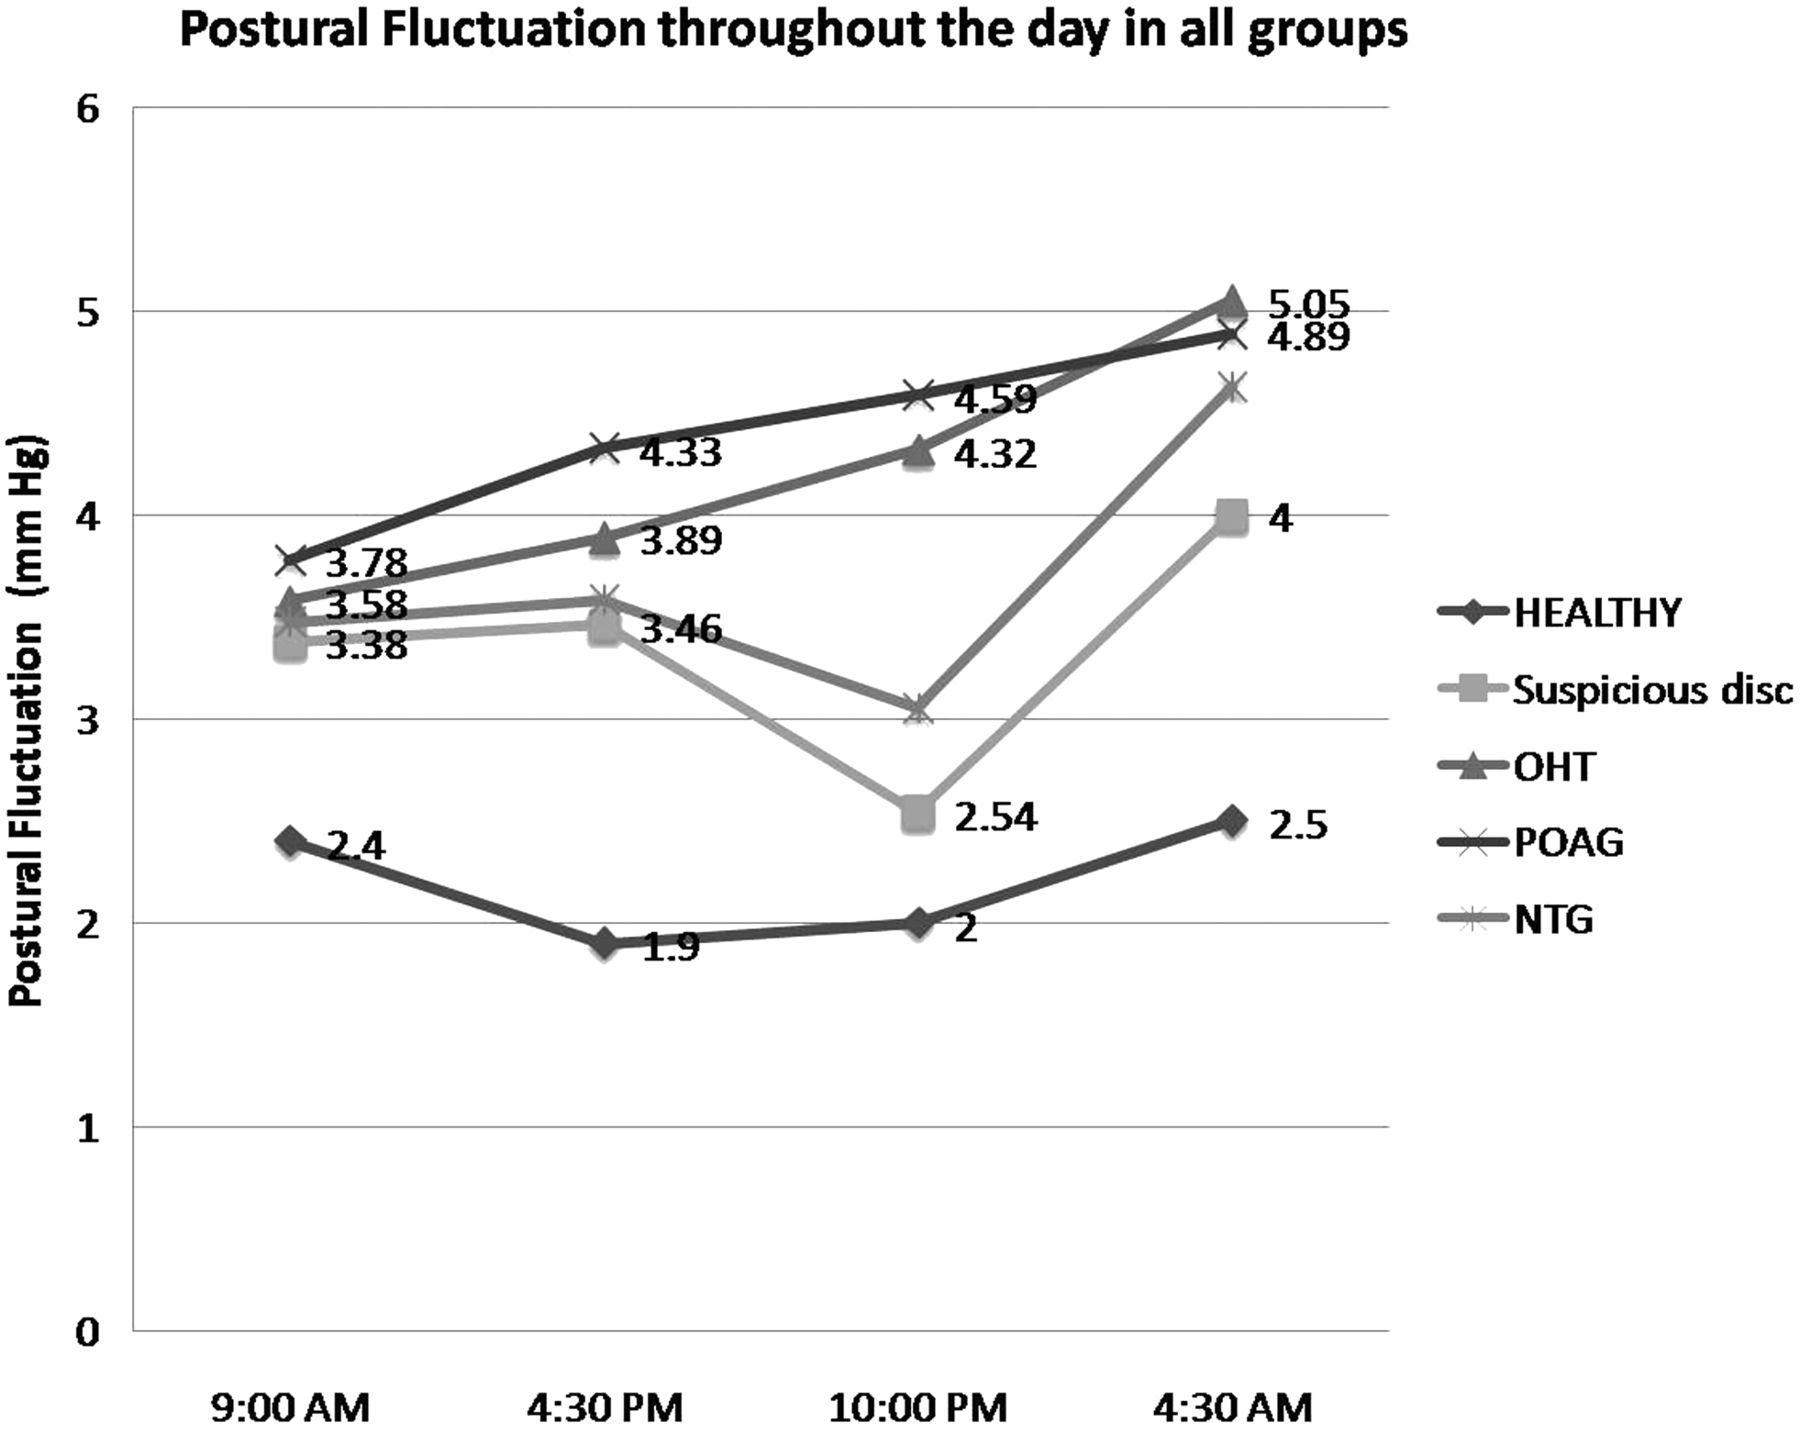
Postural fluctuation at different time points during the day in all groups of patients. NTG, normal tension glaucoma; OHT, ocular hypertension; POAG, primary open angle glaucoma.
The mean PF in patients with OHT was significantly higher in the predawn time point (04:30) compared with those with DS (p=0.04) (table 3). The mean PF of IOP was the highest in patients with POAG (mean 4.5±1.2 mm Hg) and varied from 3.8 to 4.9 mm Hg (table 4). All groups of patients had maximum PF at the 04:30 time point, but it was significantly higher than the 09:00 PF only in patients with POAG, OHT and NTG (p=0.02; p=0.04 and p=0.045, respectively) (tables 3 and 4; figure 2).
PF of IOP compared between different groups
In the POAG group the PF at all times points was significantly higher compared with normal subjects (p=0.020; p<0.001; p=0.002 and p=0.025 at 09:00, 16:30, 22:00 and 04:30, respectively). The PF was similarly significantly higher at all time points in the OHT group compared with normal subjects (p=0.044; p<0.001; p=0.003 and p=0.012 at 09:00, 16:30, 22:00 and at 04:30, respectively). Patients with NTG had significantly greater PF compared with normal subjects at 04:30 (p=0.012).
Diurnal variation of IOP
The 04:30 IOP measurement was the highest in all groups except in the NTG group where there was no definite pattern (tables 3 and 4). The DV of IOP was greater in patients with glaucoma than that in GS. The DV in POAG was significantly higher than that in both patients with DS and the healthy group (p<0.001).
There was no correlation between the DV and PF at any time point in any of the five groups.
Correlation with VFs
The DV did not correlate with the MD on VFs in any of the five groups studied.
In patients with NTG, the PF at 09:00 correlated significantly with the MD on the VFs (r=0.735; p=0.001). We found no correlation between the MD and PF at any time of the day in any of the other groups.
Discussion
Although variations in IOP have been known since long, they are not well characterised9 and are often not accounted for in the management of patients with glaucoma. These variations may be due to complex interactions between external stimuli and an individual's intrinsic biological IOP rhythm. IOP fluctuations of as much as 4–5 mm Hg in healthy individuals and substantially higher, in some patients with glaucoma have been reported.6 ,10
Previous studies provide conflicting reports about the importance of IOP fluctuation in glaucoma management. Differences in study design, study populations and definitions may explain these apparently contradictory findings. The Collaborative Initial Glaucoma Treatment Study,11 Advanced Glaucoma Intervention Study12 and Choi et al13 reported IOP fluctuation was a risk factor for glaucoma. However, these were retrospective studies, and used SD as a surrogate measure for IOP fluctuation. Asrani et al4 in their prospective study suggested that IOP fluctuations are an independent risk factor for glaucoma, but used home tonometry to assess IOP fluctuations during the day. Studies that reported no significance of IOP fluctuation as a risk factor include that by Medeiros et al14 and the EMGT7 which were retrospective and where SD was used as a surrogate for IOP fluctuation, and a study by Jonas et al15 where patients were analysed retrospectively and were on different antiglaucoma medications.
Singh and Sit9 provided additional explanation for these discrepancies. They hypothesised that use of SD of the mean IOP as a surrogate for variability may report absolute changes and is likely to underestimate the risk at low IOPs and overestimate the risk at higher IOPs. They suggested that the percentage of IOP variability would be a better measure of glaucoma risk than absolute change.
The strength of our study lies in the fact that patients were recruited prospectively and the IOP was actually measured physically throughout the day in both sitting and supine positions. GAT is the current gold standard for measurement of IOP for glaucoma management. Our study used the portable Goldmann (Perkins tonometer) which may make it a more reliable measurement than using the tonopen. We excluded patients on antihypertensive or cardiac medications because of the known effects of these on IOP.16 Khawaja et al16 reported that the use of systemic β-blockers and nitrates were independently associated with lower IOP measurements in patients who had been prescribed these medications for systemic hypertension.
We found consistently higher IOP measurements in the supine posture and the mean PF throughout the day in all groups of patients, but it was highest for POAG (4.5±1.2 mm Hg) and OHT (4.2±1.0 mm Hg). The mean sitting IOP in these patients was 22.9±1.5 and 22.3±0.7 mm Hg, respectively. In a study on patients with untreated OHT, Grippo et al17 reported that baseline 24 h IOP pattern in patients with OHT was similar to that in glaucomatous patients. In contrast to non-converters, patients with OHT who converted to glaucoma were found to be significantly different from healthy controls.
Elevation of episcleral venous pressure has been implicated in the higher IOP measured in the supine position in other studies also.18 ,19 This has also been thought to be instrumental in IOP elevation during the night.20 ,21 Some studies have also demonstrated that PFs of IOP in glaucomatous eyes correlate with depression of VF defects.5 ,6
In our study, the PF at 09:00 in patients with NTG correlated significantly to the extent of VF damage. Unexplained progression in some patients of glaucoma may warrant an assessment of supine IOP to detect hitherto unknown spikes. In NTG, a PF assessment particularly during morning hours may help detect IOP higher than what was believed to be an adequate target. The optic discs in patients with NTG appear to be more susceptible to lower levels of IOP compared with patients with high-tension glaucoma. Probably this susceptibility extends to lower tolerability to small DV and/or PF which is why the PF correlates to MD on VF only in this group.
Some papers on DV of IOP have taken IOP measurements in the sitting position during the day and supine position at night.17 This may confound their findings and what was attributed to DV alone may also have a postural variation component to it, which may have gone unrecognised.
We found that posture did not influence the DV of IOP. Selvadurai et al22 reported that posture appeared to have no bearing on the DV of IOP. In their study, aqueous humour outflow facility measured with electronic Schiotz tonography did not vary significantly between the supine and sitting positions.
Recently, 24 h IOP monitoring has received attention in an attempt to characterise the dynamic changes of IOP especially during sleep.23 ,24 Mansouri and Shaarawy23 studied patients with glaucoma progression despite normal IOPs during clinic hours who underwent ‘24 h IOP monitoring’ with the contact lens sensor, and found that the peak ‘IOP’ occurred in 69% of patients during the nocturnal/sleep period. This novel methodology does not actually measure the ‘IOP’ but uses a stain-gauge marker that is highly correlated to the IOP. Time and clinical use should help us understand the advantages and disadvantages of this technology. Although our study does not actually measure the ‘24 h IOP’, the readings throughout the day give some idea about the IOP measurements in the supine posture, as during sleep. Maybe this increase could add to the unexplained progression seen in some patients who have apparently ‘normal’ IOP during daytime measurements.
The study by Quaranta et al25 is similar to ours as both studies consolidate the fact that in patients who are seemingly doing unwell besides adequate pressure control, postural changes in IOP may be considered responsible. However, the results are different from our study. This can be because their study was multicentric using different instruments, while our study was carried out at a single centre using the same instrument. We kept a 30 min time interval between sitting and supine IOP to let the physiological forces (while recumbent) act. Patients in their study were on antihypertensive medications, and 27 patients were on antiglaucoma medications, which can be a great confounder of the results.
We detected peak IOP in the predawn period in all our patients except NTG. However, this was significantly higher than normal in patients with POAG only. Nevertheless the small sample sizes may have accounted for a lack of statistical significance in the other groups. In routine clinical practice, we base our treatment of glaucoma on office IOP. The problem is this office measurement may fail to detect peaks of IOP at other time points of the day. Though assessment of diurnal fluctuation in all patients is prone to logistic problems, these hidden pressure fluctuations may often be the culprit behind the progression of glaucoma.2–6 It may be worthwhile to do a full DV in some patients to rule out these undetected peaks.
Studies evaluating PF and DV concurrently across the spectrum of patients with glaucoma have not been previously published. Our study provides new information with regard to a possible risk factor of PF at the predawn period, which may go undetected when measuring DV during office hours. However, it is important to note that our study only showed a correlation between the PF at 09:00 and VF defect in patients with NTG and not for other subject groups. It may indicate an IOP-independent factor in patients with NTG, especially those who appear to be progressing despite apparently controlled IOP. The DV measurements on the other hand showed no correlation to the MD on VFs in any patient group. An office PF may be a good surrogate for DV so as to at least detect peak IOPs in the supine posture. The PF measurement in such patients may at least be an indicator to which patients may need to be tested for a DV of IOP throughout the day.
Acknowledgments
We acknowledge the contribution of Mr Mahindroo towards statistical support.
References
Footnotes
Contributors All authors made substantial contributions to the conception or design of the work, and the acquisition, analysis or interpretation of data. Kaushik S designed the study, analysed the data and drafted the work. NG and SK recruited patients, collected data and drafted the paper. SSP and SR revised the paper critically for important intellectual content. All authors gave final approval of the version submitted. We all agree to be accountable for all aspects of the work in ensuring that questions related to the accuracy or integrity of any part of the work are appropriately investigated and resolved.
Competing interests None declared.
Ethics approval Institute Ethics Committee, PGIMER, Chandigarh.
Provenance and peer review Not commissioned; externally peer reviewed.
Linked Articles
- At a glance