Article Text

Abstract
Objective To validate a mathematical algorithm that calculates risk of diabetic retinopathy progression in a diabetic population with UK staging (R0–3; M1) of diabetic retinopathy. To establish the utility of the algorithm to reduce screening frequency in this cohort, while maintaining safety standards.
Research design and methods The cohort of 9690 diabetic individuals in England, followed for 2 years. The algorithms calculated individual risk for development of preproliferative retinopathy (R2), active proliferative retinopathy (R3A) and diabetic maculopathy (M1) based on clinical data. Screening intervals were determined such that the increase in risk of developing certain stages of retinopathy between screenings was the same for all patients and identical to mean risk in fixed annual screening. Receiver operating characteristic curves were drawn and area under the curve calculated to estimate the prediction capability.
Results The algorithm predicts the occurrence of the given diabetic retinopathy stages with area under the curve =80% for patients with type II diabetes (CI 0.78 to 0.81). Of the cohort 64% is at less than 5% risk of progression to R2, R3A or M1 within 2 years. By applying a 2 year ceiling to the screening interval, patients with type II diabetes are screened on average every 20 months, which is a 40% reduction in frequency compared with annual screening.
Conclusions The algorithm reliably identifies patients at high risk of developing advanced stages of diabetic retinopathy, including preproliferative R2, active proliferative R3A and maculopathy M1. Majority of patients have less than 5% risk of progression between stages within a year and a small high-risk group is identified. Screening visit frequency and presumably costs in a diabetic retinopathy screening system can be reduced by 40% by using a 2 year ceiling. Individualised risk assessment with 2 year ceiling on screening intervals may be a pragmatic next step in diabetic retinopathy screening in UK, in that safety is maximised and cost reduced by about 40%.
- Epidemiology
- Retina
- Clinical Trial
- Diagnostic tests/Investigation
- Public health
This is an Open Access article distributed in accordance with the Creative Commons Attribution Non Commercial (CC BY-NC 4.0) license, which permits others to distribute, remix, adapt, build upon this work non-commercially, and license their derivative works on different terms, provided the original work is properly cited and the use is non-commercial. See: http://creativecommons.org/licenses/by-nc/4.0/
Statistics from Altmetric.com
Introduction
The overall objective of this work is to use information technology and individual risk assessment by mathematical algorithms to increase the efficacy of screening systems in medicine. The specific case is diabetic retinopathy screening, which has been successful in reducing diabetic blindness in many countries1 ,2 but may provide opportunity for improved cost-effectiveness.
Initially annual screening for diabetic retinopathy was the rule and is still recommended by WHO and many professional societies and practised in many countries, including the UK. However, more and more evidence has shown that annual screening is an overkill for low-risk patients with diabetes. Kristinsson et al,3 showed that diabetics without retinopathy may safely be screened every other year and this was confirmed by a 10 year experience.4 Biennial screening is practiced in many screening programmes for diabetic retinopathy and simple risk stratification has been explored.5 ,6
More recently, we proposed to use individual multifactor risk assessment for diabetic retinopathy progression to control screening frequency and further economise screening programmes for diabetic retinopathy. Aspelund et al7 developed a mathematical algorithm that calculates individual risk for progression to sight-threatening diabetic retinopathy and can be used to control the frequency of diabetic eye-screening visits. The algorithm receives clinical data: type and duration of diabetes, HbA1c, systolic blood pressure, gender and the presence and grade of retinopathy. These data are used to calculate an individual's risk of developing sight-threatening retinopathy (STR), that is, proliferative diabetic retinopathy and/or clinically significant diabetic macular oedema. This algorithm has been validated successfully in Denmark,7 the Netherlands8 and Spain.9 It predicts about 80% of the risk of progression of diabetic retinopathy and recommends a screening interval according to individual risk. This allows reduction in mean screening frequency by over 50% (depending on interval ceiling) with corresponding reduction in costs. At the same time, high-risk patients with diabetes are screened more frequently, up to every 6 months depending on individual risk.
There is a slight difference in staging of diabetic retinopathy in the Danish, Dutch, Spanish and Icelandic cohorts initially used to calibrate the algorithm and the English screening system, which uses R0–3 with the subdivision of the third R3A (active proliferation) and R3AS (stable proliferation). M1 describes maculopathy in accordance with the English National Diabetic Eye Screening Program definition. (http://diabeticeye.screening.nhs.uk/getdata.php?id=11653). In order to use the algorithm in the English screening system, it must be calibrated for this staging and preferably in an English diabetic cohort.
The aim of this analysis is threefold: First to investigate whether the algorithm can be used to predict the risk of R2 (preproliferative retinopathy), R3A (active proliferative retinopathy) and M1 (diabetic maculopathy). We also want to estimate the possible reduction in screening frequency in this cohort, while maintaining safety standards. The third goal is to establish the risk profile for the cohort to recognise how many are at low risk and how many have high risk for progression within 2 years.
Methods
This study is based on data of 9690 individuals with diabetes in England who are participating in the English National Diabetes Eye Screening Programme. Data was made available on research consented patients, and their anonymised data included their retinopathy stage in the R and M scales annually for 3 years. Clinical data was also available on type and duration of diabetes, HbA1c, systolic blood pressure, gender and the presence and grade of retinopathy. Three individuals with systolic blood pressure less than 80 mm Hg were excluded from the analysis. Based on the algorithm of Aspelund et al,7 the subjects’ risk of developing R2, R3A or M1 was calculated and screening intervals were recommended. The calculations were done using clinical data gathered in the year 2010 and compared with clinical outcome in the year 2012.
The algorithm was originally designed to estimate the risk of developing sight-threatening retinopathy (STR, either diabetic macular edema (DME) or profilerative diabetic retinopathy (PDR)). In order to predict the risk of the occurrence of retinopathy stage R2, R3A or M1, instead of STR), a calibration coefficient was calculated for each retinopathy stage, and gender and type of diabetes. The coefficient was the observed proportion of each outcome divided by the average risk estimate for STR. An estimate of the risk of developing R2, R3A or M1 was calculated by multiplying the risk estimate of the algorithm with the corresponding calibration coefficient.
The recommended screening intervals were calculated so that the average cumulative risk of developing R2, R3A or M1 within the screening period was kept identical to the cumulative incidences of the corresponding retinopathy grading that were observed with annual screening.
A receiver operating characteristic (ROC) curve is a plot of the true positive rate (sensitivity) against the false positive rate (1−specificity) for the different decision thresholds of a diagnostic test.10 The area under the ROC curve is an estimate of the capacity of the diagnostic test to distinguish individuals with versus those without disease. It can range from 0.5 to 1, where an area of 1 represents a perfect test and an area of 0.5 represents a worthless test. ROC curves were plotted for the ability of the algorithm to predict development of R2, R3A and M1 within 2 years for the population in total as well as patients with type I and type II diabetes separately. ROC curves for the ability of any retinopathy grading were also drawn for patients with type I and type II diabetes separately.
Results
Diagnostic capacity of the algorithm
The number of men and women who developed R2, R3A, M1 or any of R2, R3A or M1 within a year or within 2 years, is shown in table 1. The results are split up by gender and the type of diabetes.
Number and incidence (%) of individuals who develop R2 (preproliferative retinopathy), R3A (active proliferative retinopathy), M1 (diabetic maculopathy) or any of R2, R3A or M1, split up by sex and type of diabetes
In order to investigate the ability of the algorithm to predict R2, R3A and M1, 2 years risk was calculated for every individual in the sample and compared with the actual outcome 2 years later. Figure 1A–D shows ROC curves for predicting R2, R3A or M1 based on the 2 year risk estimates. (A) for the total population (B) for patients with type I diabetes only (C) for patients with type II diabetes only (D) any retinopathy grading (any of the criteria, R2, and R3A and M1) for patients with type I and type II diabetes separately.

(A) ROC (receiver operating characteristic) curves for predicting R2 (preproliferative retinopathy), R3A (active proliferative retinopathy) or M1 (diabetic maculopathy), based on the risk estimates of the algorithm. Patients with type I and type II diabetes together. Curves for R2 are coloured in blue, R3A in green and M1 in red. The AUC (area under curve) was: R2: 0.81 (CI 0.79 to 0.83), R3A: 0.78 (CI 0.75 to 0.81), M1: 0.79 (CI 0.77 to 0.80). (B) ROC curves for predicting R2, R3A or M1, based on the risk estimates of the algorithm. Patients with type I diabetes only. Curves for R2 are coloured in blue, R3A in green and M1 in red. The AUC was: R2: 0.72 (CI 0.69 to 0.76), R3A: 0.74 (CI 0.69 to 0.79), M1: 0.68 (CI 0.64 to 0.71). (C) ROC curves for risk predicting of R2, R3A or M1 based on the risk estimates of the algorithm. Patients with type II diabetes only. Curves for R2 are coloured in blue, R3A in green and M1 in red. The AUC was: R2: 0.83 (CI 0.81 to 0.84), R3A: 0.80 (CI 0.76 to 0.83), M1: 0.79 (CI 0.78 to 0.81). (D) ROC curves for predicting any of R2, R3A or M1 based on the risk estimates of the algorithm. Coloured in blue are patients with type II diabetes, and patients with type I diabetes are shown in red. The AUC is 70% for patients with type I diabetes (CI 0.67 to 0.73) and 80% for patients with type II diabetes (CI 0.78 to 0.81).
Risk distribution of the population
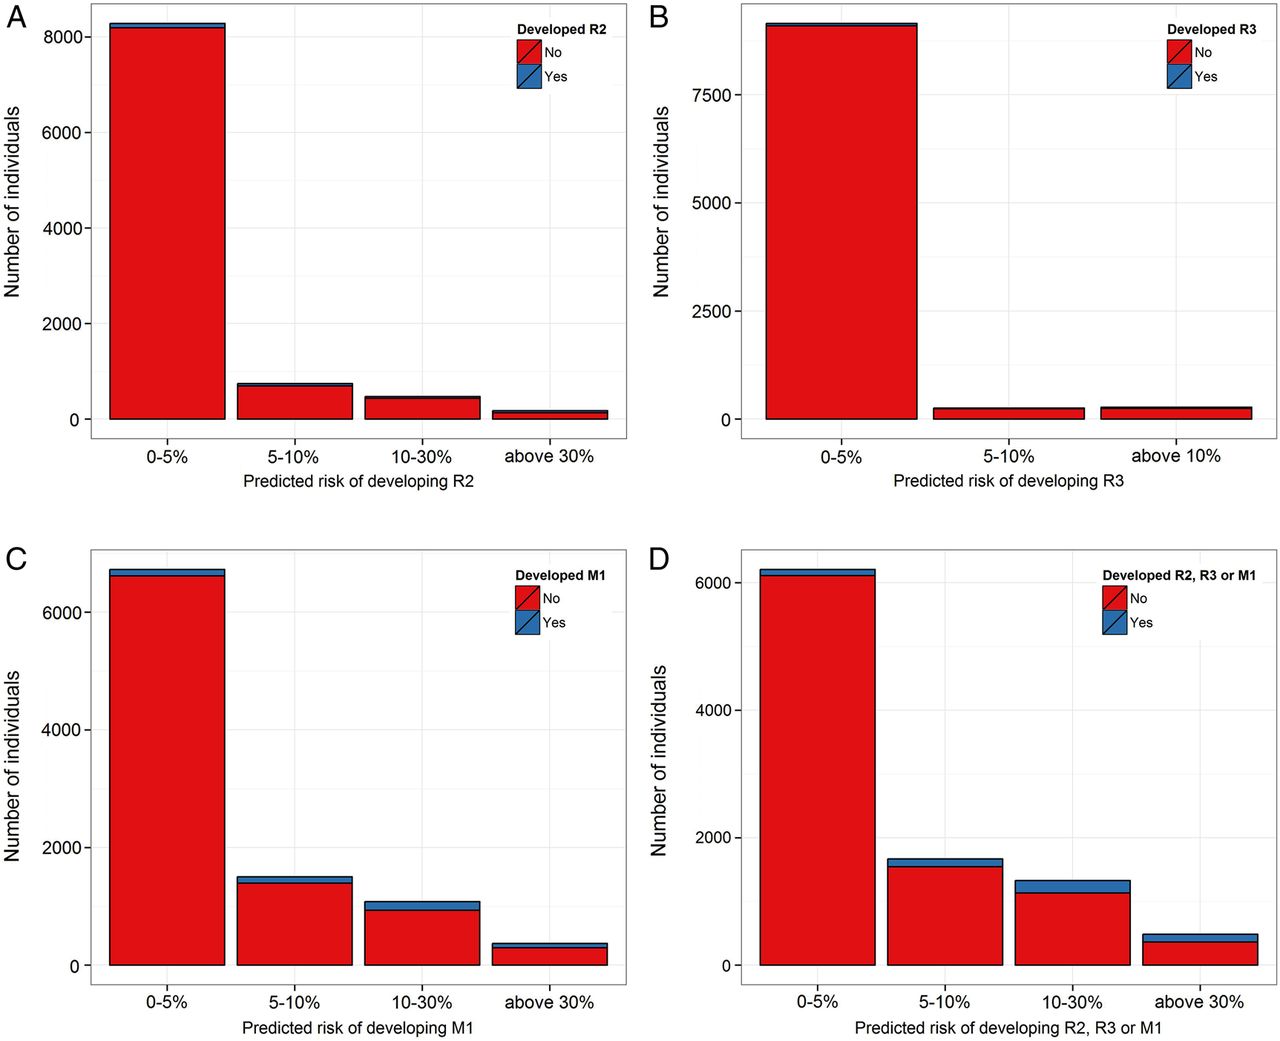
Risk of R2, R3A and M1 was estimated using the risk algorithm adapted to 2 years. The risk score was calibrated to the type of events by multiplying with the ratio of observed number of events. The bar graph in figure 2A–D shows the frequency distribution of the estimated risk of the population. The risk has been categorised into three groups, 0–5%, 5–10% and above 10% and the height of the bars represent the number of individuals with the corresponding risk. Figure 2A shows the risk of developing R2 within 2 years, figure 2B shows risk of developing R3A, figure 2C shows the risk of developing M1 and finally figure 2D shows the risk of developing any of R2, R3A or M1.

(A) Distribution of the estimated adjusted risk of developing R2 (preproliferative retinopathy) within 2 years according to the algorithm. The height of the bar represents the number of individuals that fall within the corresponding risk group. Within 2 years, 8286 had 0–5% risk, 747 had 5–10% and 654 had 10–30% risk of developing R2. (B) Distribution of the estimated adjusted risk of developing R3A (proliferative diabetic retinopathy) within 2 years according to the algorithm. The height of the bar represents the number of individuals that fall within the corresponding risk group. Within 2 years, 9150 had 0–5% risk, 258 had 5–10% and 279 had 10–30% risk of developing R3A. (C) Distribution of the estimated adjusted risk of developing M1 (diabetic macular oedema) within 2 years according to the algorithm. The height of the bar represents the number of individuals that fall within the corresponding risk group. Within 2 years 6728 had 0–5% risk, 1506 had 5–10% and 1453 had 10–30% risk of developing M1. (D) Distribution of the estimated adjusted risk of developing any of R2 (moderate or severe preproliferative retinopathy), R3A (proliferative retinopathy) or M1 (diabetic maculopathy) within 2 years according to the algorithm. The height of the bar represents the number of individuals that fall within the corresponding risk group. Within 2 years 6207 had 0–5% risk, 1666 had 5–10% and 1814 had 10–30% risk of developing R2, R3A or M1.
Screening interval recommendations
The observed 1 year frequency of each of the retinopathy grading (R2, R3A and M1) was calculated for sex and type of diabetes separately. For every individual, the recommended screening interval was set at the time period over which the risk of developing R2, R3A or M1 would be identical to the mean annual incidence within the cohort. The annual incidence for each group was shown in table 1. Table 2 shows the mean screening intervals of the patients by the type of diabetes and whether they developed R2, R3A or M1 within 2 years or not. The results are shown for intervals with a 6 months floor and a 24 months ceiling.
Average recommended screening intervals by type of diabetes in individuals who either developed R2 (preproliferative retinopathy), R3A (active proliferative retinopathy) or M1 (diabetic maculopathy) within 2 years or not
Discussion
The mathematical algorithm reliably predicts progression of diabetic retinopathy in the English cohort, as it did previously in Danish,7 Dutch8 and Spanish cohorts.9 It identifies a relatively small group of high-risk patients based on clinical data, who need frequent screening, while a much larger group at low risk is well served with less frequent screening, which may reduce costs for health systems and patients alike.
The system, if used in conjunction with a live data feed from clinical systems, can automatically adjust to a change in circumstances of the patient such as a change of medication or lifestyle that is likely to affect prognosis. It can also add other validated risk factors such as microaneurysm turnover to possibly predict outcomes even more accurately.
The risk estimates can serve as a basis to classify patients into low risk, medium risk and high risk, that is, patients with lower than 5% annual risk of any progression can be classified as low risk, whereas patients with 5–10% risk would be classified as medium and patients with greater than 10% annual risk would be classified as high risk. In countries with limited healthcare resources, this approach may be used to prioritise patients for diabetic eye screening.
For patients with type II diabetes, the area under the curve is 0.80 for the prediction model for the risk of developing R2, R3A or M1. This indicates that there is 80% probability that a randomly selected patient that develops background retinopathy will be given a higher risk score and therefore a shorter screening interval than a patient that does not develop R2, R3A or M1. The ROC curves and risk prediction seems very reliable for patients with type II diabetes, but with the lower numbers of patients with type I diabetes, there is more variability in the outcomes in this group. The patients with type I diabetes are only about 5% of the total cohort. This is lower than the UK average of about 10% (https://www.diabetes.org.uk/documents/reports/diabetes_in_the_uk_2010.pdf).11 The analysis in the type II cohort may be seen as more robust and it may be wise to implement this algorithm initially in patients with type II diabetes.
By applying a 6 months floor and a 24 months ceiling, the screening frequency can be reduced by 40% for patients with type II diabetes without compromising safety. Lowering the risk margin such that the average screening interval of patients that develop R2, R3A or M1 is unchanged at 12 months, leads to 36% reduction in screening visits and presumably also cost.
McGhee et al12 discuss the applicability of our algorithm in diabetic retinopathy screening and potential pitfalls. They point out that a 5 years ceiling for intervals in screening, which is proposed as one possibility in our earlier reports,7 may be dangerously long because patients’ clinical risk factors may change during this long period. This is true and for a 3–5 years screening interval to succeed, recalculation of risk would need to take place in the diabetes or general practice clinic during the interval. It may be most practical to use a 2 years ceiling on the screening interval, at least in the beginning. This approach increases the mean screening interval in patients with type II diabetes from 12 months to 20 months, which is 40% reduction in screening frequency. This is a very substantial cost reduction and avoids the potential difficulties of longer intervals. Biennial screening has long safety record in Iceland and Sweden.4 Similar success with extended screening intervals has been reported in the UK.13
In countries with limited clinical and financial resources, the algorithm may be used to identify high-risk patients with diabetes and prioritise who gets access to retinopathy screening and possibly bring to light the need for other appropriate health interventions. This may help deal with the consequences of the global epidemic of diabetes mellitus. To date the algorithm has been validated in mostly Caucasian European countries. Validation in other ethnic groups and countries is needed for the global application of this approach.
Individualised risk assessment inherently increases individual patient safety. High-risk patients are reliably identified and screening intervals shortened appropriately. It is possible to introduce whatever safety margin is desired and is economically feasible; a live feed of clinical data will also assist in reducing risk. There is greater risk in treating all patients with diabetes as equal (in terms of risk of progression), for outliers in the group are likely to suffer from management parameters aimed at the average risk level.
Conclusion
The algorithm reliably predicts the risk of progression of diabetic retinopathy to R2, R3A and M1.
Validation studies of the cohort in Danish, Dutch, Spanish and now English cohorts give similar results.
Risk profiles for the cohort show that a great majority is at less than 3.4% risk of progression between stages in 1 year. A small high-risk group is identified.
With standard average risk for progression at next visit, the mean screening interval for patients with type II diabetes can be extended from 12 months to 20 months with 40% reduction in frequency and costs.
References
Footnotes
Twitter Follow Sigrun Lund at @sigrunlund
Contributors ES originally proposed the concept of risk assessment to control the frequency of diabetic retinopathy screening. TA developed the algorithm. SHL performed the statistical analysis of the data and wrote the first draft. SE prepared the computer software used in the study. OP managed the execution of the study and contributed to the study design. PK and GR provided the data banks used. All authors contributed to study design and writing of the manuscript.
Funding The study was supported by research grants from The Icelandic Research Council.
Competing interests All authors have potential commercial interests. ES, TA, OP and SE are shareholders of Risk ehf that developed the risk algorithm used in the study. PK and GR are employees and shareholders of Health Intelligence, which is involved in diabetic eye screening in England. SHL is a previous employee of Risk ehf.
Provenance and peer review Not commissioned; externally peer reviewed.
Linked Articles
- At a glance